- Analytics
- News and Tools
- Quotes
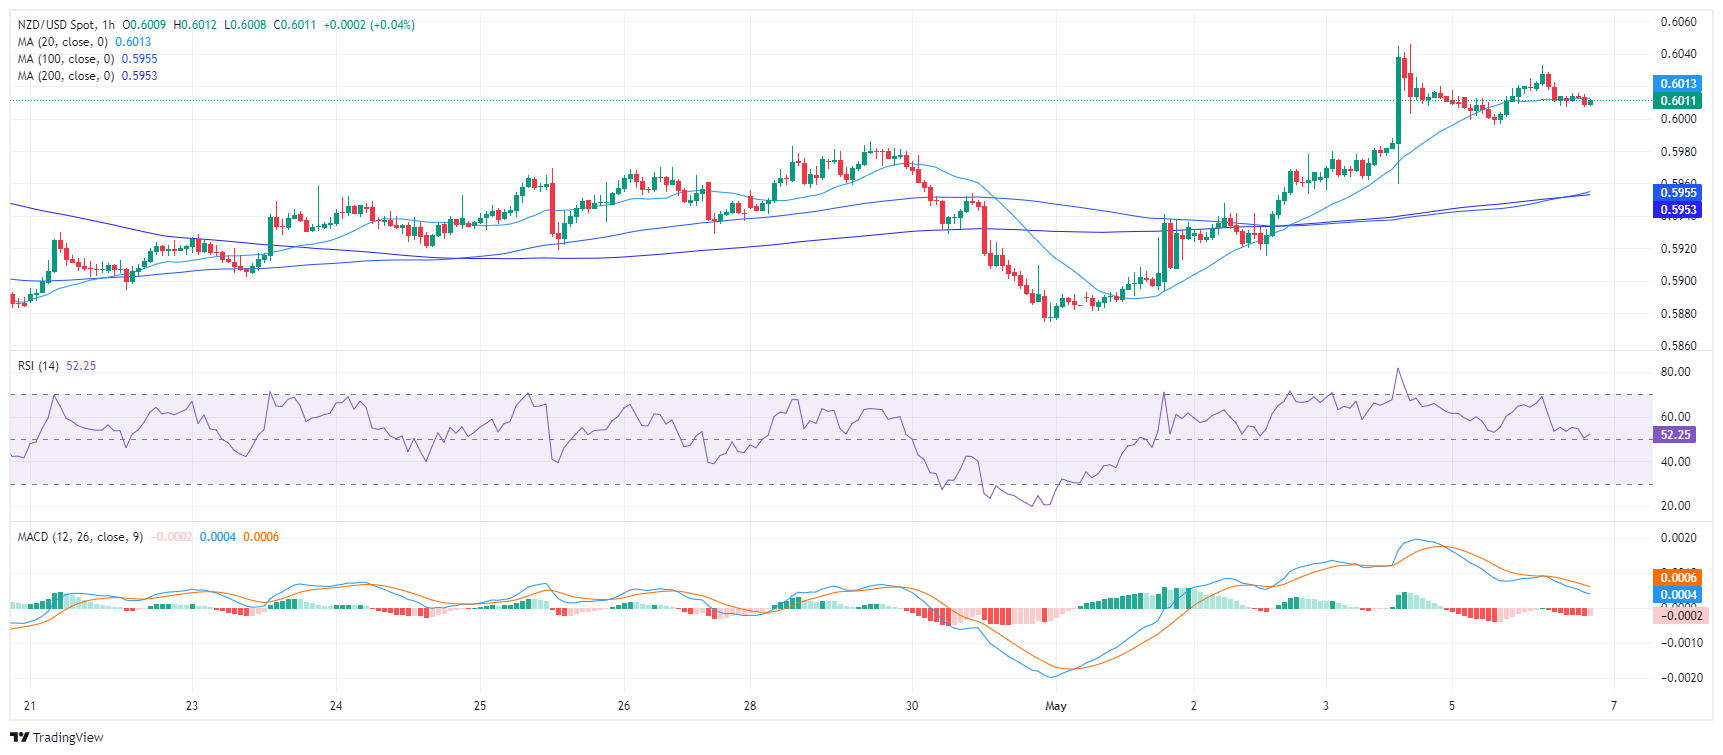
- Chart and quotes for NZDUSD
CFD Trading Rate New Zealand Dollar vs US Dollar (NZDUSD)
| Date | Rate | Change |
|---|
Related news
-
17.05.2024 01:49NZD/USD depreciates to near 0.6100 due to the improved US Dollar
- NZD/USD extends losses due to the upward correction in the US Dollar.
- Fed remains cautious about inflation and potential rate cuts in 2024.
- The New Zealand Dollar could draw some support from higher PPI inputs and outputs for Q1.
The NZD/USD pair extended its losses to near 0.6110 during the Asian session on Friday. This decline can be attributed to the recovery of the US Dollar (USD), which rebounded after hitting multi-week lows around 104.00 on Thursday.
The Federal Reserve (Fed) maintains a cautious stance regarding inflation and the potential for rate cuts in 2024. On Thursday, Fed Bank of Atlanta President Raphael Bostic emphasized the need for patience with interest rates, noting that substantial pricing pressure persists in the US economy.
Additionally, Cleveland Fed President Loretta Mester indicated that it might take longer than anticipated to confidently ascertain the inflation trajectory, suggesting that the Fed should maintain its restrictive stance for an extended period.
Furthermore, the US Department of Labor released the US Initial Jobless Claims on Thursday. The number of Americans filing new claims for jobless benefits rose to 222,000 for the week ending May 10, surpassing the market consensus of 220,000 but below the previous week's figure of 232,000.
On the Kiwi front, New Zealand's Producer Price Index (PPI) inputs and outputs increased in the first quarter. PPI input prices rose by 0.7% compared to the expected 0.7%. While PPI output prices increased by 0.9% against the expected 0.5%. These higher-than-expected PPI figures could provide some support for the New Zealand Dollar (NZD), potentially limiting the downside of the NZD/USD pair.
According to Stats NZ, the largest contributors to the rise in output prices were electricity and gas, which saw an 8.8% quarter-on-quarter increase. Energy costs also significantly impacted input prices, climbing 11.6%. Additionally, insurance costs substantially contributed to the increase in PPI input costs, rising by 5.0% quarter-on-quarter.
-
16.05.2024 22:15NZD/USD Price Analysis: Buyers take a breather after Wednesday’s rally, outlook remains positive
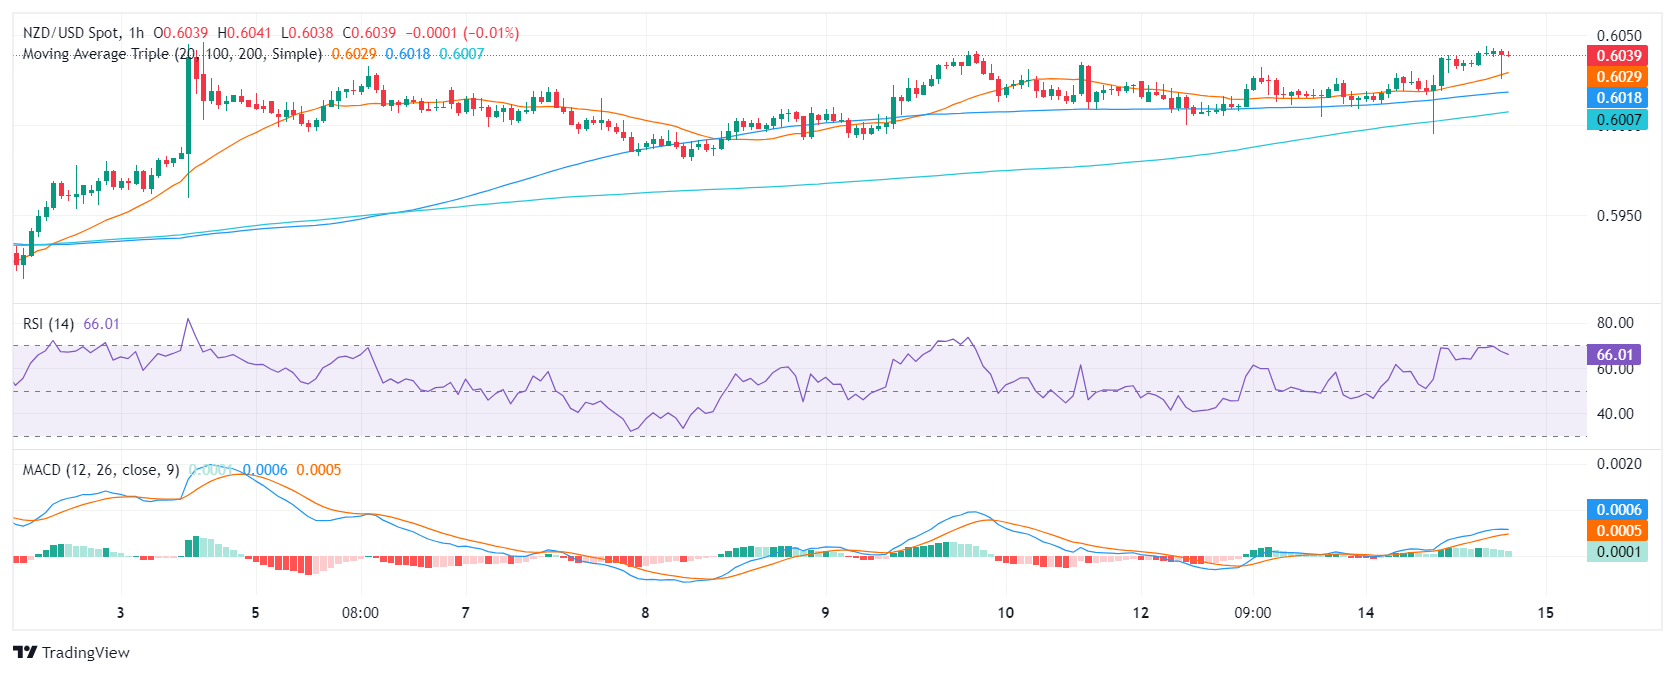
- The daily RSI shows that the pair has strong positive momentum, approaching overbought conditions but turning flat.
- Hourly RSI indicates a slight retreat, hinting at some short-term consolidation.
- The pair remains firm above its main SMAs, signaling a solid bullish sentiment in the near and distant future.
On Thursday's session, the NZD/USD remained flat at around 0.6120, as investors seem to be taking profits. After the Kiwi jumped above its main Simple Moving Averages (SMAs) the outlook turned bullish for the pair, but further consolidation may be in the horizon.
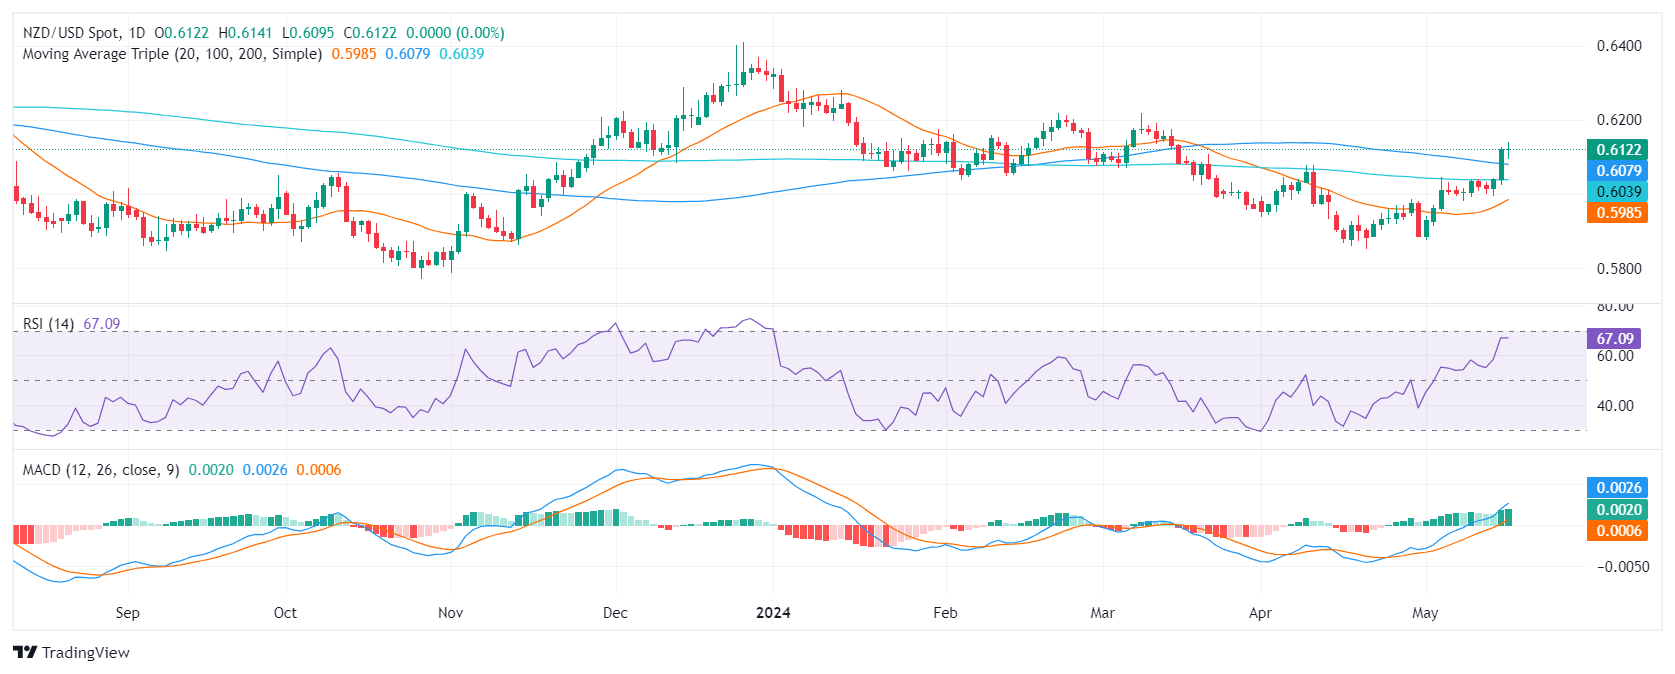
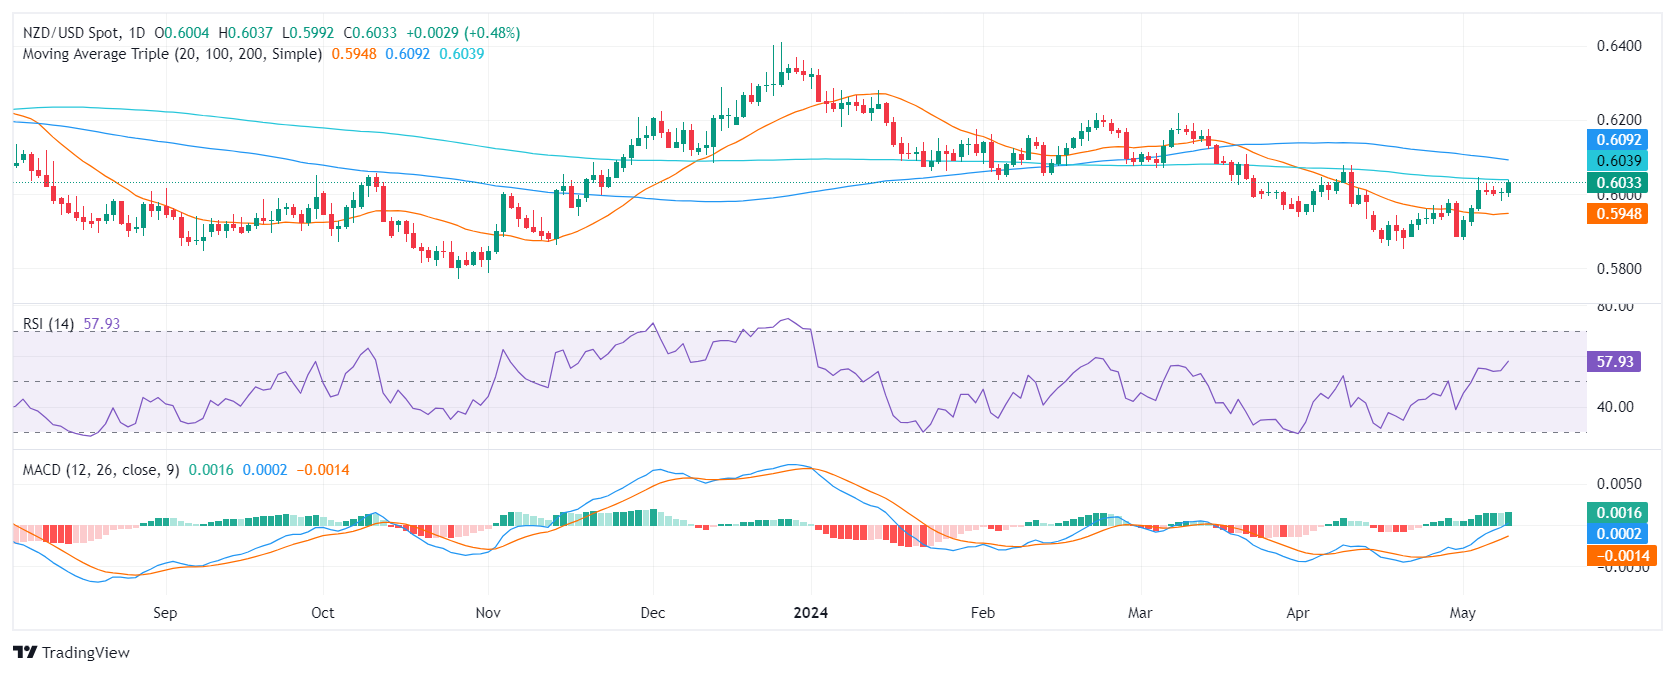
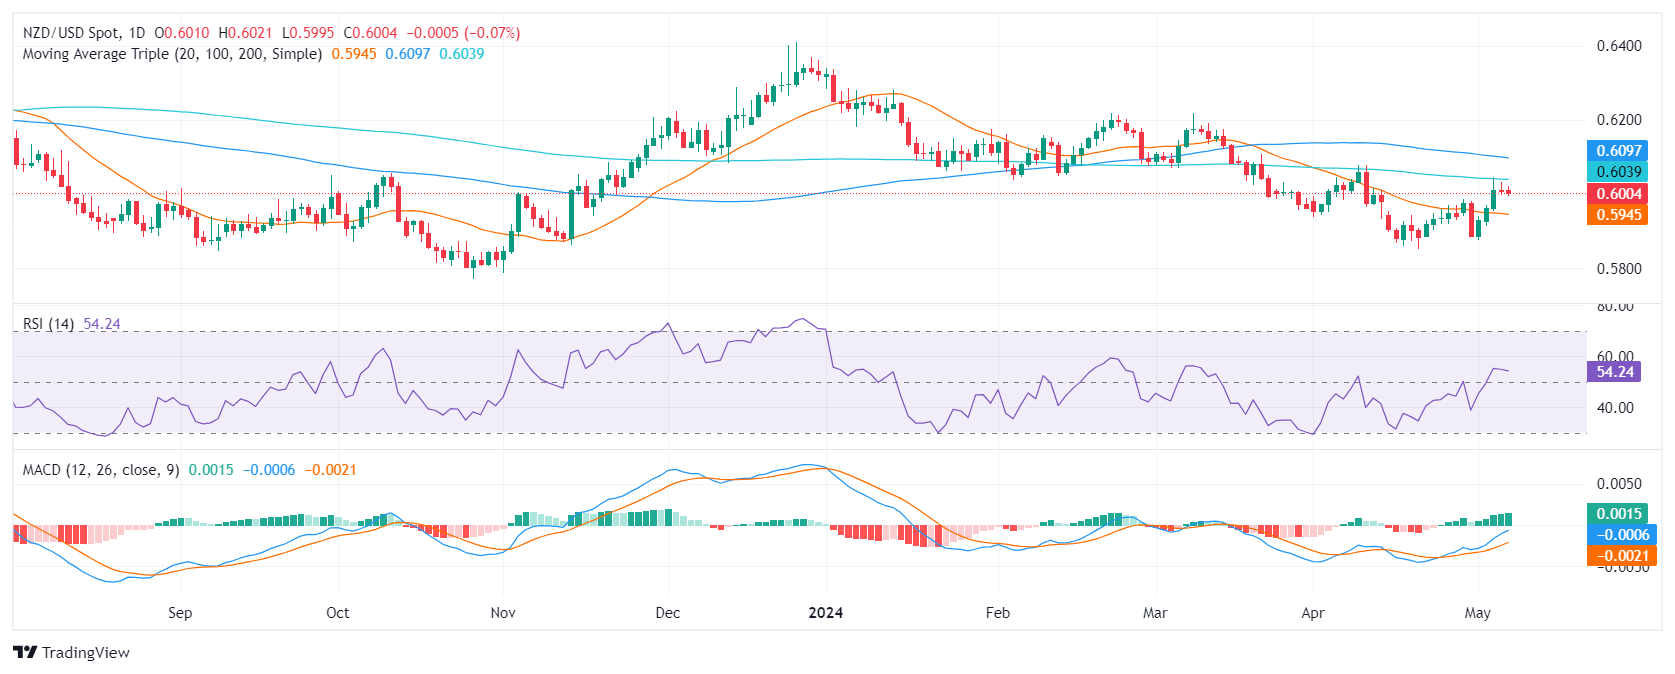
On the daily chart, the Relative Strength Index (RSI) shows positive momentum, fluctuating within positive territory, and nearing overbought status but turned flat on Thursday. The green bars of the Moving Average Convergence Divergence (MACD) reinforce the positive trend but are also flattened.
NZD/USD daily chart
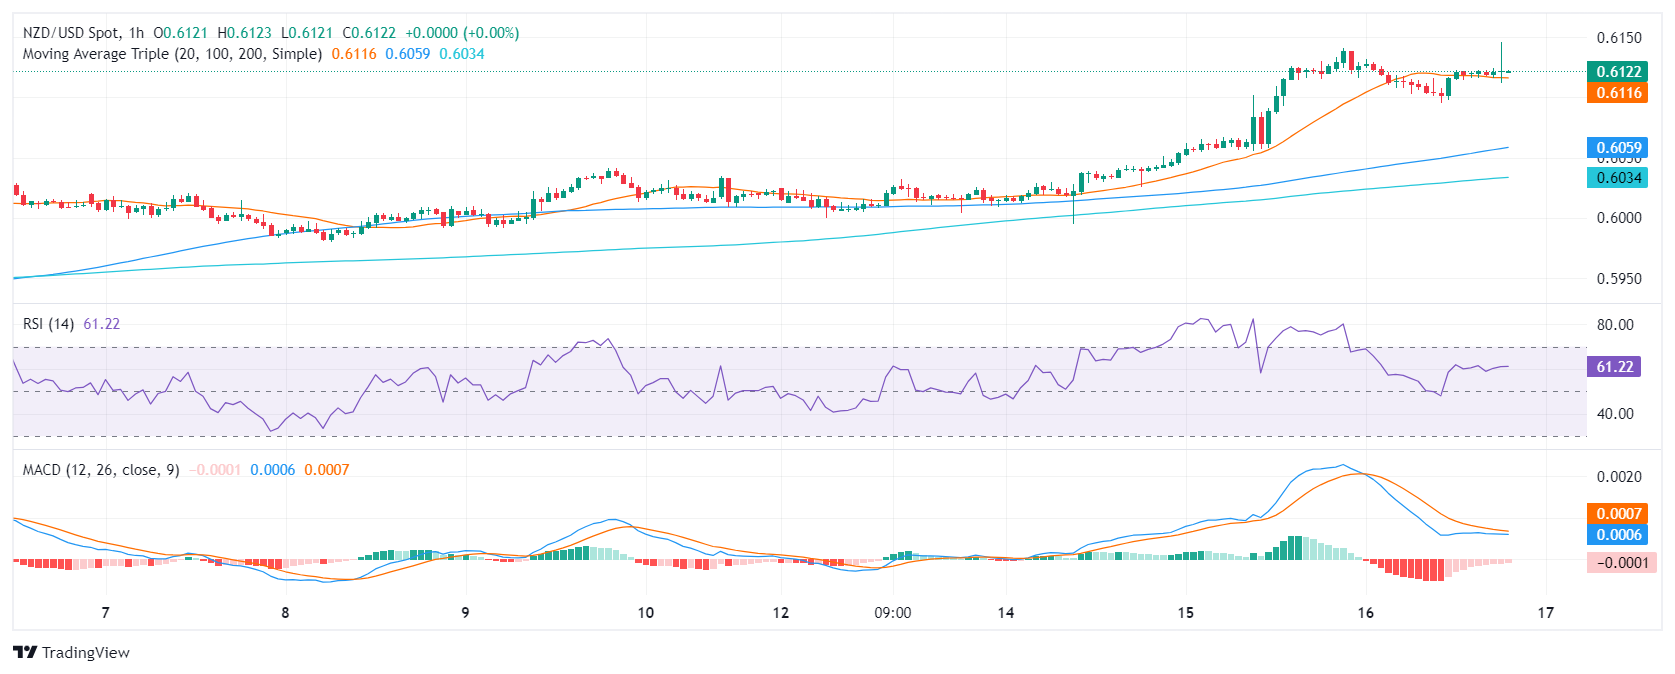
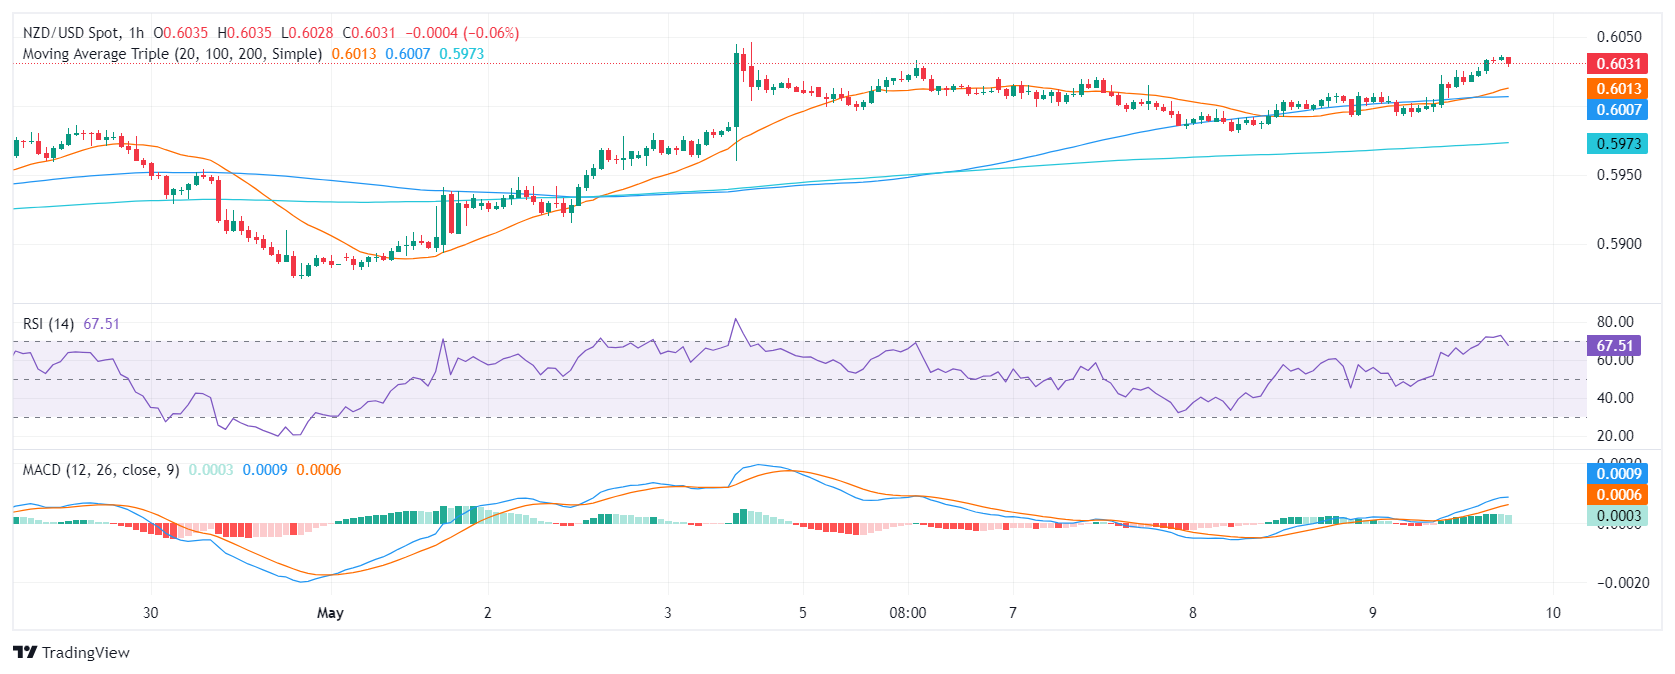
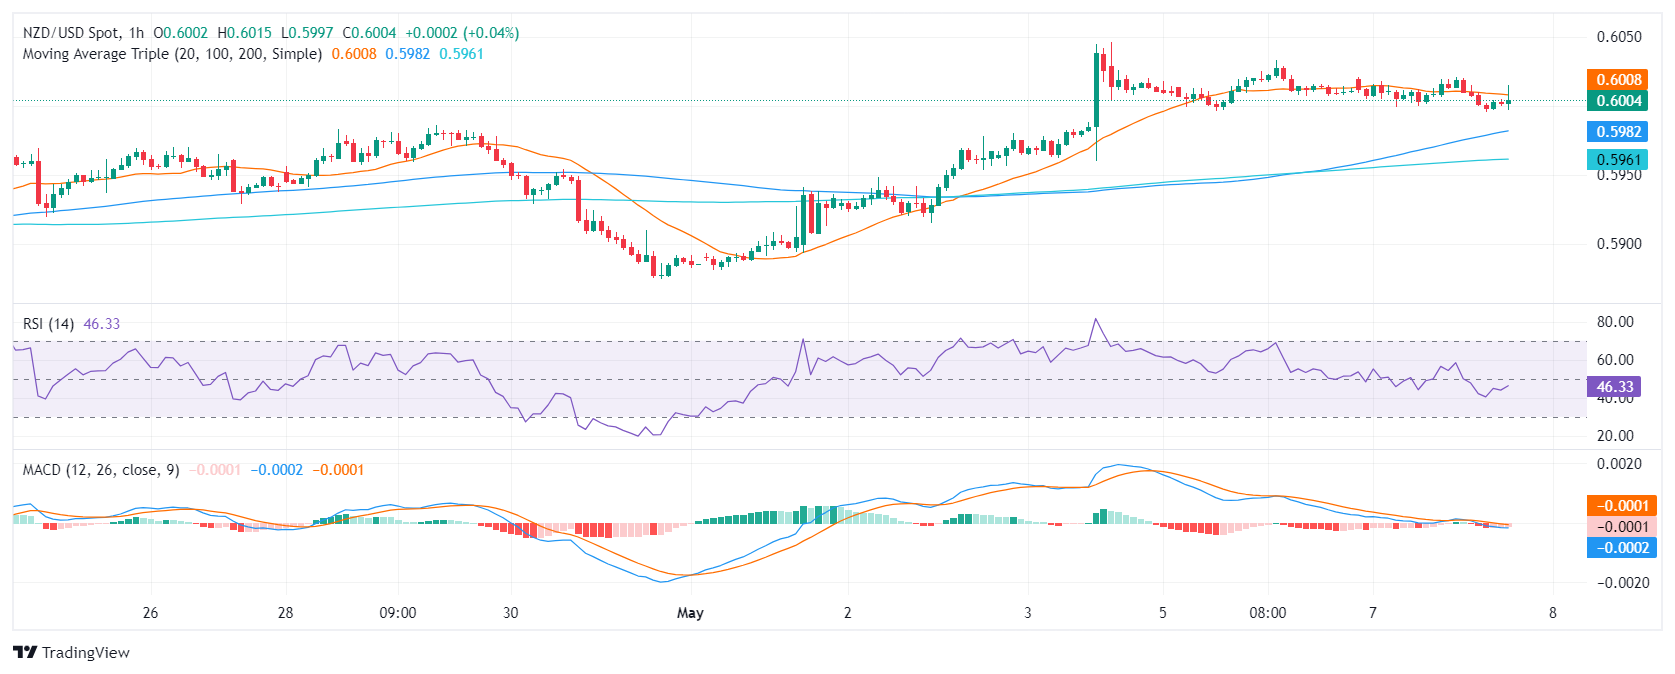
Moving to the hourly chart, mixed signals are visible. The RSI retreated slightly after being deep in overbought terrain, revealing a subtle slowdown in buying enthusiasm in recent hours. The red bars of the MACD suggest that the buying traction was weak in the last hours.
NZD/USD hourly chart
To conclude, bearing in mind the positive RSI indicators and the green MACD histogram, alongside the currency pair being above critical SMAs, the market seems to favor the bulls for the NZD/USD pair in both the short and long term but further consolidation shouldn’t be taken off the table. However, the conquered 100- and 200-day SMA will be a strong support that could limit losses.
-
16.05.2024 09:18NZD/USD Price Analysis: Could test the psychological support of 0.6100
- NZD/USD pulls back from a two-month high of 0.6140 marked on Thursday.
- Technical analysis suggests a confirmation of the bullish trend for the pair.
- The pair could find the key resistance at the major level of 0.6150.
NZD/USD retreats from a two-month high of 0.6140, trading around 0.6110 during the European session on Thursday. The pair depreciates due to an upward correction in the US Dollar (USD), which could be attributed to the improved US Treasury yields.
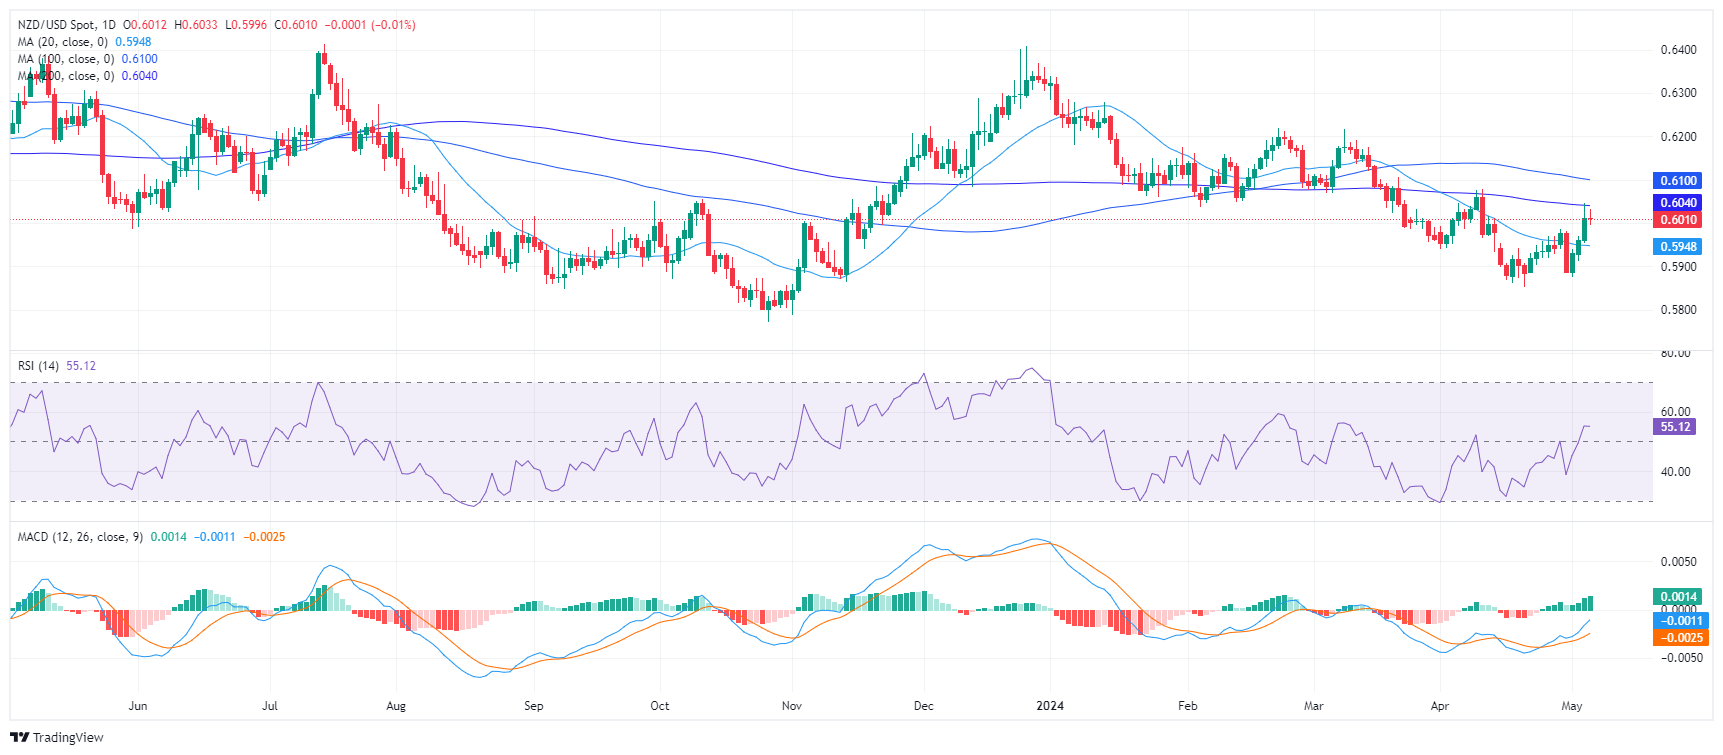
As per the technical analysis, the momentum indicator Moving Average Convergence Divergence (MACD) suggests an upward trend for the NZD/USD pair. This is indicated by the placement of the MACD line above the centerline and shows the divergence above the signal line.
Additionally, the 14-day Relative Strength Index (RSI) remains above the 50 level, indicating a confirmation of the bullish sentiment.
On a daily chart, the key resistance appears at the major level of 0.6150. A break above this level could lead the NZD/USD pair to explore the region around the psychological level of 0.6200, followed by March’s high at 0.6218.
On the downside, the psychological level of 0.6100 could act as the immediate support, followed by the 23.6% Fibonacci retracement level of 0.6081, plotting within coordinates of 0.5886 and 0.6141. A break below the latter could prompt the NZD/USD pair to navigate the region around the 14-day Exponential Moving Average (EMA) at 0.6026.
NZD/USD: Daily Chart

-
16.05.2024 02:16NZD/USD gains traction above 0.6100, eyes on US data
- NZD/USD gains ground near 0.6120 in Thursday’s early Asian session.
- US inflation declined to 3.4% in April, prompting traders to increase their bets on the Fed’s rate cuts this year.
- The RBNZ interest rate decision next week will be in the spotlight, with no change in the OCR rate expected.
The NZD/USD pair gains momentum around 0.6120 during the early trading hours on Thursday. The softer US CPI in April has prompted the prospect of rate cuts from the Federal Reserve (Fed) this year, which exerts some selling pressure on the Greenback. The US housing data, the weekly Initial Jobless Claims, the Philly Fed Manufacturing Index, and Industrial Production will be due later in the day.
Inflation in the United States showed signs of cooling after the US Bureau of Labor Statistics (BLS) reported on Wednesday. The CPI rose by 3.4% YoY, compared to March’s reading of 3.5%, in line with the estimation. The core CPI inflation, which excludes volatile items like food and energy, eased from 3.8% in March to 3.6% in April as expected. Furthermore, US Retail Sales came in at 0% MoM in April, below the market consensus of 0.4%. In response to the softer inflation data and weaker Retail Sales, the US Dollar (USD) loses ground to near five-week lows of 104.20.
Investors anticipate that the Fed will wait for more data to gain confidence that inflation will return to the Fed’s 2% target. The Federal Reserve (Fed) Chairman Jerome Powell said on Tuesday that inflation is falling slower than expected, and the PPI data provided more justification to keep rates higher for longer.
On the Kiwi front, the markets believe that it is unlikely that the RBNZ will cut its interest rate before the Fed, which boosts the New Zealand Dollar (NZD) and create a tailwind for the NZD/USD pair. The Reserve Bank of New Zealand (RBNZ) interest rate decision next week will be closely watched. The RBNZ is anticipated to hold the Official Cash Rate (OCR) unchanged at 5.5% at its May meeting and likely to remain comfortable with the forward outlook communicated in the February meeting, said Westpac analyst.
-
15.05.2024 21:42NZD/USD Price Analysis: Bulls gather traction and brighten the outlook, indicators hit overbought conditions
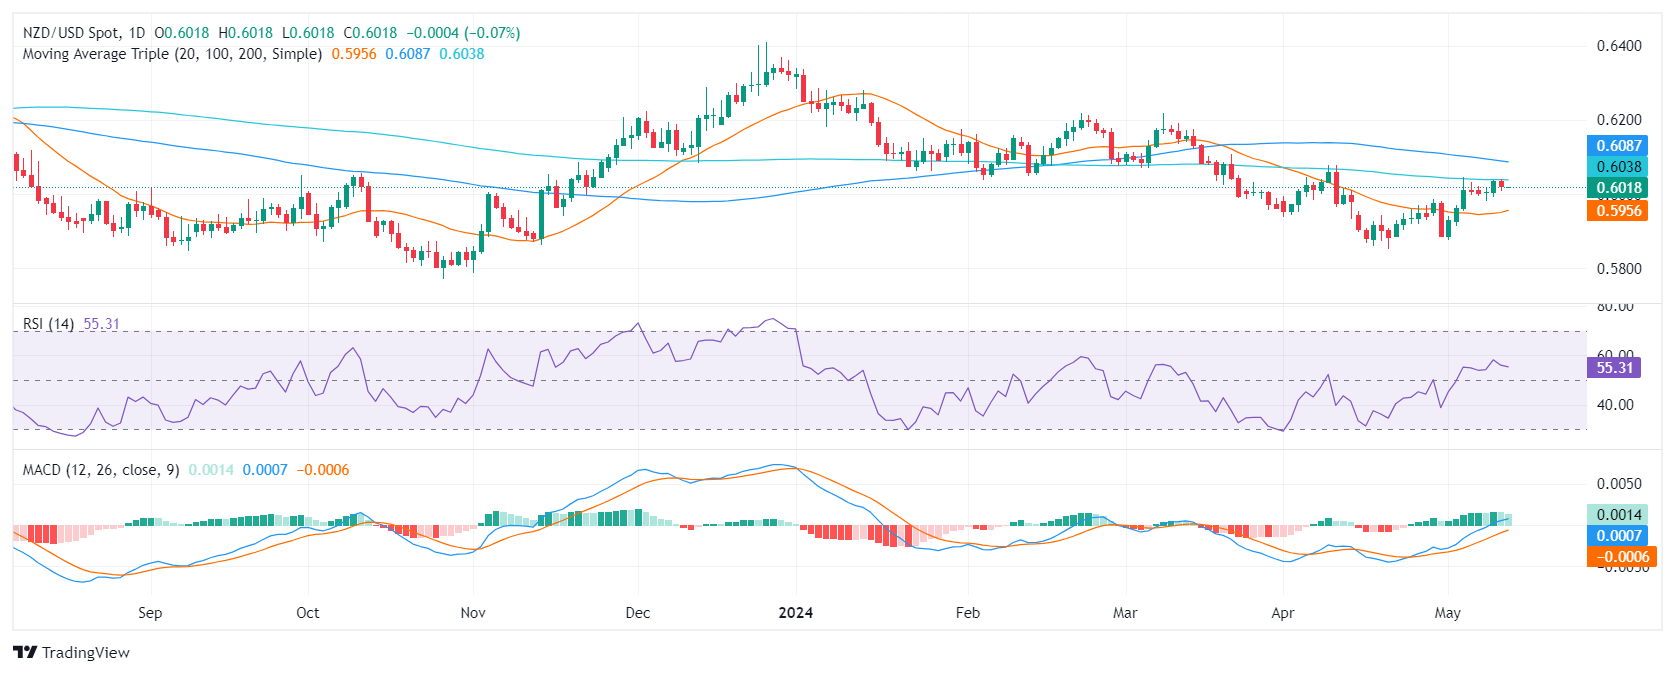
- The daily RSI of the NZD/USD signals it is approaching overbought, which often indicates future consolidation or potential reversal.
- The same indicators in the hourly chart further strengthen this view, specifically, with the RSI crossing the 70 mark.
- Buyers regained the 100 and 200-day SMAs, and this points to a bullish outlook.
In the Wednesday session, the NZD/USD pair rides a strong bullish wave, with a recent increase of 1.28%. The uptick made the pair jump above its 100 and 200-day Simple Moving Averages (SMAs), indicating that the outlook turned positive for the pair. However, as indicators approach overbought conditions, a consolidation may be incoming.
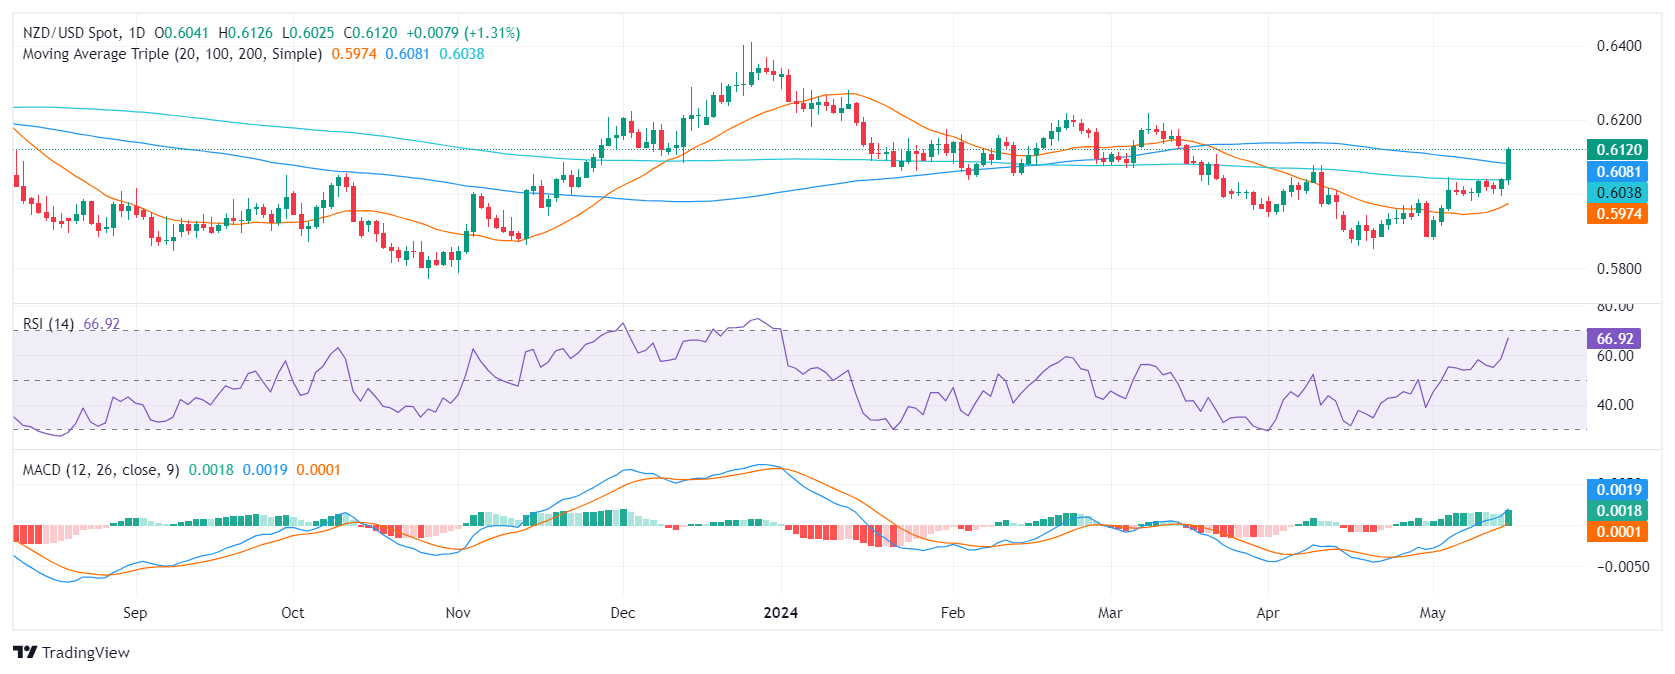
On the daily chart, the Relative Strength Index (RSI) indicates that NZD/USD is approaching overbought territory. The positive trend evident over the past few days, along with the recent surge, reveals that the strength is currently with buyers. However, this upward pressure may soon decrease, as the RSI nearing overbought conditions often signals future consolidation or potential reversal.
NZD/USD daily chart
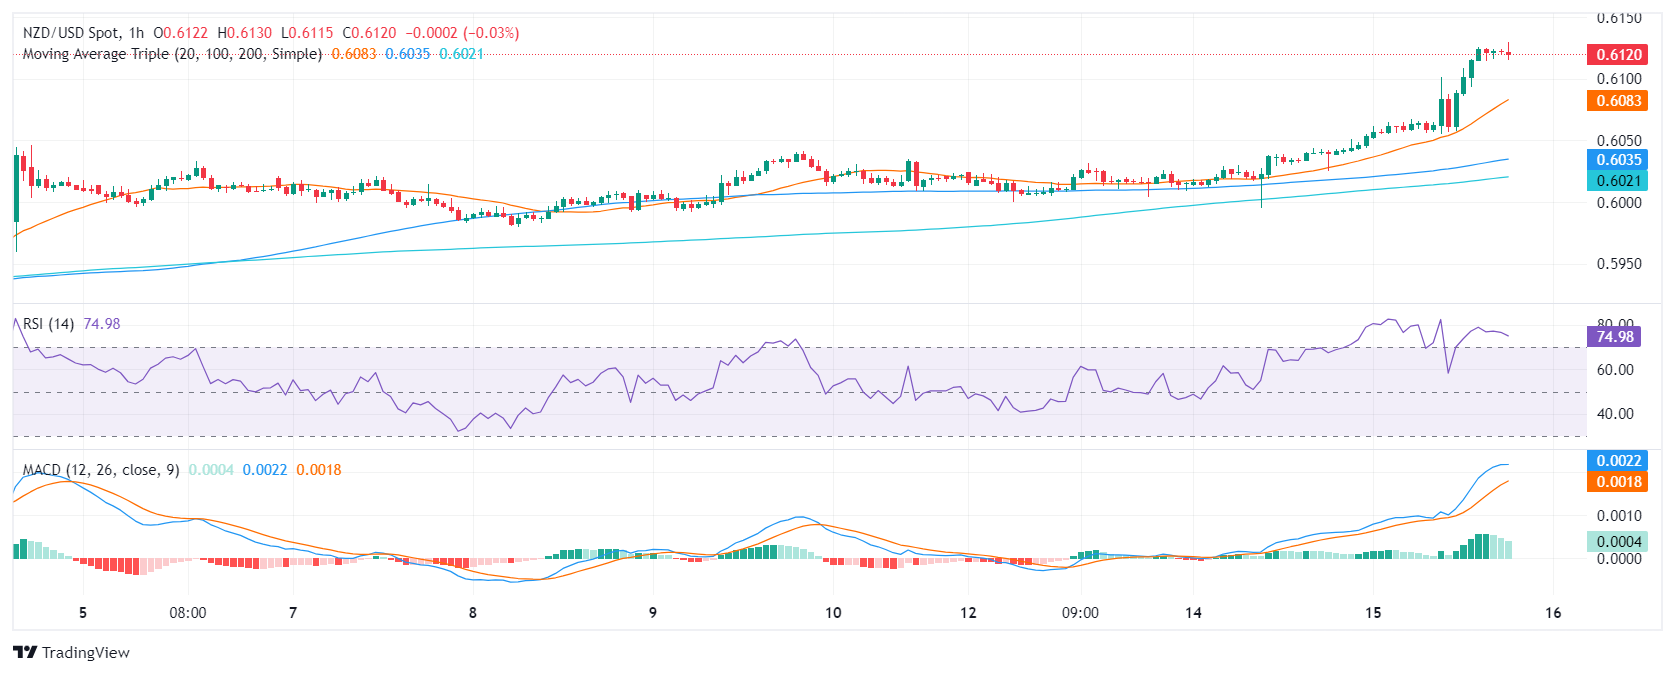
The hourly chart shows that RSI readings exceeded 70, reinforcing indications of overbought conditions. The recent Moving Average Convergence Divergence (MACD) showing flat green bars indicates sustained but flat positive momentum.
NZD/USD hourly chart
In conclusion, the technical indicators for NZD/USD suggest strong buyer momentum. However, the RSI's proximity to overbought conditions hints at a potential easing of this upward pressure. This, coupled with the strong bullish trend indicated by the jumping above longer-term SMAs, presents a positive outlook but demands careful observation for potential corrections.
-
15.05.2024 05:35NZD/USD attracts some buyers above 0.6060, focus on US PPI and CPI data
- NZD/USD holds positive ground around 0.6055, adding 0.32% in Wednesday’s early European session.
- Fed’s Powell said inflation might prove to be more persistent than expected, keeping the Fed to hold rate higher for longer.
- Westpac analysts anticipate the RBNZ will leave the OCR at 5.5% at its May meeting next week.
The NZD/USD pair gains traction near 0.6055 on Wednesday during the early European trading hours. The pair edges higher for the second consecutive day and holds above the key 100-day Exponential Moving Average (EMA), supported by the softer USD Index (DXY) below the 105.00 level. The final reading of the US Consumer Price Index (CPI) and Retail Sales for April will be in the spotlight later on Wednesday.
The Federal Reserve (Fed) Chairman Jerome Powell said on Tuesday that inflation in the US might prove to be more persistent than expected, keeping the Fed holding rate higher for longer to achieve the central bank’s 2% target. Powell added that it is unlikely to hike rates more, even if the chances for rate cuts have become less. Investors have priced in nearly a 65% chance of a rate cut by the Fed in September 2024, according to the CME's FedWatch Tool.
The US Producer Price Index (PPI), wholesale inflation, hit its highest rate in a year, according to the Bureau of Labor Statistics on Tuesday. The annual PPI rose 2.2% YoY in April, compared to the 1.8% increase in March (revised from 2.1%), in line with the estimate. The Core PPI jumped 2.4% YoY in April, compared to an increase of 2.1% in the previous reading. The April CPI data might offer some hints about future monetary policy by the Fed. The hotter inflation outcome could delay the rate cut timeline for this year and lift the Greenback against its rivals.
On the Kiwi front, the Reserve Bank of New Zealand (RBNZ) will hold its meeting next week. Westpac analysts expect the RBNZ will leave the Official Cash Rate (OCR) unchanged at 5.5% at its May meeting. The New Zealand central bank is likely to remain comfortable with the forward outlook communicated in the February meeting. The markets believe that it is unlikely that the RBNZ will ease its policy before the Fed. This, in turn, might provide some support to the Kiwi and act as a tailwind for NZD/USD for the time being.
-
14.05.2024 22:11NZD/USD Price Analysis: Bearish trend sustains despite upward movements
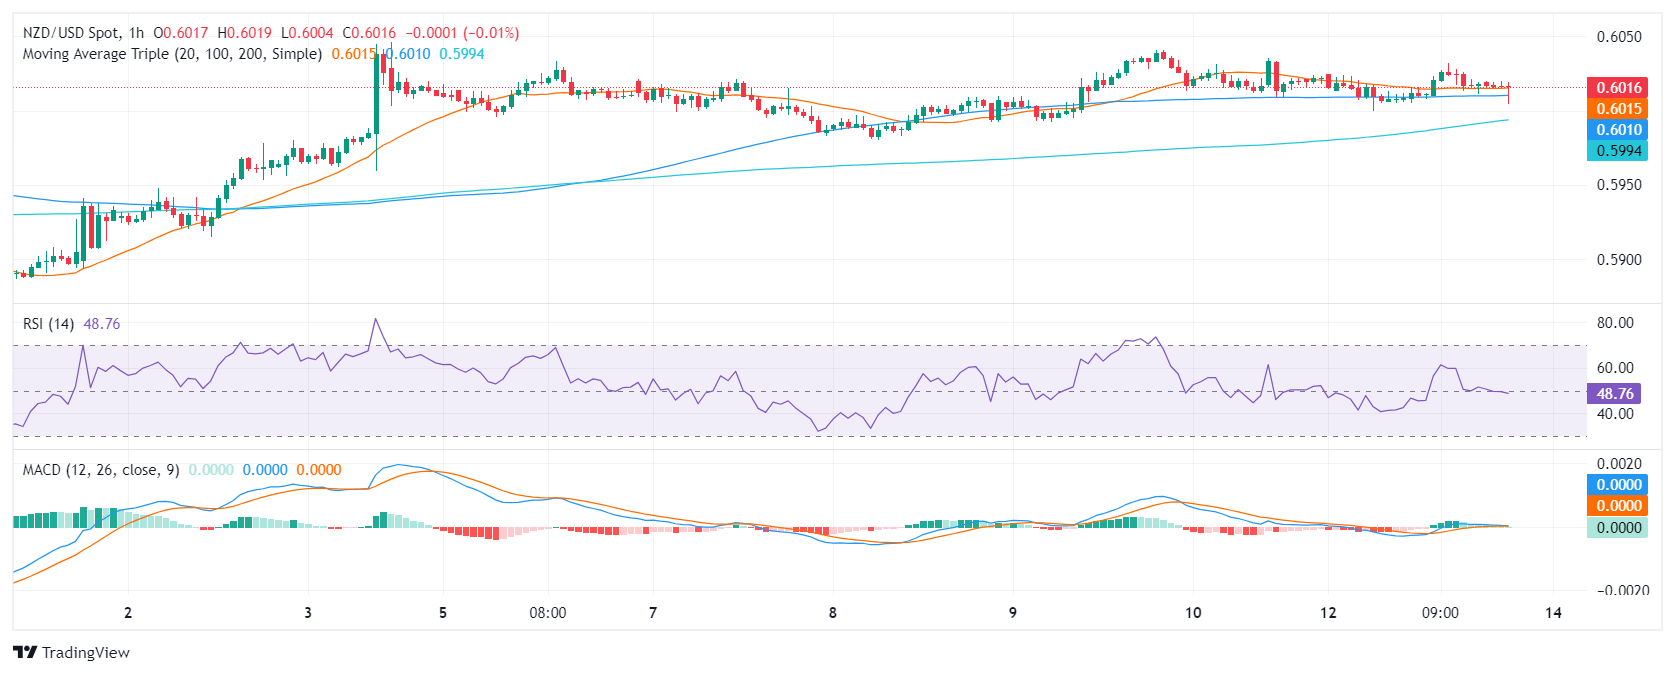
- The daily RSI and MACD of the NZD/USD highlight a growing buying momentum.
- The hourly RSI and MACD show a gradual reduction in the bullish momentum as indicators neared overbought conditions.
- For further upwards movements, the buyers will need to reclaim the main 200-day SMAs.
On Tuesday, the NZD/USD saw gains but the pair maintains and overall bearish outlook. Despite a marginal recovery challenge to the 200-day Simple Moving Averages (SMA), momentum stays subdued. Should the pair fail to breach the 200-day SMA in the near term, further downward movement might be impending.
The daily Relative Strength Index (RSI) for the NZD/USD pair on the daily chart reflects a positive trend. With the latest reading positioned above the 50 level, the pair is leaning towards positive territory. The Moving Average Convergence Divergence (MACD) exhibits flat green bars which alludes to a continuation of positive momentum, albeit at a stagnant pace.
NZD/USD daily chart

Comparatively, the hourly RSI has shown fluctuations in positive territory on Tuesday, reaching into the overbought region earlier in the session. The hourly MACD presents decreasing green bars, indicating a slow gradual reduction in the positive momentum as investors may be taking profits ahead of the Asian session.
NZD/USD hourly chart
With that said, the overall picture shows a downward inclination for the NZD/USD. Given its status relative to the key SMAs of 100 and 200-day SMAs, market participants shouldn’t consider the latest movements as a buying signal, unless the buyers manage to conquer the 200-day SMA, which would brighten the outlook for the pair.
-
14.05.2024 05:24NZD/USD extends its downside below 0.6020, US PPI data looms
- NZD/USD attracts some sellers around 0.6015 in Tuesday’s early European session.
- The Fed's Jefferson was the latest policymaker to call for holding rates at current levels until inflation shows more signs of easing.
- New Zealand’s two-year inflation expectations dropped from 2.50% in Q1 to 2.33% in Q2 of 2024.
The NZD/USD pair extends its downside near 0.6015 during the early European session on Tuesday. The downtick of the pair is backed by the stronger US Dollar (USD) broadly. Traders turn to a cautious mood ahead of the US Producer Price Index (PPI) for April and Federal Reserve (Fed) Chair Jerome Powell's speech later in the day.
Fed policymakers emphasized the need to hold the rate for longer amid stubborn inflation in the US. On Monday, Fed Vice Chair Philip Jefferson called for holding rates at current levels until inflation shows more signs of easing, and he will monitor more evidence to make sure that inflation is going to return to the 2% target.
Meanwhile, San Francisco Fed President Mary Daly highlighted the need for prolonged restrictive policy to achieve the Fed's inflation targets. Minneapolis Fed Neel Kashkari noted that he is in “wait and see mode” about future monetary policy. These hawkish remarks have boosted the Greenback broadly and created a headwind for the NZD/USD pair.
On the Kiwi front, the Reserve Bank of New Zealand (RBNZ) showed on Monday that New Zealand’s two-year inflation expectations dropped from 2.50% in Q1 2024 to 2.33% in Q2 of this year, while the average one-year inflation expectations eased to 2.73% in Q2 vs. 3.22% seen in the first quarter of 2024. The falling inflation expectations exert some selling pressure on the New Zealand Dollar (NZD). -
13.05.2024 22:19NZD/USD Price Analysis: Bears tighten their grip and present battle at around 0.6000
- The daily RSI and MACD indicate diminishing buying momentum as bulls struggle to gain further ground.
- The hourly indicators reveal that sellers have a slight upper hand ahead of the Asian session.
In Monday's session, the NZD/USD pair traded with mild losses, and sellers gained ground. As the pair is facing strong resistance at the 200-day Simple Moving Average (SMA), the pair struggles to consolidate advances. Indicators are flattening and indicate that the moment of the bulls may be coming to an end.
On the daily chart, the Relative Strength Index (RSI) shows a flattening traction above 50. At the same time, the Moving Average Convergence Divergence (MACD) histogram reveals a decrease in buying momentum, demonstrated by diminishing green bars.
NZD/USD daily chart
The hourly RSI indicates a slightly negative trend with the latest reading falling towards its middlepoint, showing a slight dominance from the sellers in the market. This is supported by the MACD, which also prints decreasing green bars, further confirming the decrease in buying momentum at an intraday level.
NZD/USD hourly chart
Interpreting the broader perspective, the NZD/USD is positioned below the thresholds of its 100, 200-day Simple Moving Averages (SMA). Significant bearish momentum, implying a prevailing downward trend in both the medium and long term. However, if the buyers defend the 20-day SMA, they may still have some hope to make another stride to reclaim the 200-day SMA.4
-
13.05.2024 04:47NZD/USD drops to near 0.6000 after the release of the softer Kiwi data
- NZD/USD has depreciated as the softer Inflation Expectations (Q2) fueled speculation that the RBNZ may lower rates in 2024.
- The Kiwi Business NZ PSI fell to 47.1 in April, its lowest level since January 2022.
- Minneapolis Fed President Neel Kashkari refrained from completely dismissing another rate hike.
NZD/USD continues to lose ground for the second session, trading around 0.6000 during the Asian session on Monday. The New Zealand Dollar (NZD) depreciated following the release of the 2-year RBNZ Inflation Expectations (QoQ) for the second quarter, which fell to 2.33% from the previous quarter's 2.50%. This decline has fueled speculation that the Reserve Bank of New Zealand (RBNZ) might consider lowering rates later in 2024.
Moreover, the Kiwi Dollar faced pressure as Monday’s Business NZ PSI, a key indicator measuring business activity in New Zealand's services sector, dropped to 47.1 in April, its lowest level since January 2022. Although, on Friday, the Business NZ Performance of Manufacturing Index (PMI) rose to 48.9 in April from March's 46.8, it remained below February's reading of 49.1.
The US Dollar Index (DXY), which measures the performance of the US Dollar (USD) against six major currencies, continues to strengthen as traders analyze Friday's crucial economic data from the United States (US) and cautious remarks from Federal Reserve (Fed) officials regarding potential interest rate adjustments. However, the recent decline in US Treasury yields may impede the Greenback's upward momentum.
On Friday, the University of Michigan Consumer Sentiment Index, dropped to 67.4 in May from April's 77.2, marking a six-month low and falling short of market expectations of 76 reading. Meanwhile, the UoM 5-year Consumer Inflation Expectation rose to 3.1%, a six-month high, up from 3.0% prior.
As reported by Reuters, Neel Kashkari, President of the Minneapolis Federal Reserve (Fed), voiced concerns regarding the degree of tightness in monetary policy. In an interview with CNBC on Friday, Kashkari acknowledged that although the bar for another rate hike is set high, it cannot be completely dismissed.
Furthermore, investors are poised to closely monitor key US economic indicators that could significantly influence the market this week. Notable highlights include the release of the Producer Price Index (PPI) on Tuesday, followed by reports on the Consumer Price Index (CPI) and Retail Sales on Wednesday.
-
10.05.2024 21:53NZD/USD Price Analysis: Momentum slackens as buyers get rejected at the 200-day SMA
- The daily chart reveals a subtle change in buyers' momentum, noted by decreasing MACD green bars and a neutral RSI.
- Hourly indicators picture a balanced scenario for the session.
At the end of the week, the NZD/USD has lost 0.21% as buyers seem to have run out of steam. The sluggish trend momentum might suggest an emerging bearish grip, although the short-term positive outlook remains largely unbroken.
Despite the Relative Strength Index (RSI) sitting in the neutral zone and displaying a positive outlook, the overall trend appears to be flattening. The Moving Average Convergence Divergence (MACD) also echoes the slowing momentum, printing decreasing green bars.
NZD/USD daily chart

The hourly view shows a neutral bias with a mild lack of traction for either party reflected by the flat RSI and MACD.
NZD/USD hourly chart
A broader inspection highlights the NZD/USD residing beneath the crucial 100 and 200-day Simple Moving Averages (SMAs), lending credence to a bearish outlook. The alleged sellers' strength is verified at the 200-day SMA barrier, further solidifying the short-term bearish slant as it rejected the buyers in Friday’s session. However, if the bulls manage to hold the key short-term 20-day SMA, the downside in the next sessions will be limited.
-
10.05.2024 02:53NZD/USD moves below 0.6000 after the release of Business NZ PMI
- NZD/USD retreated after the data showed the manufacturing sector had been in contraction for 14 consecutive months.
- The Business NZ Performance of Manufacturing Index improved to 48.9 from March's 46.8, yet remained below February's level of 49.1.
- The lower US Treasury yields may put pressure on the US Dollar.
NZD/USD has halted its two days of gains, trading around 0.6020 during the Asian session on Friday. The New Zealand Dollar (NZD) received pressure after the release of the Business NZ Performance of Manufacturing Index (PMI), gauging business activity in New Zealand’s manufacturing sector.
However, the data indicated an improvement in April, with the seasonally-adjusted figure reaching 48.9 compared to March's 46.8, although still below February's 49.1. Despite the manufacturing sector being in contraction for 14 consecutive months, there are signs of improvement.
On Saturday, Chinese Consumer Price Index (CPI) data is anticipated to show a 0.1% increase for April, which could influence New Zealand's market due to the close trading ties between the two nations.
The US Dollar Index (DXY), which gauges the performance of the US Dollar (USD) against six major currencies, attempts to rebound due to the sentiment of the Federal Reserve (Fed) maintaining higher interest rates for longer. However, the Greenback faced a challenge due to the lower US Treasury yields, which could be attributed to the weak US Initial Jobless Claims released on Thursday.
The US Bureau of Labor Statistics (BLS) released data indicating that the number of individuals filing for unemployment benefits exceeded expectations. Initial Jobless Claims for the week ending May 3 rose to 231,000, surpassing estimates of 210,000 and showing an increase from the previous week's reading of 209,000.
Ahead of the day, the preliminary Michigan Consumer Sentiment Index for May is due, with expectations for a slight decrease. This index is a survey that measures sentiment among US consumers, covering three main areas: personal finances, business conditions, and buying conditions.
-
09.05.2024 21:59NZD/USD Price Analysis: Buyers gather momentum and challenge the 200-day SMA
- The daily RSI for the NZD/USD reveals strong buying momentum, underpinned by rising MACD green bars.
- Despite slightly weakening green bars on the hourly MACD, the RSI indicates steadfast buying traction near 70.
- If buyers regain the 200-day SMA, the outlook will turn positive for the pair.
The NZD/USD pair is showcasing a strong performance, rising to 0.6032 on Thursday. Despite this, an observed stagnation in hourly advances warrants attention for any short-term shift as indicators reach overbought conditions and buyers might take profits.
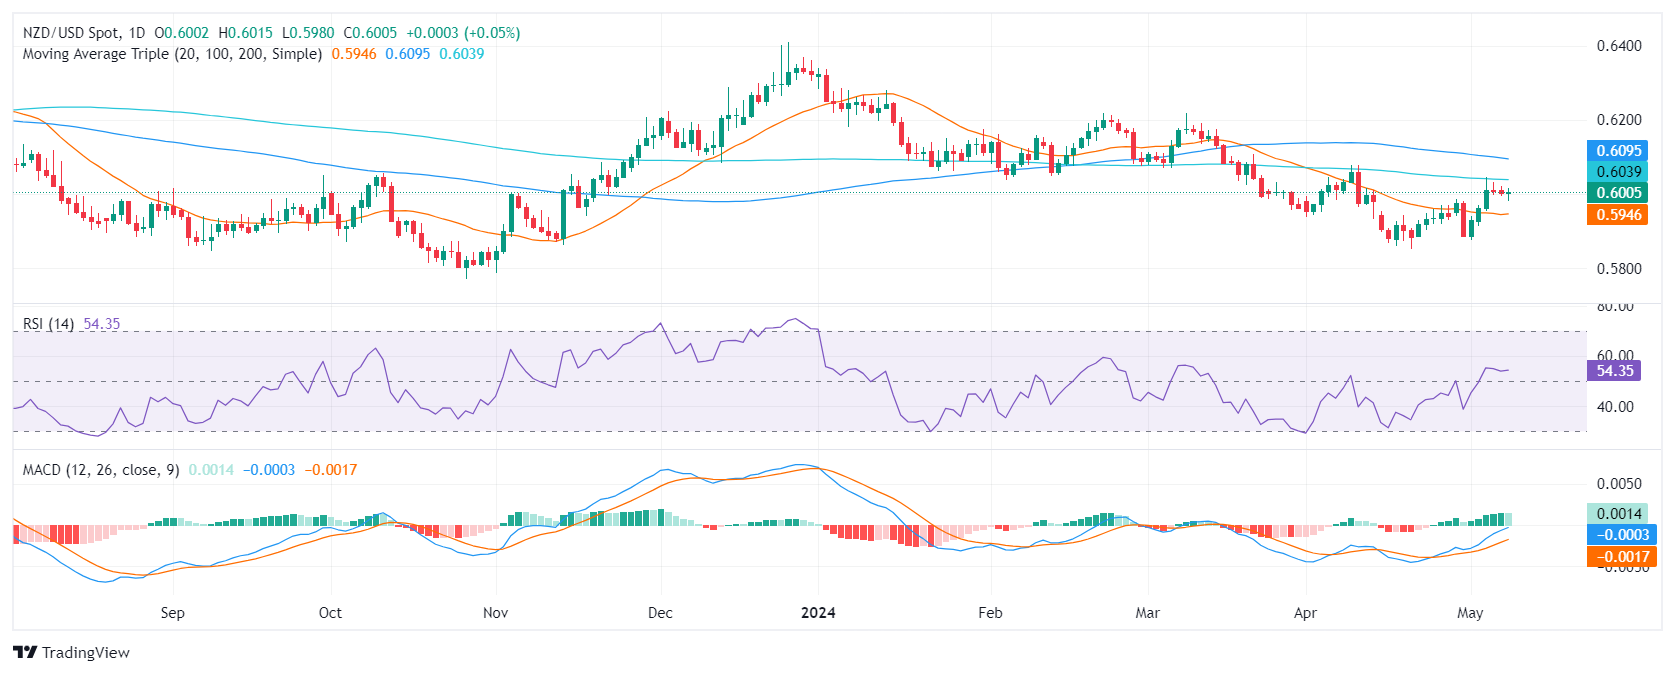
On the daily chart, the Relative Strength Index (RSI) shows positive momentum. Its latest reading is in positive territory. This, along with the rising green bars of the Moving Average Convergence Divergence (MACD), indicates a market predominately dominated by buyers.
NZD/USD daily chart
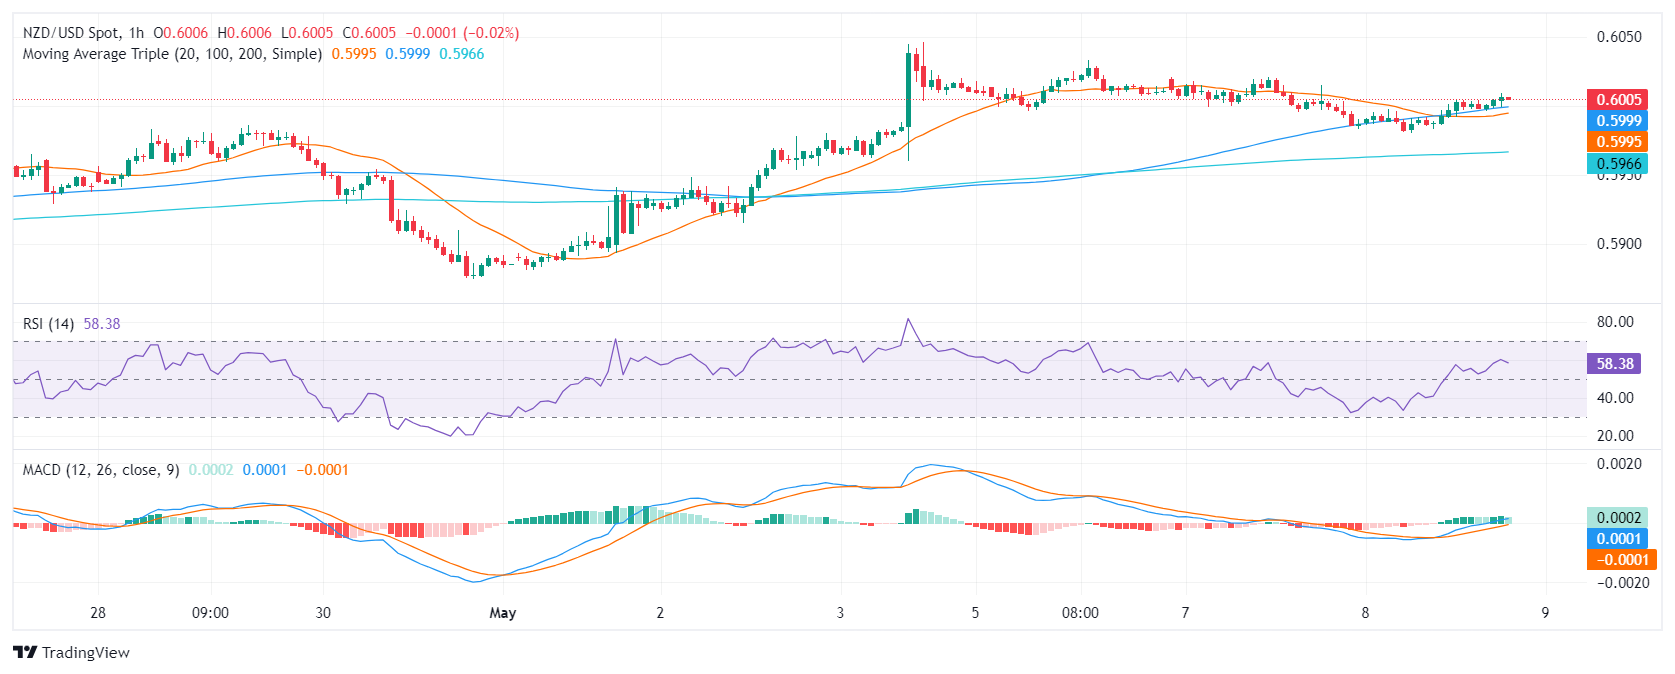
Turning attention to the hourly chart, the RSI still indicates strong buyer domination, hovering around 66. However, the MACD shows decreasing green bars, which could indicate slightly weaker bullish momentum compared to the daily chart. Traders shouldn’t take off the table a slight technical correction ahead of the Asian session.
NZD/USD hourly chart
Regarding the Simple Moving Averages (SMA) the pair holds above the 20-day SMA but remains below the 100 and 200-day. However, buyers are anticipated to challenge the 200-day SMA at the critical level of 0.6040 which if surpassed, could usher in stronger bullish prospects for the NZD/USD. On the contrary, sellers might step in again if the pair lacks the strength to reconquer the mentioned resistance.
-
09.05.2024 04:21NZD/USD inches higher to near 0.6000 after Chinese Trade data
- NZD/USD gains ground after Chinese import shows rise in April.
- RBNZ indicated a delay in any potential rate cut until 2025.
- The higher US Treasury yields are contributing support for the US Dollar.
NZD/USD has extended its gains for the second consecutive session, trading around 0.6010 during the Asian session on Thursday. The New Zealand Dollar (NZD) gains ground after the release of the Chinese data on Thursday, given the close trade relationship between New Zealand and China.
Chinese Imports (YoY) surged by 8.4% in April, surpassing forecasts of 5.4%. Additionally, Exports grew by 1.5%, higher than the anticipated 1.0% gain projected by analysts. These latest figures brought a positive surprise amidst concerns of potential additional tariffs on Chinese goods by the US. However, Trade Balance USD increased to $72.35 billion from March’s reading of $58.55 billion, slightly below the expected $76.7 billion.
In New Zealand, the Reserve Bank of New Zealand (RBNZ) indicated a delay in any potential move toward monetary easing until 2025. The RBNZ cited higher-than-anticipated inflation pressures in the first quarter as a reason for this stance. Such a decision could provide support for the New Zealand Dollar (NZD).
On the US Dollar’s (USD) front, the expectations of the Federal Reserve (Fed) to keep higher interest rates for an extended period, pushing the US Treasury yields higher. This supports the US Dollar (USD), limiting the advance of the NZD/USD pair.
Additionally, hawkish remarks from Federal Reserve officials have strengthened the Greenback. According to a Reuters report, Federal Reserve Bank of Boston President Susan Collins emphasized on Wednesday the importance of a period of moderation in the US economy to achieve the central bank's 2% inflation target.
Moreover, Minneapolis Fed President Neel Kashkari stated on Tuesday that the prevailing expectation is for rates to stay unchanged for a considerable period. Although the likelihood of rate hikes is low, it is not completely ruled out.
-
08.05.2024 22:13NZD/USD Price Analysis: Bulls stuck at 0.6000 as momentum lightens
- Indicators on the daily chart shows decelerating bullish momentum.
- The RSI on the hourly chart indicates fluctuating buying and selling pressures, despite its position in the positive zone.
- For bulls to avoid losses, they must defend the key 20-day SMA.
The NZD/USD pair maintains a strong bearish bias despite recent upward movements as buyers seem to have stalled at around 0.6000 and struggle to gain further ground while momentum wanes.
On the daily chart, technical indicators suggest a decelerating positive momentum for the pair while the prevailing downtrend persists. The Relative Strength Index (RSI) shows a positive trend after a slow ascend from the oversold region. However, the Moving Average Convergence Divergence (MACD) histogram reveals a transition towards diminishing green bars, indicating a decelerating bullish momentum.
NZD/USD daily chart
Contrastingly, the hourly RSI sits at 54. Although this is still in the positive territory, it is marginally edging lower. The past few hours have witnessed noticeable fluctuations, signaling varied buying and selling pressures. The hourly chart's MACD registers a decrease in green bars, implying receding positive momentum.
NZD/USD hourly chart
Broadening the perspective further reveals that the NZD/USD is caught in a downtrend as it lies beneath the 100 and 200-day Simple Moving Averages (SMA). That being said, its position above the 20-day average still gives some light to the bulls as it hints at a short-term positive outlook. In summary, the technical indicators of the NZD/USD pair suggest a slowing positive momentum on both the daily and hourly charts, while the prevailing downtrend continues.
-
08.05.2024 14:34NZD/USD Price Analysis: Struggles to counter 0.6000
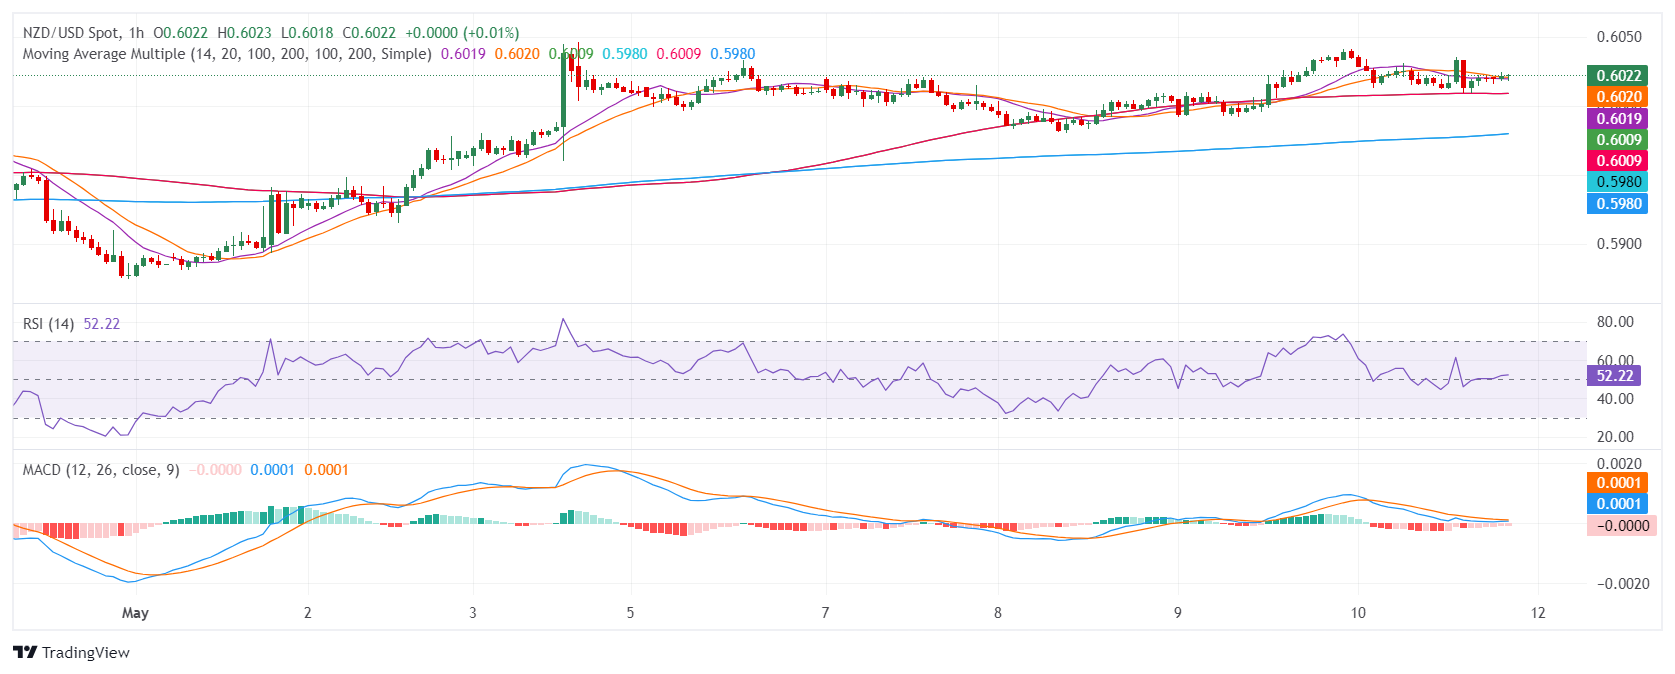
- NZD/USD faces selling pressure above 0.6000 as US Dollar recovers.
- Fed Kashkari doesn’t see interest rate cuts this year.
- Investors see the RBNZ reducing interest rates from October.
The NZD/USD pair faces pressure above the psychological figure of 0.6000 in Wednesday’s New York session. Downside pressure on the Kiwi asset is driven by risk-averse market sentiment and a recovery in the US Dollar.
The S&P 500 opens on a bearish note, suggesting a weak risk-appetite of investors. 10-year US Treasury yields recover to 4.49% as Minneapolis Federal Reserve (Fed) Bank President Neel Kashkari sounded hawkish in his commentary over the interest rate guidance on Tuesday. The US Dollar Index (DXY) holds strength near intraday’s high around 105.50
Neel Kashkari emphasized the need to keep interest rates at their current levels for the entire year. Kashkari wants to see multiple positive inflation readings to build confidence that inflation is on course to return to the desired rate of 2%.
The New Zealand Dollar has posted a modest decline as investors see the Reserve Bank of New Zealand (RBNZ) shifting to interest rate cuts from the October meeting. Earlier, investors anticipated that the RBNZ would look for rate cuts in 2025.
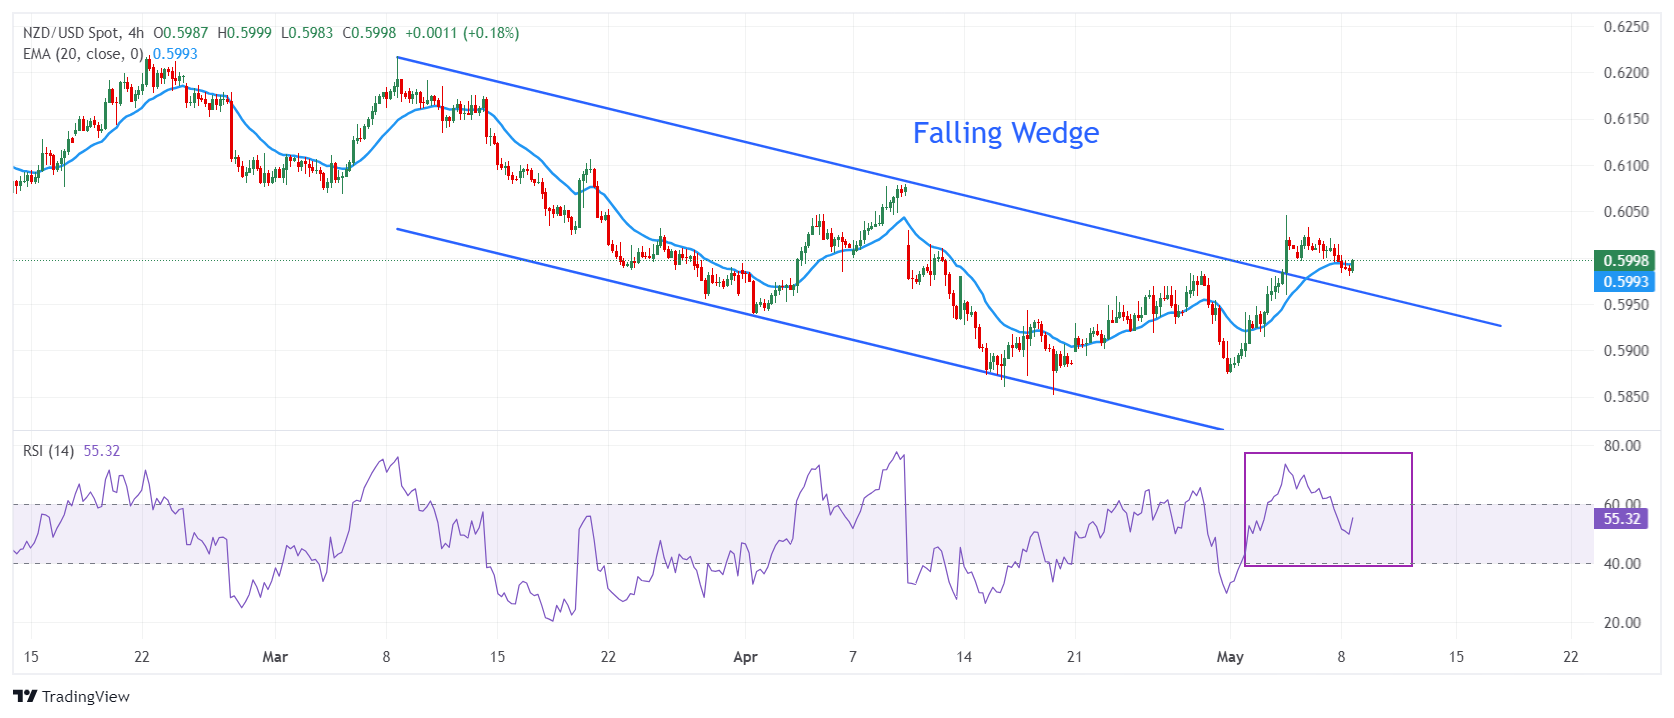
NZD/USD holds gains posted after a breakout of the Falling Wedge formation on a four-hour timeframe. A breakout of the above-mentioned chart pattern exhibits a bullish reversal. The 20-period Exponential Moving Average (EMA) near 0.6000 continues to offer support to the New Zealand Dollar bulls.
The 14-period Relative Strength Index (RSI) hovers inside the 40.00-60.00 range. A decisive break above 60.00 will trigger a bullish momentum.
An upside above April 4 high around 0.6050 will drive the asset towards the round-level resistance of 0.6100 and February 9 high of 0.6160.
On the contrary, a fresh downside would appear if the asset breaks below the April 16 low at 0.5860. This would drag the asset toward 8 September 2023 low at 0.5847, followed by the round-level support of 0.5900.
NZD/USD four-hour chart
-
08.05.2024 05:02NZD/USD moves below 0.6000 due to hawkish remarks from Fed’s Kashkari
- NZD/USD continues to lose ground due to the sentiment of the Fed prolonging higher interest rates.
- The higher US Treasury yields contribute support for the US Dollar.
- The Kiwi market seems unsettled in anticipation of critical data releases from its primary trading partner, China.
NZD/USD trades around 0.5990 during the Asian session on Wednesday, marking a second consecutive day of losses. This decline is likely influenced by the Federal Reserve's (Fed) sentiment of maintaining higher interest rates for an extended period. Furthermore, hawkish remarks from Minneapolis Fed President Neel Kashkari have strengthened the US Dollar, thereby exerting downward pressure on the NZD/USD pair.
President Kashkari's comments suggest an expectation for rates to remain unchanged for a significant duration, as reported by Reuters. Although the probability of rate hikes is low, it's not entirely ruled out.
The US Dollar Index (DXY), which gauges the performance of the US Dollar (USD) against six major currencies, edges higher to near 105.50. The higher US Treasury yields provide support for the Greenback. The 2-year and 10-year yields on US Treasury bonds stand at 4.84% and 4.47%, respectively, by the press time.
Last week, signals from the Reserve Bank of New Zealand (RBNZ) indicated an intention to postpone any move toward monetary easing until 2025, citing higher-than-anticipated inflation pressures in the first quarter. This stance could offer support for the New Zealand Dollar (NZD).
Moreover, the Kiwi market appears unsettled ahead of crucial data releases from its primary trading partner, China. This includes Thursday's Trade Balance data for April and Consumer Price Index readings on Saturday.
In New Zealand, growing concerns regarding the domestic economy have surfaced, particularly following a warning from the Organization for Economic Co-operation and Development (OECD) that Wellington is experiencing lower productivity growth due to inadequate competition, notably in the supermarket sector.
-
07.05.2024 22:04NZD/USD Price Analysis: Bearish momentum escalates, buyers struggle to hold ground
- The NZD/USD exhibits a bearish trend with growing selling pressure, accentuated by the stiff resistance at the 0.6040 level.
- Indicators are flattening on the daily chart as bulls are running out of steam.
The NZD/USD stands at 0.6005 seeing mild losses in Tuesday’s session. Market movements highlight strong bearish momentum following consecutive losing sessions. The overall trend reveals strengthening selling pressure, with the NZD/USD facing considerable resistance at the 0.6040-50 level. This suggests a potential continuation of the downward trend as sellers assert their market dominance and bulls struggle to gain further ground.
On the daily chart, the Relative Strength Index (RSI) for NZD/USD exhibits a recovery trend shifting from negative to positive territory. This trajectory indicates a gradual increase in buying interest but seems to have flattened. However, the Moving Average Convergence Divergence (MACD) histogram remains flat, reflecting stabilized momentum that does not favor either buyers or sellers dominantly.
NZD/USD daily chart
Shifting attention to the hourly chart, the NZD/USD pair presents a different narrative. The RSI flutters around in negative territory, showing sellers have a short-term advantage. Notably, the hourly MACD histogram presents flat red bars indicative of negative momentum persisting throughout the session.
NZD/USD hourly chart
In the grand scope, the mounting seller dominance is underscored by the NZD/USD's struggle to pierce the 200-day Simple Moving Average (SMA) at the 0.6040 level. This signifies a crucial resistance point for the pair. If the inability to break through persists, it could certainly reinforce the bearish trajectory in the next sessions. However, as long as the bulls hold above the 20-day SMA, the short-term outlook will remain tilted with some green.
-
07.05.2024 10:33NZD/USD juggles near 0.6000 as US Dollar steadies after investors price weak US data
- NZD/USD trades sideways around 0.6000 as the US Dollar steadies after recovery.
- The speculation for the Fed lowering key interest rates from September strengthens after weak US NFP data.
- Weak NZ labor market data boosts expectations of early rate cuts by the RBNZ.
The NZD/USD pair trades lacklustre near the psychological level of 0.6000 in Tuesday’s European session. The Kiwi asset consolidates as the US Dollar turns sideways above 105.00. The US Dollar Index (DXY) rebounds sharply after correcting to near 104.60 as investors discount the Federal Reserve’s (Fed) slightly less hawkish commentary on the interest rate outlook than feared and weak labor market data for April.
The Fed said that more interest rate hikes are unlikely, and it still sees rate cuts later this year, though its confidence has been impacted due to stubborn price pressures in the first quarter of the year. This has deepened expectations for the Fed reducing interest rates from the September meeting.
Apart from that, weak labor demand and a higher Unemployment Rate have also strengthened speculation that the Fed will pivot to interest rates in September. The CME FedWatch tool shows that traders see a 67% chance for a decline in interest rates from their current levels in September, which is significantly higher than the 46% chance recorded a week ago.
Meanwhile, the upside in the New Zealand Dollar has stalled as investors see the Reserve Bank of New Zealand (RBNZ) pivoting to interest rate cuts from the October meeting. Earlier, investors forecasted that the RBNZ would choose 2025 as their initial point to begin reducing interest rates due to stubborn Q1 inflation data. However, weak Q1 labor market data has increased expectations that the RBNZ will start lowering interest rates earlier.
-
06.05.2024 21:52NZD/USD Price Analysis: Bullish swing in motion, bearish upturn still possible
- The daily RSI and MACD show a growing bullish momentum.
- The hourly chart RSI reveals a possible slowdown in growing buying traction.
- The NZD/USD still lags behind other main SMAs, potentially pointing to a long-term bearish prospect.
The NZD/USD pair is seen exhibiting a minor decline, dropping towards the 0.6000 level in Monday's session. The market pattern appears to be dominated by a bullish swing, suggesting an increase in buyer control. Despite this, the possibility of bearish movements remains, as the key Simple Moving Averages (SMAs) and shifting investor sentiment indicate that the bulls need further validation.
On the daily chart, the Relative Strength Index (RSI) points toward the positive territory, signaling that buyers are beginning to gain control. The gradual shift to 56 from a low of 38 indicates dominant bullish momentum. The Moving Average Convergence Divergence (MACD) further confirms this bullish sentiment with its rising green bars which denote positive momentum.
NZD/USD daily chart
While assessing the hourly chart, the RSI depicts moderate fluctuations within the positive region. The most recent reading stands at 51, slightly below its daily counterpart, which could hint at a mild slowdown in buyer momentum. The view is affirmed by the MACD histogram that displays flat red bars, indicating a reduction in positive momentum.
NZD/USD hourly chart
When considering the broader outlook, the NZD/USD position concerning its Simple Moving Averages (SMA) reveals a short-term bullish outset against a potentially long-term bearish trajectory. However, a noted drawback in buyers at the 100-day SMA underscores a potential bearish trend that traders should closely monitor.


© 2000-2024. All rights reserved.
This site is managed by Teletrade D.J. LLC 2351 LLC 2022 (Euro House, Richmond Hill Road, Kingstown, VC0100, St. Vincent and the Grenadines).
The information on this website is for informational purposes only and does not constitute any investment advice.
The company does not serve or provide services to customers who are residents of the US, Canada, Iran, The Democratic People's Republic of Korea, Yemen and FATF blacklisted countries.
Making transactions on financial markets with marginal financial instruments opens up wide possibilities and allows investors who are willing to take risks to earn high profits, carrying a potentially high risk of losses at the same time. Therefore you should responsibly approach the issue of choosing the appropriate investment strategy, taking the available resources into account, before starting trading.
Use of the information: full or partial use of materials from this website must always be referenced to TeleTrade as the source of information. Use of the materials on the Internet must be accompanied by a hyperlink to teletrade.org. Automatic import of materials and information from this website is prohibited.
Please contact our PR department if you have any questions or need assistance at pr@teletrade.global.
transfers