- Analytics
- News and Tools
- Market News
CFD Markets News and Forecasts — 31-07-2018
| Raw materials | Closing price | % change |
| Oil | 68.43 | -2.42% |
| Gold | 1,223.10 | +0.15% |
| Index | Change items | Closing price | % change |
| Nikkei | +8.88 | 22553.72 | +0.04% |
| TOPIX | -14.86 | 1753.29 | -0.84% |
| CSI 300 | +2.58 | 3517.66 | +0.07% |
| KOSPI | +1.75 | 2295.26 | +0.08% |
| FTSE 100 | +47.91 | 7748.76 | +0.62% |
| DAX | +7.30 | 12805.50 | +0.06% |
| CAC 40 | +20.08 | 5511.30 | +0.37% |
| DJIA | +108.36 | 25415.19 | +0.43% |
| S&P 500 | +13.69 | 2816.29 | +0.49% |
| NASDAQ | +41.79 | 7671.79 | +0.55% |
| Pare | Closed | % change |
| EUR/USD | $1,1687 | -0,15% |
| GBP/USD | $1,3116 | -0,11% |
| USD/CHF | Chf0,99003 | +0,19% |
| USD/JPY | Y111,83 | +0,70% |
| EUR/JPY | Y130,70 | +0,56% |
| GBP/JPY | Y146,683 | +0,60% |
| AUD/USD | $0,7426 | +0,26% |
| NZD/USD | $0,6814 | -0,13% |
| USD/CAD | C$1,30114 | -0,15% |
The main US stock indexes have moderately grown, as the shares of the technology sector recovered, as well as amid news that the United States and China are trying to resume negotiations to prevent a trade war between the two largest economies of the world.
In addition, the focus was on the US. As it became known, in June, consumer spending in the US increased significantly, as households spent more on restaurants and housing, creating a solid base for the economy, which is steadily rising in the third quarter, while inflation is growing moderately. The Commerce Department reported that consumer spending, accounting for more than two-thirds of US economic activity, rose 0.4% last month. Data for May were revised to show that consumer spending rose 0.5% instead of the previously noted 0.2% increase. The growth in consumer spending last month was in line with the expectations of economists.
Meanwhile, the national housing price index from S & P / Case-Shiller, covering all nine census regions in the US, reported an annual increase of 6.4% in May, the same as in the previous month. The annual increase in the composite index for 10 megacities was 6.1% in May against 6.4% in the previous month. The index for 20 megacities published an increase of 6.5% compared to the previous year, compared with 6.7% in the previous month.
In addition, the Conference Board's consumer confidence index rose moderately in July, after a slight decline in June. The index is now 127.4 (1985 = 100), compared with 127.1 in June. The index of the current situation improved from 161.7 to 165.9, while the index of expectations fell from 104.0 to 101.7.
Most DOW components recorded a rise (19 out of 30). The leader of the growth were shares of 3M Company (MMM, + 3.43%). Outsider were the shares of Walgreens Boots Alliance, Inc. (WBA, -2.17%).
Almost all sectors of S & P completed the auction in positive territory. The industrial goods sector grew most (+ 2.0%). The decrease was shown only by the financial sector (-0.3%).
At closing:
Dow 25,415.19 +108.36 +0.43%
S&P 500 2,816.29 +13.69 +0.49%
Nasdaq 100 7,671.79 +41.78 +0.55%
The S&P CoreLogic Case-Shiller U.S. National Home Price NSA Index, covering all nine U.S. census divisions, reported a 6.4% annual gain in May, remaining the same as in the previous month. The 10- City Composite annual increase came in at 6.1%, down from 6.4% in the previous month. The 20-City Composite posted a 6.5% year-over-year gain, down from 6.7% in the previous month. Seattle,
Las Vegas, and San Francisco continued to report the highest year-over-year gains among the 20 cities. In May, Seattle led the way with a 13.6% year-over-year price increase, followed by Las Vegas with a 12.6% increase and San Francisco with a 10.9% increase. Seven of the 20 cities reported greater price increases in the year ending May 2018 versus the year ending April 2018.
The MNI Chicago Business Barometer rose to a six-month high of 65.5 in June, up 1.4 points from 64.1 in June. Businesses' operations rose at a swifter pace in July, with activity up for the fourth straight month. All but one of the Barometer components rose on the month, with only Supplier Deliveries losing ground, leaving the Barometer up 10.1% on the year.
Like the headline index, both New Orders and Production recorded six-month highs in July, traditionally a busy month for firms coinciding with the summer holiday season. Both indicators sit comfortably above the neutral-50 mark, up 8.0% and 10.6% on the year respectively, and continue to signal robust demand.
U.S. stock-index futures rose moderately on Tuesday, as tech stocks rebounded after a sell-off in the previous session, triggered by concerns about their further growth.
Global Stocks:
| Index/commodity | Last | Today's Change, points | Today's Change, % |
| Nikkei | 22,553.72 | +8.88 | +0.04% |
| Hang Seng | 28,583.01 | -150.12 | -0.52% |
| Shanghai | 2,876.40 | +7.35 | +0.26% |
| S&P/ASX | 6,280.20 | +1.80 | +0.03% |
| FTSE | 7,756.89 | +56.04 | +0.73% |
| CAC | 5,501.62 | +10.40 | +0.19% |
| DAX | 12,771.10 | -27.10 | -0.21% |
| Crude | $69.74 | | -0.56% |
| Gold | $1,229.20 | | -0.19% |
(company / ticker / price / change ($/%) / volume)
| Amazon.com Inc., NASDAQ | AMZN | 1,793.68 | 14.46(0.81%) | 35422 |
| American Express Co | AXP | 101 | 0.15(0.15%) | 222 |
| Apple Inc. | AAPL | 190.6 | 0.69(0.36%) | 118656 |
| AT&T Inc | T | 32.06 | 0.06(0.19%) | 46018 |
| Boeing Co | BA | 353.09 | 2.03(0.58%) | 3480 |
| Chevron Corp | CVX | 128 | 0.17(0.13%) | 293 |
| Exxon Mobil Corp | XOM | 81.8 | 0.06(0.07%) | 3072 |
| Facebook, Inc. | FB | 171.3 | 0.24(0.14%) | 143700 |
| General Electric Co | GE | 13.17 | 0.01(0.08%) | 57590 |
| Google Inc. | GOOG | 1,223.79 | 4.05(0.33%) | 4448 |
| Intel Corp | INTC | 47.95 | 0.26(0.55%) | 54266 |
| JPMorgan Chase and Co | JPM | 116.74 | 0.01(0.01%) | 5305 |
| Merck & Co Inc | MRK | 65 | 0.19(0.29%) | 2417 |
| Nike | NKE | 76 | 0.04(0.05%) | 1083 |
| Procter & Gamble Co | PG | 79 | -1.20(-1.50%) | 128290 |
| Twitter, Inc., NYSE | TWTR | 31.88 | 0.50(1.59%) | 356513 |
| Visa | V | 137.35 | 0.87(0.64%) | 3553 |
| Wal-Mart Stores Inc | WMT | 89 | 0.12(0.14%) | 681 |
| Yandex N.V., NASDAQ | YNDX | 36.37 | 0.67(1.88%) | 9763 |
Caterpillar (CAT) downgraded to Equal Weight from Overweight at Barclays
Prices for products sold by Canadian manufacturers, as measured by the Industrial Product Price Index (IPPI), rose 0.5% in June, primarily as a result of higher prices for primary non-ferrous metal products and motorized and recreational vehicles. Prices for raw materials purchased by Canadian manufacturers, as measured by the Raw Materials Price Index (RMPI), also increased 0.5%, mainly on the strength of higher prices for animals and animal products and metal ores, concentrates and scrap.
Personal income increased $71.7 billion (0.4 percent) in June according to estimates released today by the Bureau of Economic Analysis. Disposable personal income (DPI) increased $65.3 billion (0.4 percent) and personal consumption expenditures (PCE) increased $57.1 billion (0.4 percent)
The increase in personal income in June primarily reflected increases in wages and salaries and personal dividend income.
The $39.7 billion increase in real PCE in June primarily reflected an increase of $36.4 billion in spending for services. The largest contributor to the increase was spending for food services and accommodations.
Real gross domestic product (GDP) was up 0.5% in May, after increasing 0.1% in April. The rise was widespread as 19 of 20 industrial sectors registered increases.
The output of goods-producing industries rose 0.6%, led by gains in mining, quarrying, and oil and gas extraction. Services-producing industries rose 0.5% as all sectors increased.
The mining, quarrying, and oil and gas extraction sector was up for the fourth month in a row in May, growing by 1.8%.
The oil and gas extraction sub-sector rose 2.5% in May, a sixth increase in seven months. Non-conventional oil was up 5.3% as crude bitumen extraction in Alberta increased following maintenance and capacity-expansion-related shutdowns at some facilities in April. Conventional oil and gas extraction was unchanged as growth in crude oil extraction was offset by a decline in natural gas extraction.
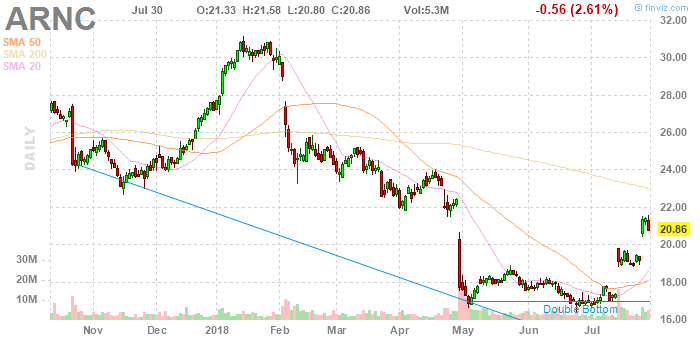
Arconic (ARNC) reported Q2 FY 2018 earnings of $0.37 per share (versus $0.32 in Q2 FY 2017), beating analysts' consensus estimate of $0.29.
The company's quarterly revenues amounted to $3.573 bln (+9.6% y/y), beating analysts' consensus estimate of $3.492 bln.
The company also reaffirmed guidance for FY 2018, projecting EPS of $1.17-1.27 versus analysts' consensus estimate of $1.23 and revenues of $13.7-14.0 bln versus analysts' consensus estimate of $13.85 bln.
ARNC rose to $21.65 (+3.79%) in pre-market trading.
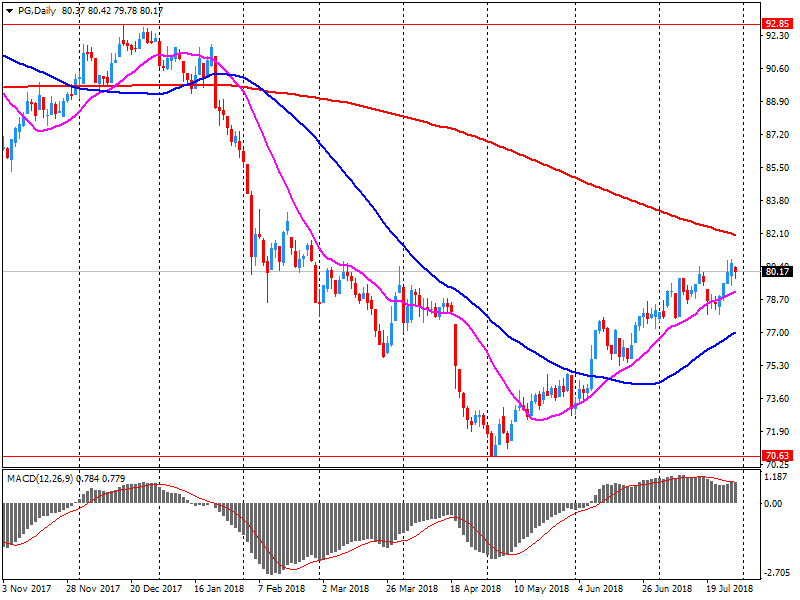
Procter & Gamble (PG) reported Q4 FY 2018 earnings of $0.94 per share (versus $0.85 in Q4 FY 2017), beating analysts' consensus estimate of $0.90.
The company's quarterly revenues amounted to $16.503 bln (+2.6% y/y), generally in-line with analysts' consensus estimate of $16.517 bln.
The company also issued guidance for FY 2019, projecting EPS of $4.35-4.56 versus analysts' consensus estimate of $4.39 and revenues of ~$66.8-67.5 bln versus analysts' consensus estimate of $67.74 bln.
PG fell to $78.30 (-2.37%) in pre-market trading.
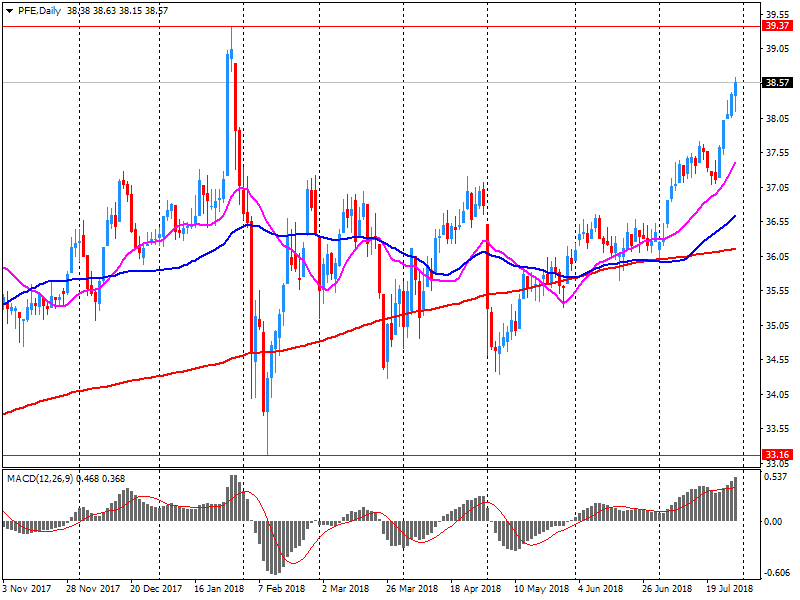
Pfizer (PFE) reported Q2 FY 2018 earnings of $0.81 per share (versus $0.67 in Q2 FY 2017), beating analysts' consensus estimate of $0.74.
The company's quarterly revenues amounted to $13.466 bln (+4.4% y/y), beating analysts' consensus estimate of $13.298 bln.
The company also issued guidance for FY 2018, projecting EPS of $2.95-3.05 (compared to its prior guidance of $2.90-3.00 and analysts' consensus estimate of $2.95) and revenues of $53-55 bln (compared to its prior guidance of $53.5-55.5 bln and analysts' consensus estimate of $54.25 bln).
PFE fell to $38.50 (-0.23%) in pre-market trading.
The sudden debt dump may have contributed to a short-term spike in Treasury rates that spooked the market. 10-year U.S Treasury yields topped 3% in April for the first time since 2014.
In July 2018, according to preliminary estimates, the Italian consumer price index increased by 0.3% on monthly basis and by 1.5% compared with July 2017 (+1.3% in June 2018).
The acceleration of the growth on annual basis of all items index was mainly due to prices of regulated energy products (from -1.2% to +5.3%). The slowdown of prices of Services related to transport (from +2.9% of the previous month to +1.7%) mitigated this acceleration.
Inflation excluding energy and unprocessed food (core inflation) was +0.7% and inflation excluding energy was +0.9% (both in deceleration respectively from +0.8% and +1.0%).
Euro area annual inflation is expected to be 2.1% in July 2018, up from 2.0% in June, according to a flash estimate from Eurostat. Looking at the main components of euro area inflation, energy is expected to have the highest annual rate in July (9.4%, compared with 8.0% in June), followed by food, alcohol & tobacco (2.5%, compared with 2.7% in June), services (1.4%, compared with 1.3% in June) and non-energy industrial goods (0.5%, compared with 0.4% in June).
Seasonally adjusted GDP rose by 0.3% in the euro area (EA19) and by 0.4% in the EU28 during the second quarter of 2018, compared with the previous quarter, according to a preliminary flash estimate published by Eurostat.
In the first quarter of 2018, GDP had grown by 0.4% in both the euro area and the EU28. Compared with the same quarter of the previous year, seasonally adjusted GDP rose by 2.1% in the euro area and by 2.2% in the EU28 in the second quarter of 2018, after +2.5% and +2.4% respectively in the previous quarter.
German jobless claims continued to fall in July, albeit by less than expected, and the Federal Employment Agency said Tuesday that the strong upswing in the jobs market is beginning to show signs of weakening.
Jobless claims dropped by 6,000 in July compared with June, the Federal Employment Agency said, referring to data adjusted for seasonal swings. Economists polled by The Wall Street Journal had forecast a decline of 10,000.
Detlef Scheele, the head of the employment body, said the labor market continues to develop "very favorably, albeit not as dynamic" as before. - via WSJ
The jobless rate in Japan came in at a seasonally adjusted 2.4 percent in June, according to rttnews.
That exceeded expectations for 2.3 percent and was up from 2.2 percent in May.
The job-to-applicant ratio was 1.62, topping forecasts for 1.60 - which would have been unchanged from the previous month.
The number of employed persons in June was 66.87 million, an increase of 1.04 million or 1.6 percent on year. The number of unemployed persons in June was 1.68 million, a decrease of 240,000 or 12.5 percent on year.
The Spanish GDP registers a growth of 0.6% in the second quarter of 2018 compared to the previous quarter in terms of volume. This rate is one tenth lower than that registered in the first quarter of the year. The growth compared to the same quarter of the previous year stood at 2.7%, compared to 3.0% in the previous quarter. The contribution of national demand to the annual growth of GDP is 2.9 points, one tenth higher than the first quarter. For its part, the external market demand presents a contribution of -0.2 points, four tenths less than the last quarter
The activity of China's manufacturing sector fell more than expected, according to China's statistical office. The index of business activity (PMI) fell to 51.2 from 51.5 in June. Economists had expected a decline to 51.3. It is worth noting that despite the decline, the indicator remains above the value of 50, which divides the expansion from contraction.
The report notes that the decline is largely due to the growing trade tension between the US and China and the cyclical processes caused by the beginning of the traditional season, which is characterized by a decrease in the activity of Chinese enterprises. The index of activity of large enterprises fell to 52.4 from 52.9 in June. The activity of small enterprises decreased by 0.5 points, to the level of 49.3.
-
Headline business confidence and firms' views of their own activity continued to fall in July, reaching their lowest levels since May 2008 and May 2009 respectively.
-
Activity sub-indicators were weak across the board; retail is the least confident sector.
The ANZ Business Outlook Survey for July paints an unhappy picture. Headline business confidence dropped to a net 45% of respondents reporting they expect general business conditions to deteriorate in the year ahead, down 5 points.
In the course of today's speech on the level of interest rates and monetary policy, the Bank of Japan gave its forecasts regarding the country's GDP growth for the next few years:
-
Real GDP in 2018 is likely to grow by 1.5%, whereas earlier it was forecasted an increase of 1.6%
-
In 2019 and 2020, it is likely to grow by 0.8%, previously it was also forecasted an increase of 0.8%
The Central Bank characterized the situation with inflation as follows:
-
Annual inflation will gradually reach 2%, but this will take more time than previously thought.
-
The core inflation of consumer prices in this fiscal year is likely to be 1.1% vs. the previous forecast of 1.3%
-
In 2019, it is likely to be 1.5% against the previous forecast of 1.8%
-
In 2020, it is likely to be 1.6% against the previous forecast of 1.8%
Over a year, the Consumer Price Index (CPI) should accelerate sharply in July 2018, to +2.3% after +2.0%, according to the provisional estimate made at the end of the month. This strong rise in the year-on-year inflation should result essentially from a year-on-year acceleration in energy prices, and to a lesser extent, in service prices. Food and tobacco prices should increase more too. Finally, a lesser drop in manufactured product prices should contribute too to the rise in inflation.
Over one month, consumer prices should edge down to 0.1% in July after a stability in June. This slight drop come from a seasonal fall in slowdown in manufactured product prices due to summer sales, parly offset by a rebound in services prices, essentially in airfares with the beginning of school holidays
EUR/USD
Resistance levels (open interest**, contracts)
$1.1788 (4487)
$1.1769 (2534)
$1.1754 (792)
Price at time of writing this review: $1.1708
Support levels (open interest**, contracts):
$1.1682 (3317)
$1.1642 (3542)
$1.1596 (3961)
Comments:
- Overall open interest on the CALL options and PUT options with the expiration date August, 13 is 90208 contracts (according to data from July, 30) with the maximum number of contracts with strike price $1,1850 (5321);
GBP/USD
Resistance levels (open interest**, contracts)
$1.3267 (1094)
$1.3206 (661)
$1.3175 (304)
Price at time of writing this review: $1.3129
Support levels (open interest**, contracts):
$1.3074 (2515)
$1.3035 (2266)
$1.2992 (1564)
Comments:
- Overall open interest on the CALL options with the expiration date August, 13 is 24442 contracts, with the maximum number of contracts with strike price $1,3600 (3206);
- Overall open interest on the PUT options with the expiration date August, 13 is 28949 contracts, with the maximum number of contracts with strike price $1,3100 (2512);
- The ratio of PUT/CALL was 1.18 versus 1.17 from the previous trading day according to data from July, 30.
* - The Chicago Mercantile Exchange bulletin (CME) is used for the calculation.
** - Open interest takes into account the total number of option contracts that are open at the moment.
According to provisional data turnover in retail trade in June 2018 was in real terms 3.0% and in nominal terms 5.3% larger than in June 2017. The number of days open for sale was 26 in June 2018 and 25 in June 2017.
Compared with the previous year, turnover in retail trade was in the first six months of 2018 in real terms 1.4% and in nominal terms 3.0% larger than in the corresponding period of the previous year.


© 2000-2024. All rights reserved.
This site is managed by Teletrade D.J. LLC 2351 LLC 2022 (Euro House, Richmond Hill Road, Kingstown, VC0100, St. Vincent and the Grenadines).
The information on this website is for informational purposes only and does not constitute any investment advice.
The company does not serve or provide services to customers who are residents of the US, Canada, Iran, The Democratic People's Republic of Korea, Yemen and FATF blacklisted countries.
Making transactions on financial markets with marginal financial instruments opens up wide possibilities and allows investors who are willing to take risks to earn high profits, carrying a potentially high risk of losses at the same time. Therefore you should responsibly approach the issue of choosing the appropriate investment strategy, taking the available resources into account, before starting trading.
Use of the information: full or partial use of materials from this website must always be referenced to TeleTrade as the source of information. Use of the materials on the Internet must be accompanied by a hyperlink to teletrade.org. Automatic import of materials and information from this website is prohibited.
Please contact our PR department if you have any questions or need assistance at pr@teletrade.global.
transfers