- Analytics
- News and Tools
- Market News
CFD Markets News and Forecasts — 30-04-2018
| raw materials | closing price | % change |
| Oil | 68.57 | +0.69% |
| Gold | 1,316.10 | -0.55% |
| index | closing price | change items | % change |
| ASX 200 | +29.10 | 5982.70 | +0.49% |
| KOSPI | +22.98 | 2515.38 | +0.92% |
| Hang Seng | +527.78 | 30808.45 | +1.74% |
| NZ50 | +73.21 | 8443.58 | +0.88% |
| Euro Stoxx 50 | +17.74 | 3536.52 | +0.50% |
| FTSE 100 | +7.09 | 7509.30 | +0.09% |
| DAX | +31.24 | 12612.11 | +0.25% |
| CAC 40 | +37.31 | 5520.50 | +0.68% |
| DJIA | -148.04 | 24163.15 | -0.61% |
| S&P 500 | -21.86 | 2648.05 | -0.82% |
| NASDAQ | -53.53 | 7066.27 | -0.75% |
| S&P/TSX | -61.05 | 15607.88 | -0.39% |
| Pare | Closed | % change |
| EUR/USD | $1,2077 | -0,43% |
| GBP/USD | $1,3767 | -0,08% |
| USD/CHF | Chf0,99045 | +0,26% |
| USD/JPY | Y109,26 | +0,17% |
| EUR/JPY | Y131,99 | -0,23% |
| GBP/JPY | Y150,434 | +0,10% |
| AUD/USD | $0,7530 | -0,66% |
| NZD/USD | $0,7034 | -0,70% |
| USD/CAD | C$1,28373 | +0,02% |
| Time | Region | Event | Period | Previous | Forecast |
| 01:45 | New Zealand | Building Permits, m/m | March | 5.7% | |
| 02:30 | Australia | AIG Manufacturing Index | April | 63.1 | |
| 03:30 | Japan | Manufacturing PMI | April | 53.1 | 53.3 |
| 07:30 | Australia | Announcement of the RBA decision on the discount rate | | 1.5% | 1.5% |
| 07:30 | Australia | RBA Rate Statement | | | |
| 11:30 | United Kingdom | Net Lending to Individuals, bln | March | 5.4 | 4.9 |
| 11:30 | United Kingdom | Mortgage Approvals | March | 63.91 | 63 |
| 11:30 | United Kingdom | Consumer credit, mln | March | 1.647 | 1.5 |
| 11:30 | United Kingdom | Purchasing Manager Index Manufacturing | April | 55.1 | 54.8 |
| 12:20 | Australia | RBA's Governor Philip Lowe Speaks | | | |
| 15:30 | Canada | GDP (m/m) | February | -0.1% | 0.3% |
| 16:45 | USA | Manufacturing PMI | April | 55.6 | |
| 17:00 | USA | Construction Spending, m/m | March | 0.1% | 0.5% |
| 17:00 | USA | ISM Manufacturing | April | 59.3 | 58.6 |
| 21:30 | Canada | BOC Gov Stephen Poloz Speaks | | | |
| 22:00 | USA | Total Vehicle Sales, mln | April | 17.48 | 17.3 |
Major US stock indexes finished trading in negative territory amid falling industrial and health sector shares.
The focus of investors' attention was also data on the United States. As it became known, the index of purchasing managers in Chicago increased by 0.2 points to 57.6 in April, compared to 57.4 in March, cutting off the three-month negative trend. In April, business activity continued to grow at a solid pace, while the growth of business operations accelerated for the first time this year. 3 of the 5 components of the index fell, only the sub-indices of products and supplies of suppliers increased.
In addition, the index of unfinished transactions for the sale of housing from the National Association of Realtors (NAR) rose in March by 0.4% to 107.6. The index rose for the second month in a row, but remained the third consecutive month below the level of the previous year. Economists forecast an increase of 0.6%. Expected sales in the Northeast fell by 5.6% in March, while in the West it decreased by 1.1%. In the Midwest, expected sales increased by 2.4%, and in the South - by 2.5%.
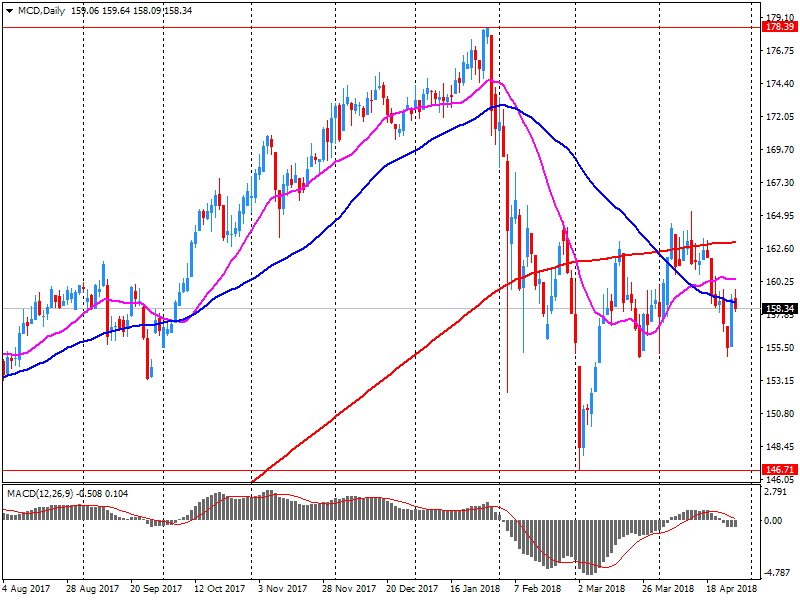
Most of the components of DOW finished trading in the red (22 of 30). Outsider were the shares of Verizon Communications Inc. (VZ, -3.67%). The leader of growth was the shares of McDonald's Corporation (MCD, + 5.00%).
Most S & P sectors recorded a decline. The health sector showed the greatest decline (-0.9%). The sector of conglomerates grew the most (+ 0.8%),
At closing:
Index
Dow 24,163.15 -148.04 -0.61%
S&P 500 2,648.05 -21.86 -0.82%
Nasdaq 100 7,066.27 -53.53 -0.75%
U.S. stock-index futures rose moderately on Monday, supported by strong corporate earnings and signs of M&A activity.
Global Stocks:
| Index/commodity | Last | Today's Change, points | Today's Change, % |
| Nikkei | - | - | - |
| Hang Seng | 30,808.45 | +527.78 | +1.74% |
| Shanghai | - | - | - |
| S&P/ASX | 5,982.70 | +29.10 | +0.49% |
| FTSE | 7,530.97 | +28.76 | +0.38% |
| CAC | 5,498.72 | +15.53 | +0.28% |
| DAX | 12,584.63 | +3.76 | +0.03% |
| Crude | $67.50 | | -0.88% |
| Gold | $1,314.50 | | -0.67% |
(company / ticker / price / change ($/%) / volume)
| ALTRIA GROUP INC. | MO | 56.6 | 0.47(0.84%) | 9029 |
| Amazon.com Inc., NASDAQ | AMZN | 1,584.38 | 11.76(0.75%) | 87070 |
| Apple Inc. | AAPL | 162.64 | 0.32(0.20%) | 168206 |
| AT&T Inc | T | 33.35 | 0.31(0.94%) | 166776 |
| Barrick Gold Corporation, NYSE | ABX | 13.58 | -0.19(-1.38%) | 5174 |
| Boeing Co | BA | 342 | 1.12(0.33%) | 10649 |
| Caterpillar Inc | CAT | 145.5 | 0.78(0.54%) | 1422 |
| Chevron Corp | CVX | 126.5 | -0.12(-0.09%) | 7379 |
| Cisco Systems Inc | CSCO | 45.05 | 0.34(0.76%) | 21100 |
| Citigroup Inc., NYSE | C | 69.36 | 0.37(0.54%) | 2784 |
| Exxon Mobil Corp | XOM | 77.9 | 0.11(0.14%) | 7160 |
| Facebook, Inc. | FB | 174.48 | 0.89(0.51%) | 41752 |
| Ford Motor Co. | F | 11.53 | 0.04(0.35%) | 8522 |
| Freeport-McMoRan Copper & Gold Inc., NYSE | FCX | 15.44 | 0.12(0.78%) | 9635 |
| General Electric Co | GE | 14.4 | 0.02(0.14%) | 39483 |
| General Motors Company, NYSE | GM | 37.88 | 0.23(0.61%) | 1141 |
| Goldman Sachs | GS | 240.5 | 0.70(0.29%) | 7084 |
| Google Inc. | GOOG | 1,034.00 | 3.95(0.38%) | 10024 |
| Home Depot Inc | HD | 187.1 | 0.64(0.34%) | 620 |
| Intel Corp | INTC | 52.93 | 0.20(0.38%) | 107339 |
| International Business Machines Co... | IBM | 146.99 | 0.51(0.35%) | 2131 |
| Johnson & Johnson | JNJ | 128.31 | 0.04(0.03%) | 763 |
| JPMorgan Chase and Co | JPM | 109.96 | 0.56(0.51%) | 946 |
| McDonald's Corp | MCD | 165.08 | 6.78(4.28%) | 370549 |
| Merck & Co Inc | MRK | 59.6 | 0.13(0.22%) | 3497 |
| Microsoft Corp | MSFT | 96.5 | 0.68(0.71%) | 24008 |
| Nike | NKE | 69.5 | -0.06(-0.09%) | 4265 |
| Procter & Gamble Co | PG | 73 | 0.19(0.26%) | 3389 |
| Starbucks Corporation, NASDAQ | SBUX | 58.5 | 0.14(0.24%) | 1292 |
| Tesla Motors, Inc., NASDAQ | TSLA | 292.25 | -1.83(-0.62%) | 14457 |
| The Coca-Cola Co | KO | 43.44 | 0.13(0.30%) | 2353 |
| Twitter, Inc., NYSE | TWTR | 28.75 | -0.25(-0.86%) | 190182 |
| UnitedHealth Group Inc | UNH | 241.5 | 1.32(0.55%) | 2134 |
| Verizon Communications Inc | VZ | 51.5 | -0.07(-0.14%) | 10958 |
| Visa | V | 126.26 | 0.25(0.20%) | 1410 |
| Wal-Mart Stores Inc | WMT | 87.69 | 0.40(0.46%) | 2294 |
| Walt Disney Co | DIS | 100.83 | 1.60(1.61%) | 32917 |
| Yandex N.V., NASDAQ | YNDX | 32.44 | -0.07(-0.22%) | 2230 |
Altria (MO) upgraded to Outperform from Sector Perform at RBC Capital Mkts
Prices of products sold by Canadian manufacturers, as measured by the Industrial Product Price Index (IPPI), increased 0.8% in March, mainly due to higher prices for energy and petroleum products and pulp and paper products. Prices for raw materials purchased by Canadian manufacturers, as measured by the Raw Materials Price Index (RMPI), rose 2.1%, primarily due to higher prices for crude energy products.
Personal income increased $47.8 billion (0.3 percent) in March according to estimates released today by the Bureau of Economic Analysis. Disposable personal income (DPI) increased $39.8 billion (0.3 percent) and personal consumption expenditures (PCE) increased $61.7 billion (0.4 percent).
Real DPI increased 0.2 percent in March and Real PCE increased 0.4 percent. The PCE price index increased less than 0.1 percent. Excluding food and energy, the PCE price index increased 0.2 percent.
The $50.0 billion increase in real PCE in March reflected an increase of $24.2 billion in spending for goods and a $26.8 billion increase in spending for services. Within goods, purchases of recreational goods and vehicles was the leading contributor to the increase. Within services, the largest contributor to the increase was spending for household electricity and gas.
Consumer price index, April 2018:
• +1.6% on the same month a year earlier (provisional)
• 0.0% on the previous month (provisional)
Harmonised index of consumer prices, April 2018:
• +1.4% on the same month a year earlier (provisional)
• -0.1% on the previous month (provisional)
The inflation rate in Germany as measured by the consumer price index is expected to be 1.6% in April 2018. Based on the results available so far, the Federal Statistical Office (Destatis) also reports that the consumer prices are expected to remain unchanged on March 2018.
-
Hopes US president Trump comes to his senses and stays in multinational nuclear deal
McDonald's (MCD) reported Q1 FY 2018 earnings of $1.79 per share (versus $1.47 in Q1 FY 2017), beating analysts' consensus estimate of $1.67.
The company's quarterly revenues amounted to $5.139 bln (-9.5% y/y), beating analysts' consensus estimate of $4.966 bln.
MCD rose to $164.79 (+4.10%) in pre-market trading.
April 30
Before the Open:
McDonald's (MCD). Consensus EPS $1.67, Consensus Revenues $4966.49 mln.
May 1
Before the Open:
Merck (MRK). Consensus EPS $1.00, Consensus Revenues $10088.40 mln.
Pfizer (PFE). Consensus EPS $0.74, Consensus Revenues $13138.05 mln.
After the Close:
Apple (AAPL). Consensus EPS $2.68, Consensus Revenues $61016.17 mln.
May 2
Before the Open:
MasterCard (MA). Consensus EPS $1.24, Consensus Revenues $3255.37 mln.
After the Close:
American Intl (AIG). Consensus EPS $1.27, Consensus Revenues $11588.37 mln.
Tesla (TSLA). Consensus EPS -$3.52, Consensus Revenues $3300.13 mln.
May 3
Before the Open:
DowDuPont (DWDP). Consensus EPS $1.10, Consensus Revenues $21297.45 mln.
The annual growth rate of the broad monetary aggregate M3 decreased to 3.7% in March 2018, from 4.2% in February.
The annual growth rate of the narrower aggregate M1, which includes currency in circulation and overnight deposits, decreased to 7.5% in March, from 8.4% in February.
The annual growth rate of adjusted loans to households increased to 3.0% in March, from 2.9% in February. The annual growth rate of adjusted loans to non-financial corporations increased to 3.3% in March, from 3.2% in February
The KOF Economic Barometer for April points to an almost stable economic development. It has risen minimally, by 0.2 points, to 105.3 points. Although the Barometer currently does not reach the positive values seen at the turn of the year 2017/2018, the current value is clearly above long-term average. The Swiss economic outlook remains favourable.
China's manufacturing sector grew at a slower pace in April, says rttnews.
The official manufacturing Purchasing Managers' Index fell slightly to 51.4 in April from 51.5 in March. Nonetheless, the score remained above 50, indicating expansion in the sector.
NBS senior statistician Zhao Qinghe, said the manufacturing sector continued to maintain its steady growth trend.
Meanwhile, the non-manufacturing PMI that covers services and construction, improved to 54.8 from 54.6 a month ago.
-
Says uncertainty persists on the U.K.'s future relationship with its most important trading partner, the EU
-
Negative outlook reflects risk of sustained economic weakness if merchandise & services exports from U.K. lose access to key European markets
New house sales in Australia's five largest states declined by 2.0 per cent during March, meaning that sales have fallen in each of 2018's first three months. Three consecutive months of decline in sales volumes were last recorded between July and September of last year. Overall, new house sales fell back by 2.2 per cent during the March 2018 quarter compared with the last three months of 2017. Over the 12 months to March 2018, new house sales were 4.1 per cent lower than in the previous 12 month period.
U.K. stocks moved higher Friday, extending a run of weekly wins, as the pound slid to a seven-week low after disappointing data on British economic growth. In the first quarter, the U.K. logged its slowest rate of economic growth since 2012, official figures showed, widely undershooting analysts' forecasts and significantly lowering expectations of a Bank of England rate rise next month.
U.S. stock benchmarks closed out Friday little changed, and booked modest losses, as investors expressed muted enthusiasm following strong corporate results, even from some of the market's biggest and most influential companies.
Asia-Pacific stocks started the week higher, led by financial stocks in Hong Kong and Singapore as markets in China and Japan are closed for holidays.
According to provisional data turnover in retail trade in March 2018 was in real terms 1.3% and in nominal terms 2.6% larger than in March 2017. The number of days open for sale was 26 in March2018 and 27 in March 2017.
Compared with the previous year, turnover in retail trade was in the first three months of 2018 in real terms 1.6% and in nominal terms 2.9% larger than in the corresponding period of the previous year.
EUR/USD
Resistance levels (open interest**, contracts)
$1.2305 (1881)
$1.2263 (2308)
$1.2228 (866)
Price at time of writing this review: $1.2128
Support levels (open interest**, contracts):
$1.2040 (2321)
$1.1995 (3174)
$1.1947 (1133)
Comments:
- Overall open interest on the CALL options and PUT options with the expiration date May, 4 is 86636 contracts (according to data from April, 27) with the maximum number of contracts with strike price $1,2650 (4261);
GBP/USD
Resistance levels (open interest**, contracts)
$1.4055 (891)
$1.4008 (706)
$1.3964 (1061)
Price at time of writing this review: $1.3783
Support levels (open interest**, contracts):
$1.3683 (1988)
$1.3640 (877)
$1.3595 (636)
Comments:
- Overall open interest on the CALL options with the expiration date May, 4 is 22769 contracts, with the maximum number of contracts with strike price $1,4400 (3256);
- Overall open interest on the PUT options with the expiration date May, 4 is 26101 contracts, with the maximum number of contracts with strike price $1,3800 (2401);
- The ratio of PUT/CALL was 1.15 versus 1.09 from the previous trading day according to data from April, 27

* - The Chicago Mercantile Exchange bulletin (CME) is used for the calculation.
** - Open interest takes into account the total number of option contracts that are open at the moment.


© 2000-2024. All rights reserved.
This site is managed by Teletrade D.J. LLC 2351 LLC 2022 (Euro House, Richmond Hill Road, Kingstown, VC0100, St. Vincent and the Grenadines).
The information on this website is for informational purposes only and does not constitute any investment advice.
The company does not serve or provide services to customers who are residents of the US, Canada, Iran, The Democratic People's Republic of Korea, Yemen and FATF blacklisted countries.
Making transactions on financial markets with marginal financial instruments opens up wide possibilities and allows investors who are willing to take risks to earn high profits, carrying a potentially high risk of losses at the same time. Therefore you should responsibly approach the issue of choosing the appropriate investment strategy, taking the available resources into account, before starting trading.
Use of the information: full or partial use of materials from this website must always be referenced to TeleTrade as the source of information. Use of the materials on the Internet must be accompanied by a hyperlink to teletrade.org. Automatic import of materials and information from this website is prohibited.
Please contact our PR department if you have any questions or need assistance at pr@teletrade.global.
transfers