- Analytics
- News and Tools
- Market News
CFD Markets News and Forecasts — 28-06-2017
(raw materials / closing price /% change)
Oil 44.88 +0.31%
Gold 1,249.40 +0.02%
(index / closing price / change items /% change)
Nikkei -94.68 20130.41 -0.47%
TOPIX -4.65 1614.37 -0.29%
Hang Seng -156.49 25683.50 -0.61%
CSI 300 -28.55 3646.17 -0.78%
Euro Stoxx 50 -2.62 3535.70 -0.07%
FTSE 100 -46.56 7387.80 -0.63%
DAX -23.75 12647.27 -0.19%
CAC 40 -5.68 5252.90 -0.11%
DJIA +143.95 21454.61 +0.68%
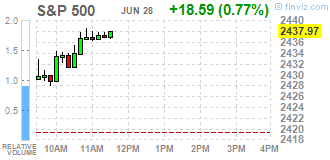
S&P 500 +21.31 2440.69 +0.88%
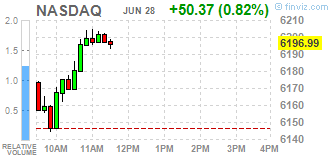
NASDAQ +87.79 6234.41 +1.43%
S&P/TSX +74.36 15355.58 +0.49%
(pare/closed(GMT +2)/change, %)
EUR/USD $1,1375 +0,35%
GBP/USD $1,2927 +0,89%
USD/CHF Chf0,9595 -0,05%
USD/JPY Y112,28 +0,01%
EUR/JPY Y127,72 +0,36%
GBP/JPY Y145,13 +0,90%
AUD/USD $0,7638 +0,77%
NZD/USD $0,7307 +0,62%
USD/CAD C$1,3033 -1,24%
01:00 Australia HIA New Home Sales, m/m May 0.8%
01:00 New Zealand ANZ Business Confidence June 14.9
06:00 Germany Gfk Consumer Confidence Survey July 10.4 10.4
08:30 United Kingdom Consumer credit, mln May 1525 1400
08:30 United Kingdom Net Lending to Individuals, bln May 4.3 4
08:30 United Kingdom Mortgage Approvals May 64.64 64.0
09:00 Eurozone Economic sentiment index June 109.2 109.5
09:00 Eurozone Consumer Confidence (Finally) June -3.3 -1.3
09:00 Eurozone Business climate indicator June 0.9 0.94
09:00 Eurozone Industrial confidence June 2.8 2.9
12:00 Germany CPI, m/m (Preliminary) June -0.2% 0%
12:00 Germany CPI, y/y (Preliminary) June 1.5% 1.4%
12:30 U.S. Continuing Jobless Claims 1944 1940
12:30 U.S. PCE price index ex food, energy, q/q (Finally) Quarter I 1.3% 2.1%
12:30 U.S. Initial Jobless Claims 241 240
12:30 U.S. GDP, q/q (Finally) Quarter I 2.1% 1.2%
17:00 U.S. FOMC Member James Bullard Speaks
22:45 New Zealand Building Permits, m/m May -7.6%
23:05 United Kingdom Gfk Consumer Confidence June -5 -7
23:30 Japan Household spending Y/Y May -1.4% -0.6%
23:30 Japan Tokyo CPI ex Fresh Food, y/y June 0.1% 0.2%
23:30 Japan Tokyo Consumer Price Index, y/y June 0.2% 0.5%
23:30 Japan Unemployment Rate May 2.8% 2.8%
23:30 Japan National Consumer Price Index, y/y May 0.4% 0.5%
23:30 Japan National CPI Ex-Fresh Food, y/y May 0.3% 0.4%
23:50 Japan Industrial Production (MoM) (Preliminary) May 4.0% -3.2%
23:50 Japan Industrial Production (YoY) (Preliminary) May 5.7%
The main US stock indexes rose significantly, primarily thanks to the rally in the banking segment, triggered by a report that the market misinterpreted yesterday's ECB Draghi comments as "hawks," while shares of technology companies recovered after a two-day sell-off. The indices were also supported by the positive dynamics in the raw materials market.
In addition, investors assessed the data on the US housing market. The index of unfinished transactions for the sale of housing from the National Association of Realtors decreased by 0.8% in May, noting the third month of decline in a row. The index was 108.5 in May, and its April level was revised downward. Economists predicted an increase of 0.8%. The National Association of Realtors continues to blame the supply restriction in the uneven development of the housing market. "The buyer's interest is significant, but there is not enough resources to meet demand," said the chief economist of the group, Lawrence Yun, "prospective buyers are being removed because they are limited in choice and housing prices that are rising too quickly."
Most components of the DOW index recorded a rise (24 out of 30). Caterpillar Inc. was the growth leader. (CAT, + 2.56%). Most fell shares of Johnson & Johnson (JNJ, -0.98%).
Almost all sectors of the S & P index finished trading in positive territory. The leader of growth was the financial sector (+ 1.4%). Decrease showed only the sector of public services (-0,6%).
At closing:
DJIA + 0.66% 21,452.35 +141.69
Nasdaq + 1.43% 6.234.41 +87.79
S & P + 0.88% 2,440.62 +21.24
Major U.S. stock-indexes rose, as bank shares rallied, supported by the announcement that the markets misinterpreted ECB President Draghi's comments Tuesday as hawkish, while technology names recovered after a two-day selloff. Additional support was provided by growing commodities prices.
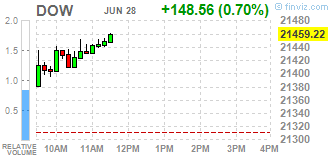
Almost all of Dow stocks in positive area (28 of 30). Top gainer - The Walt Disney Company (DIS, +1.94%). The only losers - Johnson & Johnson (JNJ, -0.24%) and Pfizer Inc. (PFE, -0.13%).
All S&P sectors in positive area. Top gainers - Basic Materials (+1.09%) and Financials (+1.06%).
At the moment:
Dow 21387.00 +96.00 +0.45%
S&P 500 2434.25 +13.75 +0.57%
Nasdaq 100 5717.25 +40.75 +0.72%
Crude Oil 44.58 +0.34 +0.77%
Gold 1250.20 +3.30 +0.26%
U.S. 10yr 2.22 +0.02
U.S. commercial crude oil inventories (excluding those in the Strategic Petroleum Reserve) increased by 0.1 million barrels from the previous week. At 509.2 million barrels, U.S. crude oil inventories are in the upper half of the average range for this time of year.
Total motor gasoline inventories decreased by 0.9 million barrels last week, but are above the upper limit of the average range. Finished gasoline inventories increased while blending components inventories decreased last week.
Distillate fuel inventories decreased by 0.2 million barrels last week but are above the upper limit of the average range for this time of year. Propane/propylene inventories increased by 3.9 million barrels last week but are in the lower half of the average range. Total commercial petroleum inventories increased by 0.8 million barrels last week.
The ongoing supply shortages that are propping up home prices in many metro areas caused pending home sales in May to slump for the third consecutive month, according to the National Association of Realtors. None of the major regions saw an increase in contract activity last month.
The Pending Home Sales Index, a forward-looking indicator based on contract signings, decreased 0.8 percent to 108.5 in May from a downwardly revised 109.4 in April. The index is now 1.7 percent below a year ago, which marks the second straight annual decline and the most recent since November and December of last year.
Lawrence Yun, NAR chief economist, says it's clear the critically low inventory levels in much of the country somewhat sidetracked the housing market this spring. "Monthly closings have recently been oscillating back and forth, but this third consecutive decline in contract activity implies a possible topping off in sales," he said. "Buyer interest is solid, but there is just not enough supply to satisfy demand. Prospective buyers are being sidelined by both limited choices and home prices that are climbing too fast."
-
Readiness to raise rates hinges on how much weaker consumption is offset by business investment
-
Other factors include wages and unit labour costs, economy's reaction to Brexit talks
-
Global equilibrium interest rate could rise given strong global economy, makes a given policy setting more accommodative
-
MPC will debate issues around raising rates "in the coming months"
EURUSD: 1.1210-20 (EUR 915m) 1.1240 (545m) 1.1290-1300 (850m) 1.1350 (805m) 1.1400 (205m)
USDJPY: 111.00 (USD 270m) 111.20-30 (670m) 111.50-60 (2.7bln) 111.80 (337m) 112.00-10 (480m) 113.00 (275m)
GBPUSD: 1.2690-00 (GBP 780m)
EURGBP: 0.8720 (EUR 200m) 0.8750 (441m) 0.8775 (490m) 0.8830 (300m) 0.8900 (465m)
AUDUSD: 0.7450 (AUD 270m) 0.7525-35 (695m)
USDCAD: 1.3150 (USD 180m) 1.3180-90 (340m) 1.3200-10 (190m)
NZDUSD: 0.7300-05 (NZD 250m)
U.S. stock-index futures rose, as a selloff in technology stocks stalled and after a report that investors overinterpreted the ECB President Mario Draghi's comments about the regulator's readiness to start withdrawing fiscal stimulus.
Stocks:
Nikkei 20,130.41 -94.68 -0.47%
Hang Seng 25,683.50 -156.49 -0.61%
Shanghai 3,173.90 -17.29 -0.54%
S&P/ASX 5,755.70 +41.50 +0.73%
FTSE 7,435.97 +1.61 +0.02%
CAC 5,261.57 +2.99 +0.06%
DAX 12,646.88 -24.14 -0.19%
Crude $44.09 (-0.34%)
Gold $1,254.40 (+0.60%)
(company / ticker / price / change ($/%) / volume)
| 3M Co | MMM | 210.3 | 0.52(0.25%) | 1160 |
| ALCOA INC. | AA | 31.99 | 0.36(1.14%) | 200 |
| ALTRIA GROUP INC. | MO | 75.54 | 0.16(0.21%) | 2061 |
| Amazon.com Inc., NASDAQ | AMZN | 983.8 | 7.02(0.72%) | 37186 |
| American Express Co | AXP | 83.25 | 0.17(0.20%) | 934 |
| AMERICAN INTERNATIONAL GROUP | AIG | 63.65 | 0.24(0.38%) | 225 |
| Apple Inc. | AAPL | 144.52 | 0.79(0.55%) | 293847 |
| AT&T Inc | T | 37.8 | 0.10(0.27%) | 8494 |
| Barrick Gold Corporation, NYSE | ABX | 16.15 | 0.07(0.44%) | 35521 |
| Caterpillar Inc | CAT | 103.63 | -0.30(-0.29%) | 1832 |
| Cisco Systems Inc | CSCO | 31.98 | 0.22(0.69%) | 5970 |
| Citigroup Inc., NYSE | C | 64.6 | 0.37(0.58%) | 27835 |
| Exxon Mobil Corp | XOM | 81.05 | -0.06(-0.07%) | 1095 |
| Facebook, Inc. | FB | 151.7 | 1.12(0.74%) | 122260 |
| Ford Motor Co. | F | 11.09 | 0.01(0.09%) | 12057 |
| Freeport-McMoRan Copper & Gold Inc., NYSE | FCX | 11.73 | 0.01(0.09%) | 2400 |
| General Electric Co | GE | 27.31 | 0.10(0.37%) | 11647 |
| General Motors Company, NYSE | GM | 34.33 | 0.12(0.35%) | 4813 |
| Goldman Sachs | GS | 221.5 | 1.22(0.55%) | 2469 |
| Google Inc. | GOOG | 929.5 | 2.17(0.23%) | 18479 |
| Home Depot Inc | HD | 152.5 | 0.26(0.17%) | 130 |
| Intel Corp | INTC | 33.7 | 0.05(0.15%) | 26622 |
| International Business Machines Co... | IBM | 155.6 | 0.85(0.55%) | 1038 |
| JPMorgan Chase and Co | JPM | 88.5 | 0.45(0.51%) | 14420 |
| McDonald's Corp | MCD | 153.76 | 0.04(0.03%) | 522 |
| Merck & Co Inc | MRK | 65.51 | -0.03(-0.05%) | 530 |
| Microsoft Corp | MSFT | 69.32 | 0.11(0.16%) | 62449 |
| Nike | NKE | 53.5 | 0.55(1.04%) | 500 |
| Pfizer Inc | PFE | 33.8 | 0.03(0.09%) | 6064 |
| Starbucks Corporation, NASDAQ | SBUX | 58.9 | -0.06(-0.10%) | 3140 |
| Tesla Motors, Inc., NASDAQ | TSLA | 367 | 4.63(1.28%) | 100682 |
| The Coca-Cola Co | KO | 44.96 | -0.09(-0.20%) | 2998 |
| Twitter, Inc., NYSE | TWTR | 18.23 | 0.11(0.61%) | 41551 |
| Verizon Communications Inc | VZ | 44.98 | 0.14(0.31%) | 3894 |
| Visa | V | 94.89 | -0.01(-0.01%) | 506 |
| Walt Disney Co | DIS | 105.68 | 0.27(0.26%) | 1605 |
| Yandex N.V., NASDAQ | YNDX | 26.83 | -0.05(-0.19%) | 2100 |
The international trade deficit was $65.9 billion in May, down $1.2 billion from $67.1 billion in April. Exports of goods for May were $127.1 billion, $0.5 billion more than April exports. Imports of goods for May were $193.0 billion, $0.8 billion less than April imports.
Wholesale inventories for May, adjusted for seasonal variations but not for price changes, were estimated at an end-of-month level of $593.4 billion, up 0.3 percent (±0.4 percent)* from April 2017, and were up 1.8 percent (±0.7 percent) from May 2016. The March 2017 to April 2017 percentage change was revised from down 0.5 percent (±0.2 percent) to down 0.4 percent (±0.2 percent).
General Motors (GM) resumed with an Overweight at Morgan Stanley; target $40
EUR/USD
Offers: 1.1400 1.1420 1.1435 1.1450 1.1480 1.1500
Bids: 1.1350 1.1320 1.1300 1.1280 1.1250 1.1230 1.1200
GBP/USD
Offers: 1.2835 1.2855-60 1.2880 1.2900 1.2950
Bids: 1.2800 1.2780-85 1.2760 1.2730 1.2700 1.2680 1.2665 1.2650
EUR/JPY
Offers: 127.60 127.80-85 128.00 128.30 128.50 129.00
Bids: 127.00 126.80 126.50 126.30 126.00
EUR/GBP
Offers: 0.8880-85 0.8900 0.8925-30 0.8950 0.8980 0.9000
Bids: 0.8860 0.8850 0.8820 0.8800 0.8785 0.8750-55
USD/JPY
Offers: 112.50 112.80 113.00 113.50 113.80 114.00
Bids: 112.00 111.75-80 111.50 111.20 111.00
AUD/USD
Offers: 0.7620 0.7635 0.7650 0.7680 0.7700
Bids: 0.7580 0.7560 0.7520 0.7500 0.7480 0.7450
-
It looks as if elements of the global reform might be postponed or not even implemented
In June 2017, according to preliminary estimates, the Italian consumer price index for the whole nation (NIC) decreased by 0.1% on monthly basis and increased by 1.2% compared with June 2016, down from +1.4% in May 2017.
In June, the lower growth of the annual rate of change of All items index was mainly due to the prices of Unprocessed food (+1.3%, from +3.8% in May) and Non-regulated energy products (+3.0%, from +6.8% in the previous month), partly offset by the increase of the prices of Services related to transport (+4.1% from +3.2% in May).
Therefore, excluding energy and unprocessed food, core inflation increased by +0.9% (0.2 percentage points higher than in May), while inflation excluding energy was +0.9% (0.1 percentage points lower than in the previous month).
The annual rate of change of prices of Goods was +0.9% (down from +1.6% in May) and that one of prices of Services was +1.5% (up from +1.4%). As a consequence, the inflationary gap between Services and Goods was positive again (+0.6 percentage points).
The annual growth rate of the broad monetary aggregate M3 stood at 5.0% in May 2017, after 4.9% in April, averaging 5.1% in the three months up to May.
The components of M3 showed the following developments. The annual growth rate of the narrower aggregate, including currency in circulation and overnight deposits (M1), stood at 9.3% in May, unchanged from the previous month. The annual growth rate of short-term deposits other than overnight deposits (M2-M1) stood at -2.9% in May, compared with -2.8% in April.
The annual growth rate of marketable instruments (M3-M2) increased to 3.1% in May, from 1.7% in April. Within M3, the annual growth rate of deposits placed by households decreased to 5.1% in May, from 5.3% in April, while the annual growth rate of deposits placed by non-financial corporations increased to 7.5% in May, from 7.1% in April. Finally, the annual growth rate of deposits placed by non-monetary financial corporations (excluding insurance corporations and pension funds) increased to 2.8% in May, from 1.4% in April.
EUR/USD
Resistance levels (open interest**, contracts)
$1.1435 (2598)
$1.1419 (3692)
$1.1404 (1900)
Price at time of writing this review: $1.1373
Support levels (open interest**, contracts):
$1.1341 (212)
$1.1313 (1394)
$1.1279 (1763)
Comments:
- Overall open interest on the CALL options and PUT options with the expiration date July, 7 is 70275 contracts (according to data from June, 27) with the maximum number of contracts with strike price $1,1100 (4552);
GBP/USD
Resistance levels (open interest**, contracts)
$1.3013 (2137)
$1.2938 (2358)
$1.2885 (2428)
Price at time of writing this review: $1.2811
Support levels (open interest**, contracts):
$1.2755 (2773)
$1.2681 (2744)
$1.2593 (1369)
Comments:
- Overall open interest on the CALL options with the expiration date July, 7 is 32975 contracts, with the maximum number of contracts with strike price $1,2800 (2428);
- Overall open interest on the PUT options with the expiration date July, 7 is 29506 contracts, with the maximum number of contracts with strike price $1,2800 (2773);
- The ratio of PUT/CALL was 0.89 versus 0.90 from the previous trading day according to data from June, 27
* - The Chicago Mercantile Exchange bulletin (CME) is used for the calculation.
** - Open interest takes into account the total number of option contracts that are open at the moment.
-
Declines to comment on relationship with president Trump
-
Traditional to have good ties between treasury and Fed and I have continued that tradition with Sec. Mnuchin
-
Soundness of financial system is very important to our view
-
We have a strong banking sector, well capitalised with a lot of liquidity
-
Number of reasons to believe interest rates will remain low as we normalise policy
-
We are looking carefully at inflation expectations
-
Says we have no choice but to solve healthcare situation
-
Tells republican senators "ee're getting very close" on healthcare bill
-
Lesson from last few years is that UK economy hasn't generated much inflation pressure
-
Domestic inflation pressure data gives us time to see how it evolves
-
Banks' lending standards should not be affected by boe interest rates
-
BoE bank rate is very small fraction in bank lending rates
Prices rose 1.1% month-on-month in June, reversing the previous three months' falls.
Annual house price growth rises to 3.1%
Gap in house price growth between strongest and weakest performing regions in Q2 is the smallest on record
Commenting on the figures, Robert Gardner, Nationwide's Chief Economist, said: "UK house prices rebounded in June, with prices rising by 1.1% during the month, erasing the decline recorded over the previous three months. However, monthly growth rates can be volatile, even after accounting for seasonal effects. "The annual rate of house price growth, which gives a better sense of the underlying trend, continues to point to modest price gains. Annual house price growth edged up to 3.1% from 2.1% in May. In effect, after two sluggish months, annual price growth has returned to the 3-6% range that had been prevailing since early 2015.
As reported by the Federal Statistical Office (Destatis), the index of import prices increased by 4.1% in May 2017 compared with the corresponding month of the preceding year. In April 2017 and in March 2017 the annual rates of change were +6.1%, each. From April 2017 to May 2017 the index fell by 1.0%.
The index of import prices, excluding crude oil and mineral oil products, increased by 3.6% compared with the level of a year earlier.
The index of export prices increased by 2.2% in May 2017 compared with the corresponding month of the preceding year. In April 2017 and in March 2017 the annual rates of change were +2.6% and +2.3%, respectively. From April 2017 to May 2017 the export price index fell by 0.2%
European stocks closed with losses Tuesday, feeling the weight of a rising euro, as profit warnings and merger concerns also hit the region's equities. The shared currency gained after European Central Bank President Mario Draghi said in a speech in Portugal that "a considerable degree" of stimulus is needed in the eurozone, a step back from the stimulus levels signaled in earlier speeches.
U.S. stocks fell on Tuesday, with major indexes ending near session lows after Senate Republicans delayed a vote on health care legislation and as losses for technology shares deepened. Tuesday marked the second straight daily decline for the Nasdaq. The S&P 500 has fallen in four of the past six sessions while the Dow has dropped in five of the past six.
Stock selling eased in the Asia-Pacific region Wednesday after overnight declines in the U.S. and Europe on worries the European Central Bank would reduce monetary stimulus.


© 2000-2024. All rights reserved.
This site is managed by Teletrade D.J. LLC 2351 LLC 2022 (Euro House, Richmond Hill Road, Kingstown, VC0100, St. Vincent and the Grenadines).
The information on this website is for informational purposes only and does not constitute any investment advice.
The company does not serve or provide services to customers who are residents of the US, Canada, Iran, The Democratic People's Republic of Korea, Yemen and FATF blacklisted countries.
Making transactions on financial markets with marginal financial instruments opens up wide possibilities and allows investors who are willing to take risks to earn high profits, carrying a potentially high risk of losses at the same time. Therefore you should responsibly approach the issue of choosing the appropriate investment strategy, taking the available resources into account, before starting trading.
Use of the information: full or partial use of materials from this website must always be referenced to TeleTrade as the source of information. Use of the materials on the Internet must be accompanied by a hyperlink to teletrade.org. Automatic import of materials and information from this website is prohibited.
Please contact our PR department if you have any questions or need assistance at pr@teletrade.global.
transfers