- Analytics
- News and Tools
- Market News
CFD Markets News and Forecasts — 27-07-2018
Consumer sentiment posted a trivial 0.3 point one-month decline, remaining a half of an Index-point or less from the average in the prior twelve months (97.7) or since the start of 2017 (97.4). Despite the expectation of higher inflation and higher interest rates during the year ahead, consumers have kept their confidence at high levels due to favorable job and income prospects.
This mix of positive and negative expectations is similar to past expansions, and, as in the past, it will prevail as long as increases in inflation and interest rate hikes remain modest. What is unique about the current situation is the potential impact of tariffs on the domestic economy. Concerns about tariffs greatly accelerated in the July survey.
U.S. stock-index futures rose on Friday, supported by Amazon's (AMZN) robust earnings and solid U.S. Q2 GDP data.
Global Stocks:
| Index/commodity | Last | Today's Change, points | Today's Change, % |
| Nikkei | 22,712.75 | +125.88 | +0.56% |
| Hang Seng | 28,804.28 | +23.14 | +0.08% |
| Shanghai | 2,873.59 | -8.63 | -0.30% |
| S&P/ASX | 6,300.20 | +55.70 | +0.89% |
| FTSE | 7,701.89 | +38.72 | +0.51% |
| CAC | 5,496.69 | +16.14 | +0.29% |
| DAX | 12,871.62 | +62.39 | +0.49% |
| Crude | $69.45 | | -0.23% |
| Gold | $1,231.40 | | -0.32% |
(company / ticker / price / change ($/%) / volume)
| 3M Co | MMM | 208.4 | 0.44(0.21%) | 1248 |
| ALTRIA GROUP INC. | MO | 56.2 | 0.10(0.18%) | 795 |
| Amazon.com Inc., NASDAQ | AMZN | 1,888.00 | 80.00(4.42%) | 181440 |
| American Express Co | AXP | 103.05 | 0.55(0.54%) | 2425 |
| Apple Inc. | AAPL | 194.98 | 0.77(0.40%) | 131852 |
| AT&T Inc | T | 30.45 | 0.10(0.33%) | 21280 |
| Barrick Gold Corporation, NYSE | ABX | 11.12 | 0.02(0.18%) | 13946 |
| Boeing Co | BA | 361.25 | 1.93(0.54%) | 5092 |
| Caterpillar Inc | CAT | 143.24 | 0.66(0.46%) | 5906 |
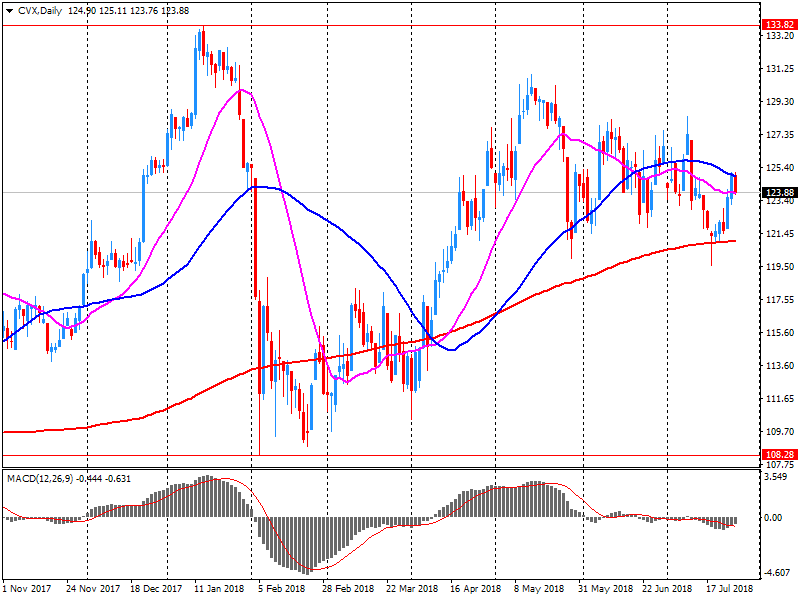
| Chevron Corp | CVX | 120.88 | -3.07(-2.48%) | 37012 |
| Cisco Systems Inc | CSCO | 43.24 | -0.29(-0.67%) | 4741 |
| Deere & Company, NYSE | DE | 143.11 | 0.38(0.27%) | 500 |
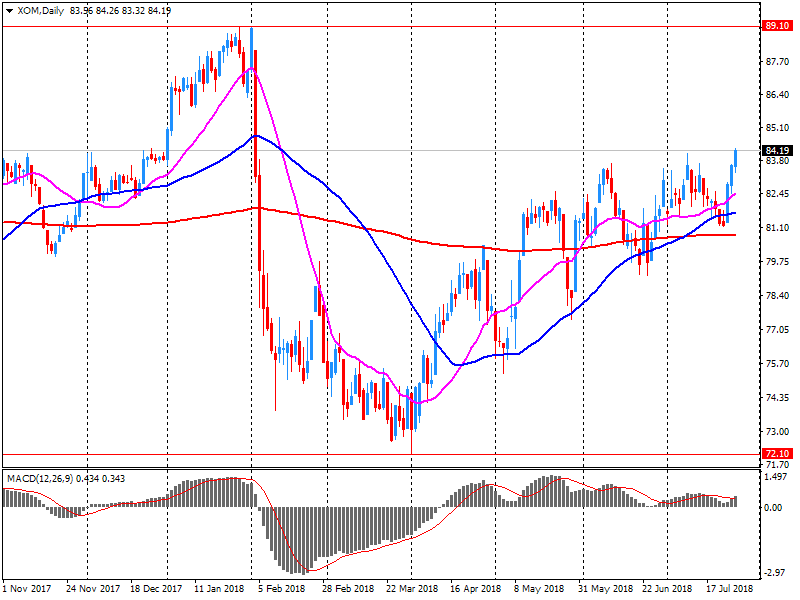
| Exxon Mobil Corp | XOM | 80.58 | -3.66(-4.34%) | 326496 |
| Facebook, Inc. | FB | 178 | 1.74(0.99%) | 782492 |
| Ford Motor Co. | F | 9.93 | 0.04(0.40%) | 134481 |
| Freeport-McMoRan Copper & Gold Inc., NYSE | FCX | 16.08 | 0.11(0.69%) | 6132 |
| General Electric Co | GE | 13.14 | -0.01(-0.08%) | 27426 |
| General Motors Company, NYSE | GM | 36.85 | 0.10(0.27%) | 4983 |
| Goldman Sachs | GS | 237 | -0.11(-0.05%) | 1637 |
| Google Inc. | GOOG | 1,272.00 | 3.67(0.29%) | 8582 |
| Home Depot Inc | HD | 200.25 | 0.85(0.43%) | 1806 |
| Intel Corp | INTC | 48.81 | -3.35(-6.42%) | 1121760 |
| International Business Machines Co... | IBM | 147 | 0.29(0.20%) | 4276 |
| Johnson & Johnson | JNJ | 130.35 | 0.07(0.05%) | 918 |
| McDonald's Corp | MCD | 156.5 | 0.36(0.23%) | 3203 |
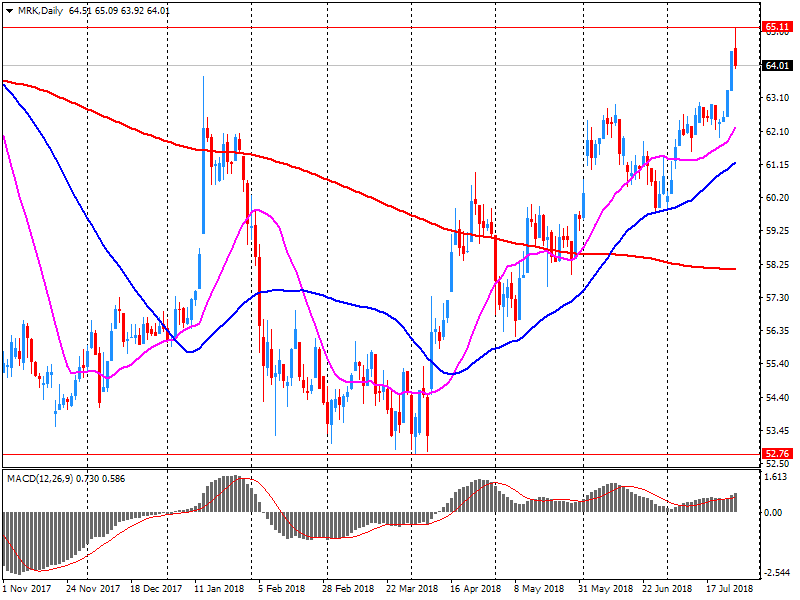
| Merck & Co Inc | MRK | 63.85 | -0.16(-0.25%) | 33840 |
| Microsoft Corp | MSFT | 110.15 | 0.53(0.48%) | 56846 |
| Nike | NKE | 78.21 | 0.06(0.08%) | 1057 |
| Pfizer Inc | PFE | 38.05 | -0.11(-0.29%) | 6976 |
| Procter & Gamble Co | PG | 79.75 | -0.34(-0.42%) | 3514 |
| Starbucks Corporation, NASDAQ | SBUX | 51.38 | -0.07(-0.14%) | 17680 |
| Tesla Motors, Inc., NASDAQ | TSLA | 306.51 | -0.14(-0.05%) | 9910 |
| The Coca-Cola Co | KO | 46.05 | -0.19(-0.41%) | 567 |
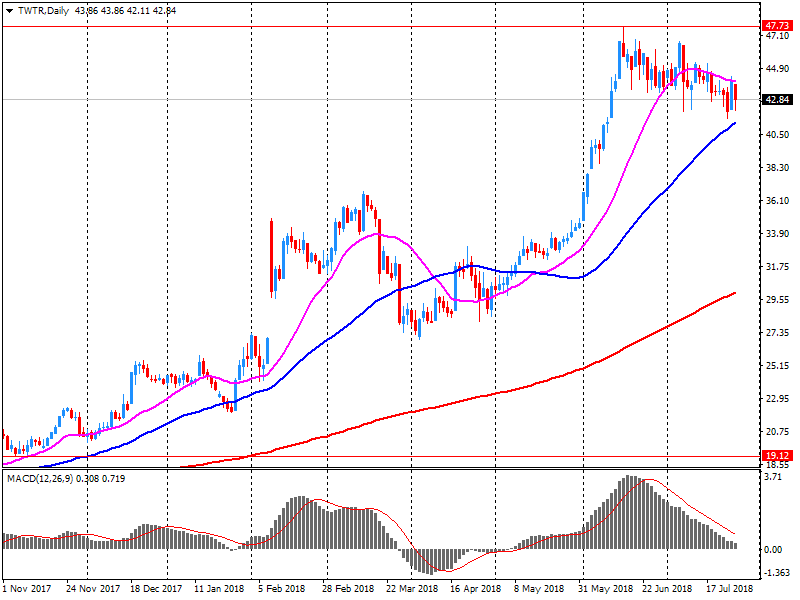
| Twitter, Inc., NYSE | TWTR | 37.98 | -4.96(-11.55%) | 8048559 |
| United Technologies Corp | UTX | 133.5 | -2.34(-1.72%) | 1214 |
| Verizon Communications Inc | VZ | 51.21 | 0.03(0.06%) | 200 |
| Visa | V | 143.25 | 0.75(0.53%) | 7527 |
| Wal-Mart Stores Inc | WMT | 88.2 | -0.03(-0.03%) | 1618 |
| Walt Disney Co | DIS | 113.5 | -0.01(-0.01%) | 2027 |
| Yandex N.V., NASDAQ | YNDX | 37.86 | 0.49(1.31%) | 8587 |
McDonald's (MCD) target lowered to $175 at Telsey Advisory Group
Intel (INTC) downgraded to Neutral from Buy at BofA/Merrill
Intel (INTC) downgraded to Neutral from Buy at Citigroup
Facebook (FB) downgraded to Hold from Buy at Edward Jones
Chevron (CVX) reported Q2 FY 2018 earnings of $1.78 per share (versus $0.77 in Q2 FY 2017), missing analysts' consensus estimate of $2.09.
The company's quarterly revenues amounted to $42.236 bln (+22.5% y/y), missing analysts' consensus estimate of $46.622 bln.
CVX fell to $120.80 (-2.54%) in pre-market trading.
Real gross domestic product increased at an annual rate of 4.1 percent in the second quarter of 2018, according to the "advance" estimate released by the Bureau of Economic Analysis. In the first quarter, real GDP increased 2.2 percent (revised).
The increase in real GDP in the second quarter reflected positive contributions from personal consumption expenditures (PCE), exports, nonresidential fixed investment, federal government spending, and state and local government spending that were partly offset by negative contributions from private inventory investment and residential fixed investment. Imports, which are a subtraction in the calculation of GDP, increased.
The price index for gross domestic purchases increased 2.3 percent in the second quarter, compared with an increase of 2.5 percent in the first quarter. The PCE price index increased 1.8 percent, compared with an increase of 2.5 percent. Excluding food and energy prices, the PCE price index increased 2.0 percent, compared with an increase of 2.2 percent
Exxon Mobil (XOM) reported Q2 FY 2018 earnings of $0.92 per share (versus $0.78 in Q2 FY 2017), missing analysts' consensus estimate of $1.27.
The company's quarterly revenues amounted to $73.501 bln (+26.6% y/y), beating analysts' consensus estimate of $71.656 bln.
XOM fell to $82.50 (-2.07%) in pre-market trading.
Twitter (TWTR) reported Q2 FY 2018 earnings of $0.17 per share (versus $0.08 in Q2 FY 2017), beating analysts' consensus estimate of $0.16.
The company's quarterly revenues amounted to $0.711 bln (+23.8% y/y), beating analysts' consensus estimate of $0.697 bln.
Twitter also said its average MAUs were 335 million for Q2, an increase of 9 million y/y and a decrease of 1 million q/q and warned about a possible decline in MAUs in the mid-single-digit millions on a sequential basis in Q3.
TWTR fell to $36.31 (-15.44%) in pre-market trading.
Merck (MRK) reported Q2 FY 2018 earnings of $1.06 per share (versus $1.01 in Q2 FY 2017), beating analysts' consensus estimate of $1.03.
The company's quarterly revenues amounted to $10.465 bln (+5.4% y/y), beating analysts' consensus estimate of $10.280 bln.
The company also issued in-line guidance for FY 2018, projecting EPS of $4.22-4.30 (versus its prior guidance of $4.16-4.28 and analysts' consensus estimate of $4.24) and revenues of $42-42.8 bln (versus its prior guidance of $41.8-43 bln and analysts' consensus estimate of $42.12 bln).
MRK rose to $64.98 (+1.52%) in pre-market trading.
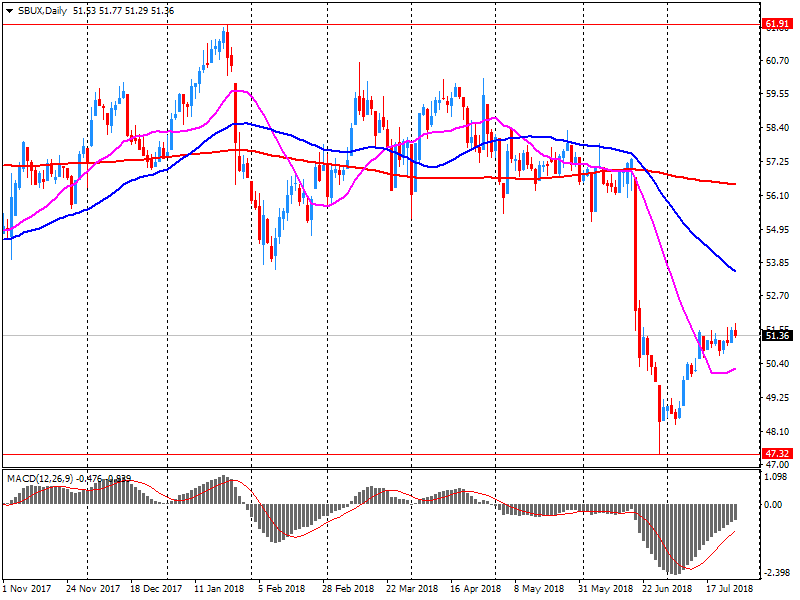
Starbucks (SBUX) reported Q3 FY 2018 earnings of $0.62 per share (versus $0.55 in Q3 FY 2017), beating analysts' consensus estimate of $0.60.
The company's quarterly revenues amounted to $6.310 bln (+11.5% y/y), generally in-line with analysts' consensus estimate of $6.252 bln.
The company also issued upside guidance for Q4, projecting EPS of $0.68 versus analysts' consensus estimate of $0.63.
SBUX fell to $51.31 (-0.27%) in pre-market trading.
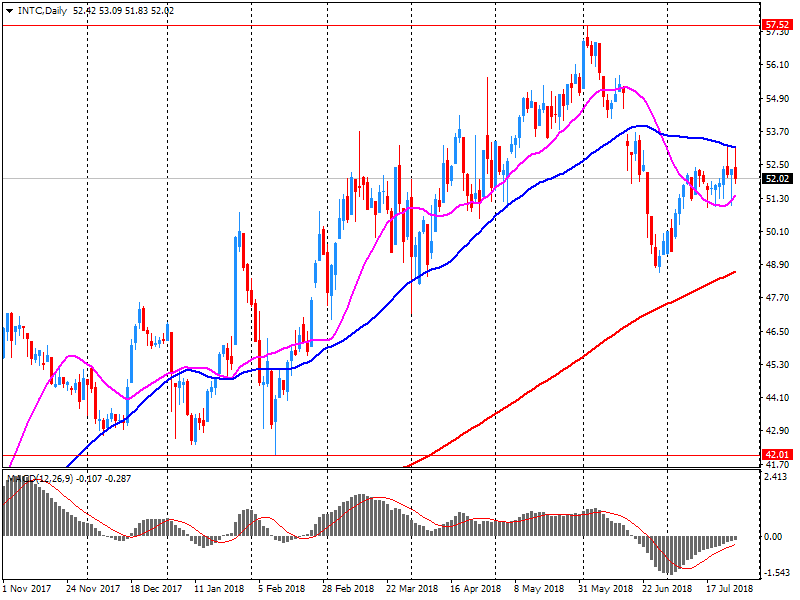
Intel (INTC) reported Q2 FY 2018 earnings of $1.04 per share (versus $0.72 in Q2 FY 2017), beating analysts' consensus estimate of $0.97.
The company's quarterly revenues amounted to $16.962 bln (+14.9% y/y), beating analysts' consensus estimate of $16.776 bln.
Intel issued guidance for Q3, projecting EPS of $1.10-1.20 versus analysts' consensus estimate of $1.08 and revenues of $17.6-18.6 bln versus analysts' consensus estimate of $17.62 bln.
The company also raised its FY 2018 EPS guidance to $3.94-4.36 (versus analysts' consensus estimate of $4.01) and revenues guidance to $68.5-70.5 bln (versus analysts' consensus estimate of $68.38 bln).
INTC fell to $48.64 (-6.75%) in pre-market trading.
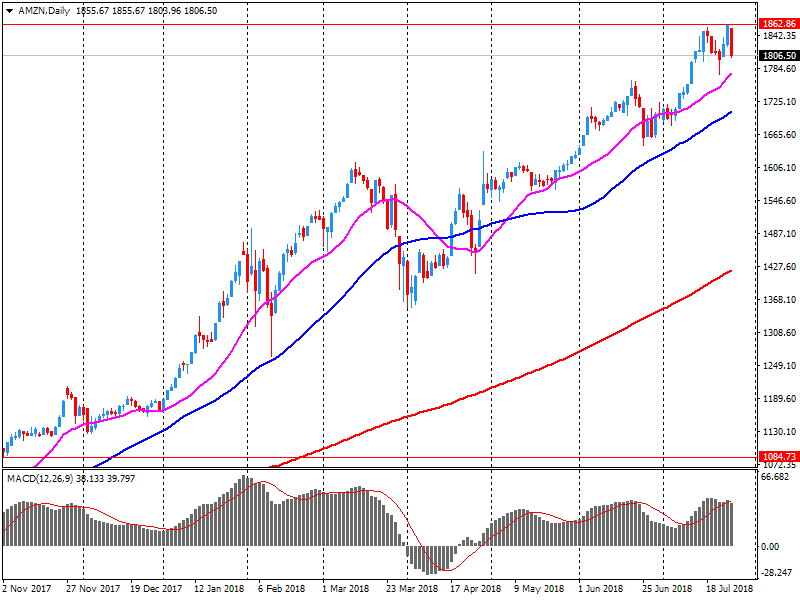
Amazon (AMZN) reported Q2 FY 2018 earnings of $5.07 per share (versus $0.40 in Q2 FY 2017), beating analysts' consensus estimate of $2.53.
The company's quarterly revenues amounted to $52.886 bln (+39.3% y/y), slightly missing analysts' consensus estimate of $53.371 bln.
The company also issued guidance for Q3, projecting Q3 revenues of $54.0-57.5 bln (versus analysts' consensus estimate of $58.04 bln) and operating income of $1.4-2.4 bln (versus analysts' consensus estimate of $1.3 bln).
AMZN rose to $1,884.20 (4.21%) in pre-market trading.
Moody's says that the fiscal and monetary easing measures announced by China's (A1 stable) authorities on 23 July signal a significant change in policy stance as its economy faces both domestic and external pressures.
While Moody's expects the immediate credit implications will be limited -- with only slightly higher levels of government debt -- the new measures suggest that the trade-offs between deleveraging and growth are becoming more stark.
Moody's conclusions are included in its just-released report "Government of China: Easing poses limited fiscal risk, but suggests policy trade-offs are starting to bite".
The new measures include fiscal and financial policies announced by China's State Council to support domestic demand and develop the real economy, and an injection of liquidity by the People's Bank of China.
Along with a more gradual shift in monetary stance over the last two months, Moody's says these measures represent a significant change towards more accommodative policy.
The measures come as a financing clampdown domestically and trade restrictive measures externally are weighing on activity growth in China.
-
Now See Eurozone Inflation at 1.7% in 2018-2020
-
Lower Eurozone Growth Forecast for 2018, 2019
The results of the ECB Survey of Professional Forecasters (SPF) for the third quarter of 2018 show average inflation expectations of 1.7% for each of 2018, 2019 and 2020. Compared with the previous survey, this represents upward revisions to 2018 and 2019, attributable to oil price developments. Average longer-term inflation expectations (which refer to 2023) remained stable at 1.9%. Expectations for real GDP growth were revised down a little in the near term to stand at 2.2%, 1.9% and 1.6% for 2018, 2019 and 2020, respectively. Expectations for real GDP growth in the longer term remained at 1.6%. Unemployment rate expectations were unchanged for 2018 and 2019, but revised upwards slightly further out.
In June 2018, household expenditure on goods was almost unchanged: +0.1% in volume. Apart from household durables purchases, which were relatively dynamic, consumption was sluggish. Over the quarter, household consumption on goods decreased for the the third consecutive quarter (−0.3% after −0.1% in first quarter 2018 as well as in fourth quarter 2017).
In June, food consumption was stable. Over the second quarter, it decreased by −1.3%, with a strong decline in tobacco spending and, to a lesser extent, in meat and meat product purchases.
EUR/USD
Resistance levels (open interest**, contracts)
$1.1773 (4476)
$1.1721 (817)
$1.1698 (155)
Price at time of writing this review: $1.1637
Support levels (open interest**, contracts):
$1.1618 (3645)
$1.1582 (3632)
$1.1541 (2645)
Comments:
- Overall open interest on the CALL options and PUT options with the expiration date August, 13 is 89509 contracts (according to data from July, 26) with the maximum number of contracts with strike price $1,1850 (5846);
GBP/USD
Resistance levels (open interest**, contracts)
$1.3269 (1016)
$1.3205 (492)
$1.3157 (285)
Price at time of writing this review: $1.3094
Support levels (open interest**, contracts):
$1.3055 (1978)
$1.3020 (2258)
$1.2981 (1573)
Comments:
- Overall open interest on the CALL options with the expiration date August, 13 is 23775 contracts, with the maximum number of contracts with strike price $1,3600 (3206);
- Overall open interest on the PUT options with the expiration date August, 13 is 27632 contracts, with the maximum number of contracts with strike price $1,2950 (2267);
- The ratio of PUT/CALL was 1.16 versus 1.16 from the previous trading day according to data from July, 26.
* - The Chicago Mercantile Exchange bulletin (CME) is used for the calculation.
** - Open interest takes into account the total number of option contracts that are open at the moment.
Consumer prices in the Tokyo area advanced an annual 0.9 percent on year in July, according to rttnews.
That exceeded expectations for an increase of 0.7 percent and was up from 0.6 percent in June.
Core CPI, which excludes volatile food costs, advanced an annual 0.8 percent. That also exceeded expectations for 0.7 percent, which would have been unchanged from the previous month.
On a monthly basis, overall inflation was up 0.3 percent and core CPI added 0.2 percent.
-
Is the second such operation conducted this week (prior operation conducted at 0.11%)
Final demand (excl. Exports):
-
Rose 0.3% in the june quarter 2018.
-
Mainly due to rises in the prices received for heavy and civil engineering construction (+1.5%), building construction (+1.2%) and petroleum refining and petroleum fuel manufacturing (+11.9%).
-
Partly offset by falls in the prices received for other agriculture (-2.9%), fishing (-18.9%) and professional and scientific equipment manufacturing (-2.3%).
-
Rose 1.5% through the year to the june quarter 2018.
Intermediate demand:
-
Rose 0.9% in the june quarter 2018.
-
Mainly due to rises in the prices received for petroleum refining and petroleum fuel manufacturing (+11.0%), oil and gas extraction (+9.6%) and sheep, beef cattle and grain farming; and dairy cattle farming (+4.3%).
-
Partly offset by falls in the prices received for real estate services (-2.8%), fishing (-9.2%) and accommodation (-6.4%).
-
Rose 4.1% through the year to the june quarter 2018.
Household consumption expenditures faltered slightly (−0.1% after +0.2%), whereas total gross fixed capital formation recovered sharply (GFCF: +0.7% after +0.1%). Overall, final domestic demand excluding inventory changes contributed as much to GDP growth as in Q1 (+0.2 points).
Imports bounced back this quarter (+1.7% after −0.3%) as did exports to a lesser extent (+0.6% after −0.4%). All in all, foreign trade balance contributed negatively to GDP growth, −0.3 points, after a neutral contribution in Q1. Conversely, changes in inventories drove GDP on (+0.3 points after 0.0 points).
As reported by the Federal Statistical Office (Destatis), the index of import prices increased by 4.8% in June 2018 compared with the corresponding month of the preceding year. In May and in April 2018 the annual rates of change were +3.2% and +0.6%, respectively. From May 2018 to June 2018 the index increased by 0.5%.
The index of import prices, excluding crude oil and mineral oil products, increased by 1.9% compared with the level of a year earlier.
The index of export prices increased by 1.8% in June 2018 compared with the corresponding month of the preceding year. In May and in April 2018 the annual rates of change were +1.3% and +0.7%, respectively. From May 2018 to June 2018 the export price index rose by 0.3%.


© 2000-2024. All rights reserved.
This site is managed by Teletrade D.J. LLC 2351 LLC 2022 (Euro House, Richmond Hill Road, Kingstown, VC0100, St. Vincent and the Grenadines).
The information on this website is for informational purposes only and does not constitute any investment advice.
The company does not serve or provide services to customers who are residents of the US, Canada, Iran, The Democratic People's Republic of Korea, Yemen and FATF blacklisted countries.
Making transactions on financial markets with marginal financial instruments opens up wide possibilities and allows investors who are willing to take risks to earn high profits, carrying a potentially high risk of losses at the same time. Therefore you should responsibly approach the issue of choosing the appropriate investment strategy, taking the available resources into account, before starting trading.
Use of the information: full or partial use of materials from this website must always be referenced to TeleTrade as the source of information. Use of the materials on the Internet must be accompanied by a hyperlink to teletrade.org. Automatic import of materials and information from this website is prohibited.
Please contact our PR department if you have any questions or need assistance at pr@teletrade.global.
transfers