- Analytics
- News and Tools
- Market News
CFD Markets News and Forecasts — 21-02-2019
| Time | Country | Event | Period | Previous value | Forecast |
|---|---|---|---|---|---|
| 07:00 | Germany | GDP (YoY) | Quarter IV | 1.1% | 0.6% |
| 07:00 | Germany | GDP (QoQ) | Quarter IV | -0.2% | 0% |
| 09:00 | Germany | IFO - Current Assessment | February | 104.3 | 103.9 |
| 09:00 | Germany | IFO - Expectations | February | 94.2 | 94.2 |
| 09:00 | Germany | IFO - Business Climate | February | 99.1 | 99 |
| 10:00 | Eurozone | Harmonized CPI | January | 0% | -1.1% |
| 10:00 | Eurozone | Harmonized CPI ex EFAT, Y/Y | January | 1% | 1.1% |
| 10:00 | Eurozone | Harmonized CPI, Y/Y | January | 1.6% | 1.4% |
| 11:00 | United Kingdom | CBI retail sales volume balance | February | ||
| 13:15 | U.S. | FOMC Member Bostic Speaks | |||
| 13:30 | Canada | Retail Sales YoY | December | 0.5% | |
| 13:30 | Canada | Retail Sales, m/m | December | -0.9% | -0.3% |
| 13:30 | Canada | Retail Sales ex Autos, m/m | December | -0.6% | -0.3% |
| 14:00 | Belgium | Business Climate | February | -1.5 | -2.3 |
| 15:15 | U.S. | FOMC Member Williams Speaks | |||
| 15:30 | Eurozone | ECB President Mario Draghi Speaks | |||
| 17:00 | U.S. | FOMC Member Clarida Speaks | |||
| 18:00 | U.S. | Baker Hughes Oil Rig Count | February | 857 | |
| 18:30 | U.S. | FOMC Member Quarles Speaks | |||
| 18:30 | U.S. | FOMC Member Harker Speaks | |||
| 22:30 | U.S. | FOMC Member Williams Speaks |
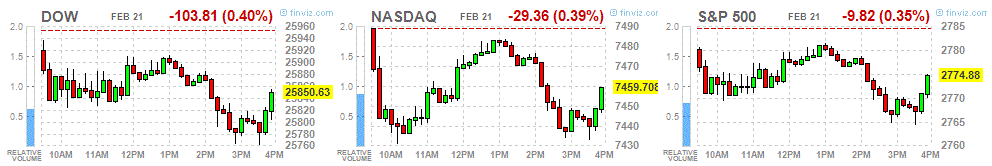
Major US stock indices fell moderately, as disappointing macroeconomic data and sales of shares in the health sector and basic materials sector put pressure on the market.
The Philadelphia Fed Report showed that its business index deteriorated in February to -4.1 from 17.0 in January. The value was significantly lower than economists forecast 14.0. The decline was the largest monthly decline since August 2011.
Meanwhile, the US Department of Commerce reported that orders for durable goods rose 1.2% in December after rising 1.0% in November (revised from 0.8%). However, economists had expected orders to increase by 1.5%. In December, orders for equipment fell by 0.4%. Orders for primary metals fell by 0.9%. Orders for electrical equipment, appliances and components have also declined.
In addition, the National Association of Realtors (NAR) reported that home sales in the US secondary market fell by 1.2% to 4.94 million units on an annualized basis in January after a decline of 4.0% to 5.00 million in December. The continuing decline surprised economists, who expected sales in the secondary housing market to rise to 5.00 million, against 4.99 million, which were originally reported the previous week.
The data released by the Conference Board showed that in January, the Leading Indicators Index (LEI) for the United States decreased by 0.1%, to 111.3 (2016 = 100), after a zero change in December and an increase of 0.1 percent in November. Analysts had expected the index to increase by 0.1%.
Wall Street also continued to monitor the trade negotiations between the United States and China. Representatives from China and the United States meet again in Washington today. In the morning there was news that Washington and Beijing began to agree on principal obligations concerning the most acute issues of the trade dispute. This indicates the most significant progress in resolving the ongoing seven-month trade war. According to media reports, the parties are developing six memorandums of understanding on structural issues, including enforced technology transfer and cyber theft, intellectual property rights, services, currencies, agriculture and non-tariff barriers to trade.
Most of the components of DOW recorded a decline (22 of 30). Walgreens Boots Alliance, Inc. was an outsider. (WBA, -1.89%). The growth leader was Microsoft Corp. (MSFT; + 2.14%).
Almost all sectors of the S & P finished trading in the red. The base materials sector fell the most (-1.1%). Only the utility sector grew (+ 0.7%).
At the time of closing:
Dow 25,850.63 -103.81 -0.40%
S & P 500 2,774.88 -9.82 -0.35%
Nasdaq 100 7,459.71 -29.36 -0.39%
| Time | Country | Event | Period | Previous value | Forecast |
|---|---|---|---|---|---|
| 07:00 | Germany | GDP (YoY) | Quarter IV | 1.1% | 0.6% |
| 07:00 | Germany | GDP (QoQ) | Quarter IV | -0.2% | 0% |
| 09:00 | Germany | IFO - Current Assessment | February | 104.3 | 103.9 |
| 09:00 | Germany | IFO - Expectations | February | 94.2 | 94.2 |
| 09:00 | Germany | IFO - Business Climate | February | 99.1 | 99 |
| 10:00 | Eurozone | Harmonized CPI | January | 0% | -1.1% |
| 10:00 | Eurozone | Harmonized CPI ex EFAT, Y/Y | January | 1% | 1.1% |
| 10:00 | Eurozone | Harmonized CPI, Y/Y | January | 1.6% | 1.4% |
| 11:00 | United Kingdom | CBI retail sales volume balance | February | ||
| 13:15 | U.S. | FOMC Member Bostic Speaks | |||
| 13:30 | Canada | Retail Sales YoY | December | 0.5% | |
| 13:30 | Canada | Retail Sales, m/m | December | -0.9% | -0.3% |
| 13:30 | Canada | Retail Sales ex Autos, m/m | December | -0.6% | -0.3% |
| 14:00 | Belgium | Business Climate | February | -1.5 | -2.3 |
| 15:15 | U.S. | FOMC Member Williams Speaks | |||
| 15:30 | Eurozone | ECB President Mario Draghi Speaks | |||
| 17:00 | U.S. | FOMC Member Clarida Speaks | |||
| 18:00 | U.S. | Baker Hughes Oil Rig Count | February | 857 | |
| 18:30 | U.S. | FOMC Member Quarles Speaks | |||
| 18:30 | U.S. | FOMC Member Harker Speaks | |||
| 22:30 | U.S. | FOMC Member Williams Speaks |
The U.S. Energy Information Administration (EIA) revealed that crude inventories rose by 3.672 million barrels in the week ended February 15. Economists had forecast an increase of 3.050 million barrels.
At the same time, gasoline stocks fell by 1.454 million barrels, while analysts had expected a drop of 0.500 million barrels. Distillate stocks reduced by 1.517 million barrels, while analysts had forecast a decrease of 1.500 million barrels.
Meanwhile, oil production in the U.S. increased by 100,000 barrels a day to 12.000 million barrels a day.
U.S. crude oil imports averaged 7.5 million barrels per day last week, up by 1,312,000 barrels per day from the previous week.
Preliminary data released by IHS Markit indicated that the U.S. private sector output growth regained momentum in February, as a robust upturn in service sector activity more than offset the slowdown reported by manufacturing firms.
According to the report, the Markit flash manufacturing purchasing manager's index (PMI) fell to 53.7 in February from 54.9 in January, signaling the slowest improvement in business conditions since September 2017. Economists had expected the reading to drop to at 54.7.
A reading above 50 signals an expansion in activity, while a reading below this level signals a contraction.
February’s decrease in the headline PMI mainly reflected a slowdown in production and new order growth.
Meanwhile, the Markit flash services purchasing manager's index (PMI) increased to 56.2 this month from 54.2 in January, indicating the sharpest upturn in activity since June 2018.
Economists had expected the reading to edge up to 54.3.
The survey said the new work rose the most since September, amid higher levels of business and consumer spending. Latest data also pointed to the steepest increase in backlogs of work for just over four years.
Overall, IHS Markit Flash U.S. Composite PMI Output Index came in at 55.8 in February, up from 54.4 in January, signaling the strongest rate of private sector output since June 2018.
Commenting on the flash PMI data, Chris Williamson, Chief Business Economist at IHS Markit noted, “February data provides a positive signal for first-quarter economic growth, with US businesses reporting the fastest output expansion since the middle of 2018… Historical comparisons suggest the latest survey data are indicative of an underlying economic growth rate of around 2.5% annualized, although the PMI is designed to monitor private sector companies so the impact of the government shutdown may not be fully captured."
The U.S. Commerce Department reported that the durable goods orders rose 1.2 percent m-o-m in December, following a revised 1.0 percent m-o-m gain in November (originally a 0.8 percent m-o-m advance).
Economists had forecast a 1.5 percent m-o-m increase.
According to the report, transportation equipment (+3.3 percent m-o-m) drove the increase. Meanwhile, orders for durable goods excluding transportation edged up 0.1 percent m-o-m, following a 0.2 percent m-o-m drop in November and missing market expectations of a 0.3 percent m-o-m gain.
Orders for non-defense capital goods excluding aircraft, a closely watched proxy for business spending plans, dropped 0.7 percent m-o-m in December, after declining 1.0 percent m-o-m in November.
U.S. stock-index fell on Thursday, as disappointing economic data outweighed positive reports on U.S.-China trade talks.
Global Stocks:
Index/commodity | Last | Today's Change, points | Today's Change, % |
Nikkei | 21,464.23 | +32.74 | +0.15% |
Hang Seng | 28,629.92 | +115.87 | +0.41% |
Shanghai | 2,751.80 | -9.42 | -0.34% |
S&P/ASX | 6,139.20 | +42.70 | +0.70% |
FTSE | 7,160.57 | -68.05 | -0.94% |
CAC | 5,200.63 | +4.68 | +0.09% |
DAX | 11,441.10 | +39.13 | +0.34% |
Crude | $56.97 | -0.33% | |
Gold | $1,338.50 | -0.70% |
(company / ticker / price / change ($/%) / volume)
ALTRIA GROUP INC. | MO | 50.62 | 0.11(0.22%) | 5209 |
Amazon.com Inc., NASDAQ | AMZN | 1,621.60 | -0.50(-0.03%) | 18034 |
Apple Inc. | AAPL | 171.92 | -0.11(-0.06%) | 82810 |
AT&T Inc | T | 30.88 | 0.03(0.10%) | 54351 |
Boeing Co | BA | 422 | 0.45(0.11%) | 11530 |
Chevron Corp | CVX | 120.2 | -0.08(-0.07%) | 693 |
Citigroup Inc., NYSE | C | 64.56 | -0.08(-0.12%) | 4668 |
Deere & Company, NYSE | DE | 159.75 | -0.13(-0.08%) | 2294 |
Exxon Mobil Corp | XOM | 78.4 | -0.13(-0.17%) | 1876 |
Facebook, Inc. | FB | 162.24 | -0.32(-0.20%) | 13108 |
Ford Motor Co. | F | 8.96 | 0.02(0.22%) | 21808 |
Freeport-McMoRan Copper & Gold Inc., NYSE | FCX | 13.39 | 0.04(0.30%) | 48651 |
General Electric Co | GE | 10.06 | -0.04(-0.40%) | 36982 |
General Motors Company, NYSE | GM | 40 | 0.05(0.13%) | 1403 |
Hewlett-Packard Co. | HPQ | 23.5 | 0.12(0.51%) | 502 |
Intel Corp | INTC | 51.35 | -0.04(-0.08%) | 14955 |
International Business Machines Co... | IBM | 138.07 | 0.07(0.05%) | 756 |
Johnson & Johnson | JNJ | 134.1 | -2.25(-1.65%) | 24341 |
JPMorgan Chase and Co | JPM | 105.7 | 0.01(0.01%) | 3748 |
McDonald's Corp | MCD | 181 | 0.51(0.28%) | 905 |
Nike | NKE | 83.7 | -1.14(-1.34%) | 150543 |
Procter & Gamble Co | PG | 99.64 | 0.36(0.36%) | 1057 |
Starbucks Corporation, NASDAQ | SBUX | 70.36 | -0.03(-0.04%) | 1970 |
Tesla Motors, Inc., NASDAQ | TSLA | 301.7 | -0.86(-0.28%) | 37077 |
The Coca-Cola Co | KO | 45.12 | 0.02(0.04%) | 10608 |
Twitter, Inc., NYSE | TWTR | 31.32 | -0.05(-0.16%) | 69229 |
Verizon Communications Inc | VZ | 55.7 | -0.06(-0.11%) | 790 |
Visa | V | 144.69 | -0.04(-0.03%) | 7960 |
Wal-Mart Stores Inc | WMT | 99.8 | -0.08(-0.08%) | 15952 |
Walt Disney Co | DIS | 113.18 | -0.50(-0.44%) | 7239 |
Yandex N.V., NASDAQ | YNDX | 32.66 | -0.20(-0.61%) | 5650 |
Statistics Canada reported the Canadian wholesale trade rose by 0.3 percent m-o-m in December, following a revised 1.1 percent m-o-m decline in the previous month.
Economists had forecast a drop of 0.1 percent m-o-m.
The December gain was led by stronger sales in the motor vehicle and parts (+3.7 percent m-o-m) and the miscellaneous (+2.0 percent m-o-m) subsectors.
Overall, sales were up in four out of seven subsectors, representing 64 percent of wholesale trade, while sales increased in six of the 10 provinces.
Sales decreased by 0.4 percent in the fourth quarter, recording the first decline following 10 consecutive quarterly gains.
Wholesale trade in Canada grew for the ninth consecutive year, up 3.7 percent, in 2018.
The data from the Labor Department revealed the number of applications for unemployment benefits fell more than expected, a sign the labor market is regaining its footing following the longest-ever government shutdown.
According to the report, the initial claims for unemployment benefits decreased 23,000 to 216,000 for the week ended February 16.
Economists had expected 229,000 new claims last week.
Claims for the prior week were unrevised at 239,000.
Meanwhile, the four-week moving average of claims rose 4,000 to 235,750 last week, the highest level since January 2018. This implies the labor market was slowing down.
- EU will defend single market integrity in dealing with Irish border issue
- Near-term growth momentum is likely to be weaker than earlier expected
- Eurozone growth could be below potential for several quarters
- A probability of recession is low, but levels of uncertainty are high
- It is unclear how long growth dip will last or if it impacts the medium-term
- ECB is concerned that weakness could affect inflation expectations
St. Louis Fed President James Bullard told CNBC in a "Squawk Box" interview on Thursday:
- Fed is in a very good place, no urgency to act
- Rates are "a bit tight" right now
- Balance sheet decision to hopefully come in "next couple of meetings"
- Getting the right level of reserves means a bigger balance sheet
- Rates are high in comparison to the global environment we're in
- Says that he argued against a December rate hike
- Says "I felt like we went too far" with December decision
- Fed might miss 2% inflation target again this year
- Fed could re-center inflation expectations around 2%
- But clearly, there is still a lot of hard work to do
- May has told the EU leaders reopening withdrawal agreement is the simplest way to get assurances needed
- The EU's position is that they want the UK to leave with a deal so everyone is working to get the necessary assurances
- The UK has strong and constructive ties with China on a range of issues and will continue to do so
- UK is a long way from getting what it needs on the Irish backstop
Sources familiar with the talks told Reuters that the U.S. and Chinese negotiators are working on six memorandums of understanding (MOUs) on structural issues, including forced technology transfer and cyber theft, intellectual property rights, services, currency, agriculture and non-tariff barriers to trade.
The sides are also discussing a 10-item list of shorter-term measures, mainly purchases of commodities and other goods.
At meetings between U.S. and Chinese officials last week in Beijing the two sides traded texts and worked on outlining obligations on paper, according to one of the sources.
The process has become a real trade negotiation, the source noted, so much so that at the end of the week the participants considered staying in Beijing to keep working. Instead, they agreed to take a few days off and reconvene in Washington.
Chinese Commerce Ministry spokesman Gao Feng declined to comment on the MOUs.
Top U.S. and Chinese trade officials will hold high-level talks on Thursday and Friday in Washington.
The probability of a recession in the United States rose to 21% from 16% three months ago, according to economists in the S & P Global Ratings report. The increased risk is partly due to the flattening of the yield curve, as well as the fact that two out of ten key indicators monitored by S & P Global Ratings moved to negative territory for the first time since mid-2017. They note that easing the monetary policy of the US Federal Reserve could improve their assessment in the coming months.
In January, the Fed decided to put a rise in interest rates on a pause, which returned calm to the markets. At the end of last year, investors' concerns about the growth prospects of the US economy provoked sharp market volatility.
The European Central Bank (ECB) increased its annual profit in 2018 thanks to income from the huge bond portfolio it had built up under its stimulus programme, the ECB said on Thursday.
The ECB's profit rose to 1.58 billion euro last year from 1.28 billion euros a year earlier, mainly as a result of higher net interest income earned on the U.S. dollar portfolio and on bonds bought as part of the 2.6 trillion euro asset purchase programme.
there is a debate if ECB normalization should go on
markets do not see rate hike in 2019
negative rates should have been ended earlier
would like to see Weidmann succeed Draghi as ECB president
does not expect abrupt changes under his successor
Brexit is a disaster
"I have something like a Brexit fatigue"
Cannot exclude possibility of a no-deal Brexit
Hopes worst can be avoided, but not very optimistic at the moment
According to the report from Istat, in January 2019 the Italian consumer price index for the whole nation (NIC) increased by 0.1% on monthly basis and by 0.9% with respect to January 2018, down from +1.1% in the previous month, confirming the flash estimate.
The slowdown of the growth on annual basis of All items index was mainly due to prices of both Regulated (from +10.7% to +7.9%) and Non-regulated energy products (from +2.6% to +0.3%), partly mitigated by the acceleration of prices of Services related to transport (from +0.6% to +2.2%) and, to a lesser extent, of Unprocessed food (from +1.3% to +1.7%).
As a consequence, Core inflation excluding energy and unprocessed food was +0.5% (in deceleration from +0.6%) and inflation excluding energy was +0.6% (stable compared to the previous month).
In January 2019, the Italian harmonized index of consumer prices (HICP) decreased by 1.7% compared with the previous month, mainly for the winter sales of Clothing and footwear (-21.2% compared with December 2018), which are not taken into account in the national index NIC. The HICP increased by +0.9%, in respect to January 2018 (it was +1.2% in December 2018), confirming the flash estimate.
The Office for National Statistics report showed:
Borrowing (public sector net borrowing excluding public sector banks) in January 2019 was in surplus by £14.9 billion, a £5.6 billion greater surplus than in January 2018; this was the largest January surplus on record (records began in 1993).
Borrowing in the current financial year-to-date (April 2018 to January 2019) (YTD) was £21.2 billion, £18.5 billion less than in the same period last year; the lowest YTD for 17 years (since 2001).
Borrowing in the financial year ending (FYE) March 2018 was £41.9 billion, £3.0 billion less than in FYE March 2017; the lowest financial year for 11 years (since FYE 2007).
Debt (public sector net debt excluding public sector banks) at the end of January 2019 was £1,782.1 billion (or 82.6% of gross domestic product (GDP)); an increase of £40.5 billion (or a decrease of 0.8 percentage points of GDP) on January 2018.
Debt at the end of January 2019 excluding Bank of England (mainly quantitative easing) was £1,596.7 billion (or 74.0% of GDP); an increase of £26.9 billion (or a decrease of 1.2 percentage points of GDP) on January 2018.
According to the report from IHS Markit, although output across the eurozone private sector increased at a slightly faster pace in February, the rate of expansion remained muted. Moreover, the manufacturing sector weighed on overall economic performance, falling into contraction during the month.
The Eurozone Composite PMI posted 51.4 in February, up from 51.0 in January and the highest in three months. Despite quickening from the five-and-a-half year low seen at the start of the year, the rate of expansion remained modest.
Flash Eurozone Services PMI Activity Index at 52.3 (51.2 in January). 3-month high.
Flash Eurozone Manufacturing PMI at 49.2 (50.5 in January). 68-month low.
Overall growth was centred on the service sector where activity also rose at the fastest pace in three months amid an improving picture in Germany and stabilisation in France. On the other hand, euro area manufacturing production decreased for the first time since June 2013. While business activity rose at a faster pace, there remained signs of demand weakness as new orders dipped for the second month running. As IHS Markit Eurozone PMI and GDP with output, the manufacturing sector was the main source of weakness in new business.
Economy Recovering At Moderate Pace
Government Maintains Economic Assessment For February
Downgrades Assessment Of Corporate Profits
Downgrades Assessment Of Industrial Production
According to the report from IHS Markit, stronger growth in Germany’s service sector drove an increase in overall business activity across the eurozone’s largest member state in February. However, the country’s outwardly-focussed manufacturing sector slipped further into contraction as export orders fell to the greatest extent for over six years. Elsewhere, employment growth remained solid midway through the opening quarter of the year, while there was a broad-based softening of inflationary pressures.
The IHS Markit Flash Germany Composite Output Index registered a reading of 52.7 in February, up from 52.1 in January and its highest since last October. Nevertheless, the index continued to point to one of the slowest rates of growth seen over the past five-and-a-half years.
Whereas the pace of expansion in service sector business activity accelerated to the quickest in five months, manufacturing output slipped into contraction, falling for the first time since April 2013 and at the quickest rate in over six years.
Flash Manufacturing PMI dropped to a 74-month low of 47.6 in February from 49.7 in January, and Flash Services PMI rose to 55.1 from 53.0 in January, and reached 5-month high.
high risk to assume EU would allow Brexit extension
According to the report from IHS Markit, Flash France Composite Output Index rose from 48.2 in January to 49.9 in February, pointing to a broad stabilisation in output after successive contractions in December and January. Flash Services Activity Index rose to 49.8 in February from 47.8 in January, reaching 3-month high.
At the sector level, service providers reported only a fractional decline in business activity and their slowest in three months of contraction. Some panellists that recorded a fall in activity cited ongoing disruption caused by the ‘gilets jaunes’ protests. Meanwhile, manufacturers saw production broadly stabilise in February. Growing order books for some survey respondents counterbalanced the negative impact of the ‘gilets jaunes’ at others. The rate of new order decline at French private sector firms eased in February. Although new business contracted for the third month in a row, the reduction was only marginal overall. The result was driven by a softer fall in the services sector and a first rise in orders for four months at manufacturers. Meanwhile, private sector firms increased their staff numbers at a quicker pace in February. This was underpinned by a faster rate of job creation at service providers, while manufacturers posted another modest workforce expansion.
According to the report from Insee, In January 2019, the Consumer Prices Index (CPI) fell back by 0.4% over a month, after a stability in December. The prices of manufactured products sharply dropped, due to the beginning of winter sales (−2.1% after −0.2%) and those of services slowed down (+0.2% after +0.4%). Food prices were also a little less dynamic than in the previous month (+0.5% after +0.6%). Contrariwise, energy prices dropped less sharply than in December (−1.2% after −2.4%), in the wake of petroleum prices. At least, tobacco prices rose by 0.8% after a stability in December.
Seasonally adjusted, consumer prices recovered by 0.2% over a month, after a 0.1% drop in December.
Year on year, consumer prices slowed down for the third consecutive month: +1.2% in January after +1.6% in December. This drop in inflation came from a year-on-year slowdown in energy. Contrariwise, services, food and tobacco prices accelerated. At least, those in manufactured products fell barely less than in the previous month.
Year on year, core inflation was unchanged: +0.7%, as in the two previous months. The Harmonised Index of Consumer Prices (HICP) edged down over a month (?0.6% after +0.1% in December); year on year, it grew by 1.4%, after +1.9% in the previous month.
Work and Pensions Secretary Amber Rudd, Justice Secretary David Gauke, Business Secretary Greg Clark and Scotland Secretary David Mundell said she must take no deal off the table by extending Article 50, the newspaper said.
If May refuses, the senior ministers said they and 20 other members of the government would back Labour lawmaker Yvette Cooper’s plan for parliament to seize control of the Brexit process.
Italian daily La Repubblica, citing an EU Commission document, said on Thursday, that Italy's budget does not contain measures able to boost growth and makes Italy a "risk of contagion" for the rest of the euro zone,
The newspaper cited the commission's Country Report, due to be approved on Wednesday, as saying the Italian budget would have negative effects on economic growth, deficit and debt.
According to the report from Destatis, compared with December 2018, the consumer price in Germany index fell markedly by 0.8% in January 2019. Consumer prices were 1.4% higher in January 2019 than in January 2018. The inflation rate – measured by the consumer price index – thus decreased (December 2018: +1.6%).
The main reason for the inflation rate being lower than in the previous month was the development of energy product prices. Energy prices rose 2.3% in January 2019 on January 2018. The increase in energy prices thus slowed again (December 2018: +4.9%; November 2018: +8.7%). A glance at the individual energy products shows that the prices of electricity, gas and other fuels were up 3.3% from January 2018 to January 2019. Motor fuel prices rose 0.3% over the same period. Excluding energy prices, the inflation rate in January 2019 would have been +1.3%.
A major reason for the 0.8% decrease in prices in January 2019 on December 2018 was seasonal factors. Especially package holiday prices (-24.6%) in January 2019 were lower than in the vacation month of December. Also, the prices of clothing (-6.0%) and footwear (-3.1%) were markedly down on the previous month, which was especially due to the discounts given on the winter collection.
sees more headwinds, including slower global growth, uncertainty, tighter financial conditions
EUR/USD
Resistance levels (open interest**, contracts)
$1.1450 (4905)
$1.1426 (1323)
$1.1408 (1178)
Price at time of writing this review: $1.1332
Support levels (open interest**, contracts):
$1.1299 (2837)
$1.1267 (5635)
$1.1229 (5107)
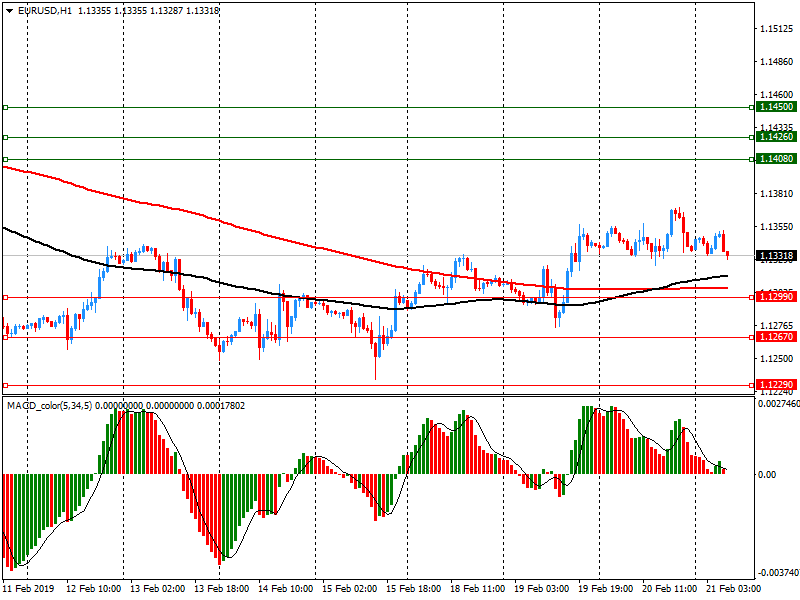
Comments:
- Overall open interest on the CALL options and PUT options with the expiration date March, 8 is 98959 contracts (according to data from February, 20) with the maximum number of contracts with strike price $1,1700 (6216);
GBP/USD
Resistance levels (open interest**, contracts)
$1.3207 (4030)
$1.3162 (3825)
$1.3130 (859)
Price at time of writing this review: $1.3029
Support levels (open interest**, contracts):
$1.2945 (1085)
$1.2916 (804)
$1.2883 (972)
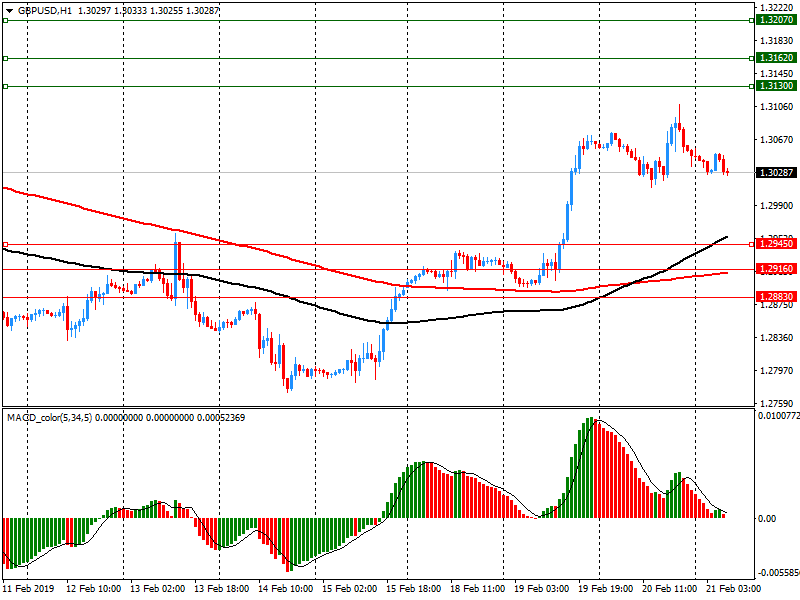
Comments:
- Overall open interest on the CALL options with the expiration date March, 8 is 42604 contracts, with the maximum number of contracts with strike price $1,3100 (4033);
- Overall open interest on the PUT options with the expiration date March, 8 is 30670 contracts, with the maximum number of contracts with strike price $1,2700 (1869);
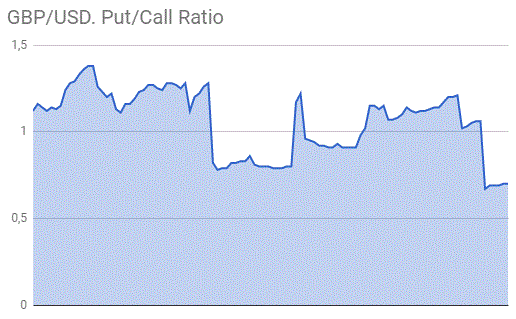
- The ratio of PUT/CALL was 0.72 versus 0.71 from the previous trading day according to data from February, 20
* - The Chicago Mercantile Exchange bulletin (CME) is used for the calculation.
** - Open interest takes into account the total number of option contracts that are open at the moment.
| Raw materials | Closed | Change, % |
|---|---|---|
| Brent | 67.1 | 1.08 |
| WTI | 57.23 | 1.51 |
| Silver | 16.03 | 0.44 |
| Gold | 1338.188 | -0.2 |
| Palladium | 1489.46 | 0.75 |
| Index | Change, points | Closed | Change, % |
|---|---|---|---|
| NIKKEI 225 | 128.84 | 21431.49 | 0.6 |
| Hang Seng | 285.92 | 28514.05 | 1.01 |
| KOSPI | 24.13 | 2229.76 | 1.09 |
| ASX 200 | -10.4 | 6096.5 | -0.17 |
| FTSE 100 | 49.45 | 7228.62 | 0.69 |
| DAX | 92.76 | 11401.97 | 0.82 |
| Dow Jones | 63.12 | 25954.44 | 0.24 |
| S&P 500 | 4.94 | 2784.7 | 0.18 |
| NASDAQ Composite | 2.3 | 7489.07 | 0.03 |
| Pare | Closed | Change, % |
|---|---|---|
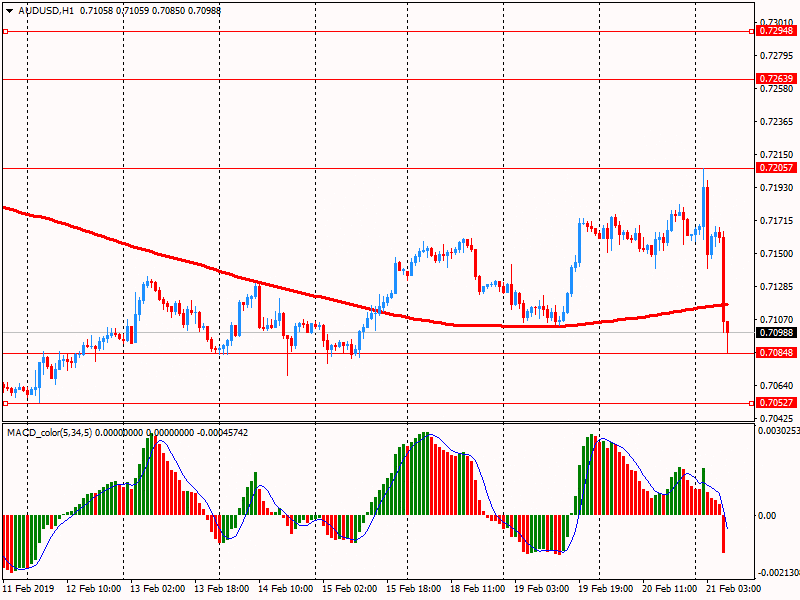
| AUDUSD | 0.71625 | -0.01 |
| EURJPY | 125.665 | 0.2 |
| EURUSD | 1.13363 | -0.03 |
| GBPJPY | 144.647 | 0.13 |
| GBPUSD | 1.30491 | -0.1 |
| NZDUSD | 0.68548 | -0.41 |
| USDCAD | 1.31758 | -0.27 |
| USDCHF | 1.001 | -0.01 |
| USDJPY | 110.846 | 0.23 |


© 2000-2024. All rights reserved.
This site is managed by Teletrade D.J. LLC 2351 LLC 2022 (Euro House, Richmond Hill Road, Kingstown, VC0100, St. Vincent and the Grenadines).
The information on this website is for informational purposes only and does not constitute any investment advice.
The company does not serve or provide services to customers who are residents of the US, Canada, Iran, The Democratic People's Republic of Korea, Yemen and FATF blacklisted countries.
Making transactions on financial markets with marginal financial instruments opens up wide possibilities and allows investors who are willing to take risks to earn high profits, carrying a potentially high risk of losses at the same time. Therefore you should responsibly approach the issue of choosing the appropriate investment strategy, taking the available resources into account, before starting trading.
Use of the information: full or partial use of materials from this website must always be referenced to TeleTrade as the source of information. Use of the materials on the Internet must be accompanied by a hyperlink to teletrade.org. Automatic import of materials and information from this website is prohibited.
Please contact our PR department if you have any questions or need assistance at pr@teletrade.global.
transfers