- Analytics
- News and Tools
- Market News
CFD Markets News and Forecasts — 19-04-2018
| raw materials | closing price | % change |
| Oil | 68.15 | -0.47% |
| Gold | 1,348.00 | -0.41% |
| index | closing price | change items | % change |
| Nikkei | +32.98 | 22191.18 | +0.15% |
| TOPIX | +0.51 | 1750.18 | +0.03% |
| Hang Seng | +424.19 | 30708.44 | +1.40% |
| CSI 300 | +45.56 | 3811.84 | +1.21% |
| Euro Stoxx 50 | -4.29 | 3486.60 | -0.12% |
| FTSE 100 | +11.58 | 7328.92 | +0.16% |
| DAX | -23.41 | 12567.42 | -0.19% |
| CAC 40 | +11.47 | 5391.64 | +0.21% |
| DJIA | -83.18 | 24664.89 | -0.34% |
| S&P 500 | -15.51 | 2693.13 | -0.57% |
| NASDAQ | -57.18 | 7238.06 | -0.78% |
| S&P/TSX | -75.55 | 15454.42 | -0.49% |
| Pare | Closed | % change |
| EUR/USD | $1,2345 | -0,26% |
| GBP/USD | $1,4086 | -0,84% |
| USD/CHF | Chf0,97044 | +0,22% |
| USD/JPY | Y107,38 | +0,17% |
| EUR/JPY | Y132,57 | -0,10% |
| GBP/JPY | Y151,267 | -0,67% |
| AUD/USD | $0,7727 | -0,72% |
| NZD/USD | $0,7270 | -0,61% |
| USD/CAD | C$1,26586 | +0,26% |
| Time | Region | Event | Period | Previous | Forecast |
| 01:45 | USA | FOMC Member Mester Speaks | | | |
| 02:30 | Japan | National CPI Ex-Fresh Food, y/y | March | 1% | 0.9% |
| 02:30 | Japan | National Consumer Price Index, y/y | March | 1.5% | 1.1% |
| 07:30 | Japan | Tertiary Industry Index | February | -0.6% | |
| 09:00 | Germany | Producer Price Index (YoY) | March | 1.8% | 2% |
| 09:00 | Germany | Producer Price Index (MoM) | March | -0.1% | 0.2% |
| 12:30 | United Kingdom | MPC Member Saunders Speaks | | | |
| 14:30 | Germany | German Buba President Weidmann Speaks | | | |
| 15:30 | Canada | Retail Sales YoY | February | 3.6% | |
| 15:30 | Canada | Retail Sales, m/m | February | 0.3% | 0.3% |
| 15:30 | Canada | Consumer Price Index m / m | March | 0.6% | 0.4% |
| 15:30 | Canada | Bank of Canada Consumer Price Index Core, y/y | March | 1.5% | 1.5% |
| 15:30 | Canada | Consumer price index, y/y | March | 2.2% | 2.4% |
| 15:30 | Canada | Retail Sales ex Autos, m/m | February | 0.9% | 0.3% |
| 16:40 | USA | FOMC Member Charles Evans Speaks | | | |
| 17:00 | Eurozone | Consumer Confidence | April | 0.1 | -0.2 |
| 18:15 | USA | FOMC Member Williams Speaks | | | |
| 20:00 | USA | Baker Hughes Oil Rig Count | April | 815 |
Major US stock indexes finished trading in the red, due to the fall in technology companies, from Apple to chipmakers, as well as components of the consumer goods sector, such as Philip Morris and P & G.
Investors also analyzed statistics on the United States. As the report of the Ministry of Labor showed, the number of Americans applying for new unemployment benefits fell last week for the third time in four weeks, signaling the preservation of the health of the labor market. According to the report, the initial applications for unemployment benefits fell by 1,000 to 232,000 for the week to April 14. Economists were expecting 230,000 new applications.
In addition, the report submitted by the Federal Reserve Bank of Philadelphia showed: the index of business activity in the production sector unexpectedly rose in April, reaching a level of 23.2 points compared to 22.3 points in March. Economists had expected the decline to 20.1 points.
At the same time, the Conference Board reported that in March the index of leading indicators (LEI) increased by 0.3 percent to 109.0, after an increase of 0.7 percent in February and 0.8 percent in January. "LEI increased in March, and although monthly growth was weaker than in the previous months, its 6-month growth rate has further increased and indicates continued strong growth in the US economy by the end of the year," said Ataman Ozildirim, Business Director, cycles and growth studies in the Conference Board. "The strengths of the leading index components have been widespread over the past six months, but the labor market components have made a negative contribution in March and will be closely monitored in the near future."
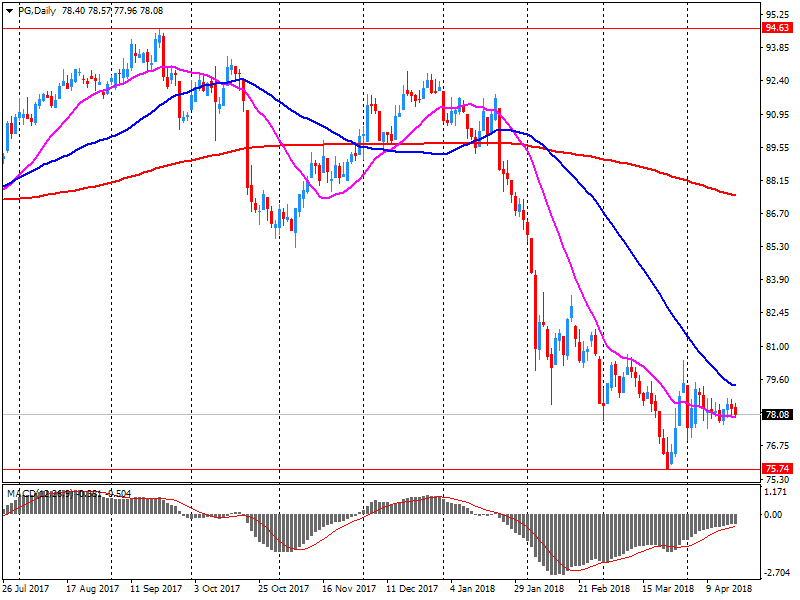
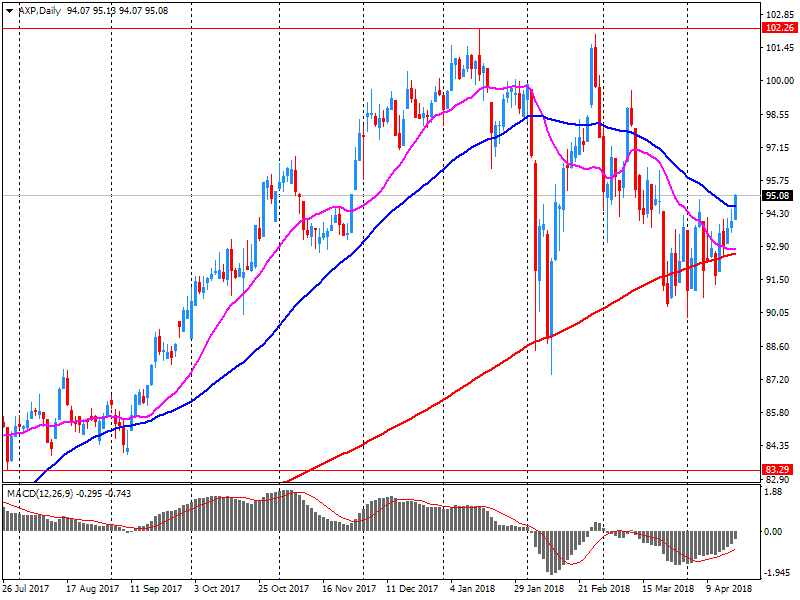
Most components of the DOW index finished trading in the red (22 of 30). Outsider were the shares of The Procter & Gamble Company (PG, -3.76%). The leader of growth was shares of American Express Company (AXP, + 7.09%).
Almost all sectors of S & P recorded a fall. The largest decline is demonstrated by the consumer goods sector (-2.3%). The financial sector grew most (+ 0.5%).
At closing:
Dow 24,664.67 -83.40 -0.34%
S&P 500 2,693.13 -15.51 -0.57%
Nasdaq 100 7,238.06 -57.18 -0.78%
U.S. stock-index futures fell on Thursday, as the effect of growing oil prices was offset by drops in Apple (AAPL) and chipmakers' stocks.
Global Stocks:
| Index/commodity | Last | Today's Change, points | Today's Change, % |
| Nikkei | 22,191.18 | +32.98 | +0.15% |
| Hang Seng | 30,708.44 | +424.19 | +1.40% |
| Shanghai | 3,117.55 | +26.15 | +0.85% |
| S&P/ASX | 5,881.00 | +19.60 | +0.33% |
| FTSE | 7,336.06 | +18.72 | +0.26% |
| CAC | 5,385.75 | +5.58 | +0.10% |
| DAX | 12,559.23 | -31.60 | -0.25% |
| Crude | $69.28 | | +1.18% |
| Gold | $1,352.00 | | -0.11% |
Results from the April Manufacturing Business Outlook Survey suggest continued growth for the region's manufacturing sector. Although the survey's indexes for general activity and employment improved slightly, the indexes for new orders and shipments moderated. The firms also reported higher prices for both inputs and their own manufactured goods this month. The survey's future indexes, measuring expectations for the next six months, reflected continued optimism.
The diffusion index for current general activity edged 1 point higher, from 22.3 in March to 23.2 this month. Nearly 37 percent of the manufacturers reported increases in overall activity this month, while 14 percent reported decreases. The indexes for current new orders and shipments remained positive but fell 17 points and 9 points, respectively.
In the week ending April 14, the advance figure for seasonally adjusted initial claims was 232,000, a decrease of 1,000 from the previous week's unrevised level of 233,000. The 4-week moving average was 231,250, an increase of 1,250 from the previous week's unrevised average of 230,000.
(company / ticker / price / change ($/%) / volume)
| 3M Co | MMM | 219.26 | -0.26(-0.12%) | 1166 |
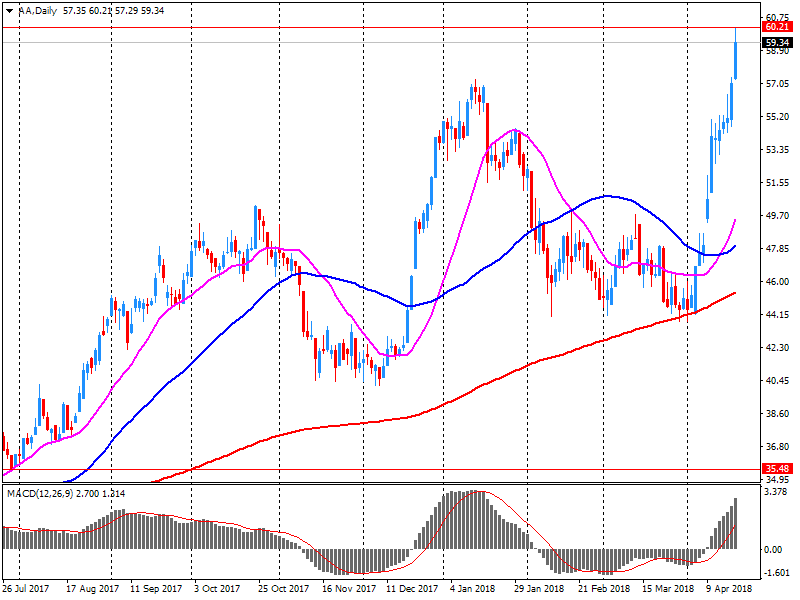
| ALCOA INC. | AA | 61.47 | 2.07(3.48%) | 91523 |
| ALTRIA GROUP INC. | MO | 61 | -0.50(-0.81%) | 4904 |
| Amazon.com Inc., NASDAQ | AMZN | 1,557.62 | 29.78(1.95%) | 146299 |
| American Express Co | AXP | 98.33 | 3.18(3.34%) | 22091 |
| Apple Inc. | AAPL | 174.73 | -3.11(-1.75%) | 467644 |
| AT&T Inc | T | 35.2 | -0.01(-0.03%) | 4800 |
| Barrick Gold Corporation, NYSE | ABX | 13.3 | 0.04(0.30%) | 4370 |
| Boeing Co | BA | 340 | -1.00(-0.29%) | 2311 |
| Caterpillar Inc | CAT | 156.03 | 0.08(0.05%) | 2826 |
| Chevron Corp | CVX | 124.68 | 0.86(0.69%) | 1057 |
| Cisco Systems Inc | CSCO | 44.49 | -0.14(-0.31%) | 3688 |
| Citigroup Inc., NYSE | C | 68.9 | -0.08(-0.12%) | 3314 |
| Exxon Mobil Corp | XOM | 79.74 | 0.52(0.66%) | 5167 |
| Facebook, Inc. | FB | 166.1 | -0.26(-0.16%) | 47522 |
| FedEx Corporation, NYSE | FDX | 253.1 | -2.43(-0.95%) | 202 |
| Ford Motor Co. | F | 11.2 | 0.02(0.18%) | 55556 |
| Freeport-McMoRan Copper & Gold Inc., NYSE | FCX | 19.29 | 0.11(0.57%) | 9723 |
| General Electric Co | GE | 13.7 | 0.04(0.29%) | 52196 |
| General Motors Company, NYSE | GM | 38.8 | -0.13(-0.33%) | 602 |
| Goldman Sachs | GS | 253.2 | -0.80(-0.32%) | 2809 |
| Google Inc. | GOOG | 1,072.39 | 0.31(0.03%) | 6487 |
| Home Depot Inc | HD | 179.8 | -0.05(-0.03%) | 1768 |
| HONEYWELL INTERNATIONAL INC. | HON | 150 | 0.63(0.42%) | 658 |
| Intel Corp | INTC | 52.83 | -0.78(-1.45%) | 167937 |
| International Business Machines Co... | IBM | 149.1 | 0.31(0.21%) | 40569 |
| Johnson & Johnson | JNJ | 127.64 | -0.08(-0.06%) | 1612 |
| JPMorgan Chase and Co | JPM | 109.45 | 0.13(0.12%) | 2667 |
| McDonald's Corp | MCD | 161.7 | -0.11(-0.07%) | 412 |
| Microsoft Corp | MSFT | 96.45 | 0.01(0.01%) | 52249 |
| Pfizer Inc | PFE | 36.43 | -0.06(-0.16%) | 7460 |
| Procter & Gamble Co | PG | 75.75 | -1.73(-2.24%) | 84531 |
| Starbucks Corporation, NASDAQ | SBUX | 59.4 | -0.10(-0.17%) | 2850 |
| Tesla Motors, Inc., NASDAQ | TSLA | 292.28 | -1.07(-0.36%) | 24075 |
| Twitter, Inc., NYSE | TWTR | 31.4 | -0.14(-0.44%) | 114957 |
| Visa | V | 124.5 | 0.02(0.02%) | 1400 |
| Wal-Mart Stores Inc | WMT | 88.02 | 0.45(0.51%) | 11310 |
| Walt Disney Co | DIS | 101.4 | 0.19(0.19%) | 429 |
| Yandex N.V., NASDAQ | YNDX | 35.7 | 0.72(2.06%) | 172493 |
Procter & Gamble (PG) reported Q1 FY 2018 earnings of $1.00 per share (versus $0.96 in Q1 FY 2017), beating analysts' consensus estimate of $0.99.
The company's quarterly revenues amounted to $16.281 bln (+4.3% y/y), generally in-line with analysts' consensus estimate of $16.221 bln.
The company issued in-line guidance for FY 2018, projecting EPS of ~$4.11-4.23 (+5-8% y/y) versus analysts' consensus estimate of $4.19. It also reaffirmed FY 2018 revenues of $67.0 bln (+3% y/y) versus analysts' consensus estimate of $66.98 bln.
PG rose to $77.75 (+0.34%) in pre-market trading.
American Express (AXP) reported Q1 FY 2018 earnings of $1.86 per share (versus $1.34 in Q1 FY 2017), beating analysts' consensus estimate of $1.71.
The company's quarterly revenues amounted to $9.718 bln (+11.6% y/y), beating analysts' consensus estimate of $9.488 bln.
The company also issued upside guidance for FY 2018, projecting EPS at high end of $6.90 to $7.30 versus analysts' consensus estimate of $7.10.
AXP rose to $98.61 (+3.64%) in pre-market trading.
Alcoa (AA) reported Q1 FY 2018 earnings of $0.77 per share (versus $0.63 in Q1 FY 2017), beating analysts' consensus estimate of $0.68.
The company's quarterly revenues amounted to $3.090 bln (+16.4% y/y), missing analysts' consensus estimate of $3.161 bln.
AA rose to $62.37 (+5.00%) in pre-market trading.
In the three months to March 2018 (Quarter 1), the quantity bought in retail sales fell by 0.5% when compared with Quarter 4 (Oct to Dec) 2017, with declines in all sectors except for department stores and non-store retailing.
The month-on-month growth rate fell by 1.2% due to a large fall of 7.4% from petrol sales; a likely consequence of adverse weather conditions, which impacted travel.
Department stores were the only sector to show positive growth in March at 0.8%, with feedback from retailers suggesting that online offers for Mothering Sunday and Easter boosted internet sales more than usual during the adverse weather.
The quantity bought in supermarket stores declined in March, while specialist food stores saw strong growth; possibly due to the easier access to these stores during snow.
This reflected surpluses for goods (€27.9 billion), services (€8.9 billion) and primary income (€6.3 billion), which were partly offset by a deficit for secondary income (€8.0 billion).
The 12-month cumulated current account for the period ending in February 2018 recorded a surplus of €408.1 billion (3.7% of euro area GDP), compared with €372.6 billion (3.4% of euro area GDP) in the 12 months to February 2017. This development was due to an increase in the surplus for services (from €39.1 billion to €101.9 billion), which was partially offset by decreases in the surpluses for primary income (from €115.8 billion to €94.7 billion) and goods (from €358.7 billion to €355.5 billion), as well as an increase in the deficit for secondary income (from €141.0 billion to €143.9 billion).
EUR/USD
Resistance levels (open interest**, contracts)
$1.2465 (2109)
$1.2452 (1395)
$1.2434 (216)
Price at time of writing this review: $1.2375
Support levels (open interest**, contracts):
$1.2316 (3610)
$1.2279 (3725)
$1.2237 (4438)
Comments:
- Overall open interest on the CALL options and PUT options with the expiration date May, 4 is 77353 contracts (according to data from April, 18) with the maximum number of contracts with strike price $1,2250 (4438);
GBP/USD
Resistance levels (open interest**, contracts)
$1.4361 (2141)
$1.4310 (2085)
$1.4276 (2028)
Price at time of writing this review: $1.4196
Support levels (open interest**, contracts):
$1.4129 (947)
$1.4098 (845)
$1.4063 (1202)
Comments:
- Overall open interest on the CALL options with the expiration date May, 4 is 21798 contracts, with the maximum number of contracts with strike price $1,4400 (3309);
- Overall open interest on the PUT options with the expiration date May, 4 is 24260 contracts, with the maximum number of contracts with strike price $1,3850 (2494);
- The ratio of PUT/CALL was 1.11 versus 1.08 from the previous trading day according to data from April, 18
* - The Chicago Mercantile Exchange bulletin (CME) is used for the calculation.
** - Open interest takes into account the total number of option contracts that are open at the moment.
The consumers price index (CPI) rose 0.5 percent in the March 2018 quarter, Stats NZ said today. The annual inflation rate was 1.1 percent, down from 1.6 percent in the year ended December 2017.
Government-influenced price changes affected the annual figure, with higher cigarette and tobacco prices being countered by cheaper tertiary education.
The annual tobacco tax increase on 1 January 2018 lifted quarterly inflation, with prices up 10 percent.
"The average price for packet of 25 cigarettes was $35.14 in March, compared with $31.68 last December," prices senior manager Paul Pascoe said.
Higher prices for accommodation services and petrol also contributed to the quarterly CPI rise, but they were slightly offset by seasonal falls for international airfares.
The trend participation rate increased to a record high of 65.7 per cent in March 2018, according to latest figures released by the Australian Bureau of Statistics (ABS) today.
"The labour force participation rate now sits at 65.7 per cent, the highest it has been since the series began in 1978, indicating that the population is participating in the labour market at a record high level," the Chief Economist for the ABS, Bruce Hockman, said.
In line with the increasing participation rate, employment increased by around 14,000 persons. Part-time employment increased by 13,000 persons and full-time employment by 1,000 persons, reflecting a slowing in full-time employment growth.
Over the past year, trend employment increased by 3.1 per cent, which was above the average year-on-year growth over the past 20 years (1.9 per cent).
The trend unemployment rate increased slightly to 5.6 per cent in March 2018.
"The unemployment rate has continued to be relatively constrained over the past year, and is still hovering around 5.5 to 5.7 per cent", Mr Hockman said.
-
Negotiating one on one deal on trade with Japan
-
China fx policies will support further opening of China economy
-
U.S. miscalculating if it is determined to contain China's rise
-
China well-prepared to deal with possible negative effects, resolve frictions with U.S.


© 2000-2024. All rights reserved.
This site is managed by Teletrade D.J. LLC 2351 LLC 2022 (Euro House, Richmond Hill Road, Kingstown, VC0100, St. Vincent and the Grenadines).
The information on this website is for informational purposes only and does not constitute any investment advice.
The company does not serve or provide services to customers who are residents of the US, Canada, Iran, The Democratic People's Republic of Korea, Yemen and FATF blacklisted countries.
Making transactions on financial markets with marginal financial instruments opens up wide possibilities and allows investors who are willing to take risks to earn high profits, carrying a potentially high risk of losses at the same time. Therefore you should responsibly approach the issue of choosing the appropriate investment strategy, taking the available resources into account, before starting trading.
Use of the information: full or partial use of materials from this website must always be referenced to TeleTrade as the source of information. Use of the materials on the Internet must be accompanied by a hyperlink to teletrade.org. Automatic import of materials and information from this website is prohibited.
Please contact our PR department if you have any questions or need assistance at pr@teletrade.global.
transfers