- Analytics
- News and Tools
- Market News
CFD Markets News and Forecasts — 16-04-2018
| raw materials | closing price | % change |
| Oil | 66.34 | -1.56% |
| Gold | 1,348.90 | +0.07% |
| index | closing price | change items | % change |
| Nikkei | +56.79 | 21835.53 | +0.26% |
| TOPIX | +6.86 | 1736.22 | +0.40% |
| Hang Seng | -492.79 | 30315.59 | -1.60% |
| CSI 300 | -62.28 | 3808.86 | 3808.86 |
| Euro Stoxx 50 | -6.96 | 3441.04 | -0.20% |
| FTSE 100 | -66.36 | 7198.20 | -0.91% |
| DAX | -50.99 | 12391.41 | -0.41% |
| CAC 40 | -2.06 | 5312.96 | -0.04% |
| DJIA | +212.90 | 24573.04 | +0.87% |
| S&P 500 | +21.54 | 2677.84 | +0.81% |
| NASDAQ | +49.64 | 7156.29 | +0.70% |
| S&P/TSX | +26.41 | 15300.38 | +0.17% |
| Pare | Closed | % change |
| EUR/USD | $1,2380 | +0,41% |
| GBP/USD | $1,4336 | +0,68% |
| USD/CHF | Chf0,95959 | -0,23% |
| USD/JPY | Y107,13 | -0,20% |
| EUR/JPY | Y132,62 | +0,21% |
| GBP/JPY | Y153,572 | +0,50% |
| AUD/USD | $0,7781 | +0,27% |
| NZD/USD | $0,7363 | +0,16% |
| USD/CAD | C$1,25651 | -0,38% |
| Time | Region | Event | Period | Previous | Forecast |
| 03:30 | Australia | RBA Meeting's Minutes | | | |
| 05:00 | China | Retail Sales y/y | March | 9.7% | 9.7% |
| 05:00 | China | Industrial Production y/y | March | 7.2% | 6.4% |
| 05:00 | China | Fixed Asset Investment | March | 7.9% | 7.7% |
| 05:00 | China | NBS Press Conference | | | |
| 05:00 | China | GDP y/y | I quarter | 6.8% | 6.8% |
| 07:30 | Japan | Industrial Production (MoM) | February | -6.8% | 4.1% |
| 07:30 | Japan | Industrial Production (YoY) | February | 1.4% | 2.3% |
| 11:30 | United Kingdom | Average earnings ex bonuses, 3 m/y | February | 2.6% | 2.8% |
| 11:30 | United Kingdom | Average Earnings, 3m/y | February | 2.8% | 3% |
| 11:30 | United Kingdom | ILO Unemployment Rate | February | 4.3% | 4.3% |
| 11:30 | United Kingdom | Claimant count | March | 9.2 | 13.3 |
| 12:00 | Eurozone | ZEW Economic Sentiment | April | 13.4 | 7.3 |
| 12:00 | Germany | ZEW Survey - Economic Sentiment | April | 5.1 | -0.8 |
| 15:30 | Canada | Foreign Securities Purchases | February | 5.68 | |
| 15:30 | Canada | Manufacturing Shipments (MoM) | February | -1% | 1.1% |
| 15:30 | USA | Housing Starts | March | 1.236 | 1.269 |
| 15:30 | USA | Building Permits | March | 1.298 | 1.33 |
| 16:15 | USA | Capacity Utilization | March | 78.1% | 77.9% |
| 16:15 | USA | Industrial Production YoY | March | 4.4% | |
| 16:15 | USA | Industrial Production (MoM) | March | 1.1% | 0.3% |
| 16:15 | USA | FOMC Member Williams Speaks | | | |
| 17:00 | USA | FOMC Member Quarles Speaks | | | |
| 18:00 | USA | FOMC Member Harker Speaks | | | |
| 20:40 | USA | FOMC Member Charles Evans Speaks | | |
Major US stock indexes finished trading in positive territory, helped by the growth of the services sector and easing fears that recent air strikes on Syria will escalate into a wider conflict.
In addition, investors were acting out data on the United States. The Commerce Department reported that sales in retail stores rose 0.6% in March, and stopped a succession of three consecutive declines, highlighting the improved financial picture of American households and the sustainability of economic expansion. Economists had expected an increase of 0.4%. The Easter holiday, which fell on the last weekend of the month, helped attract more visitors to the stores.
Meanwhile, the results of the research published by the Federal Reserve Bank of New York showed that the region's production index declined significantly in April, while the fall was stronger than the average forecasts of economists. According to the data, the production index fell to +15.8 points from +22.5 points in March. Previous value was not revised. It was expected that the index will be 19.80 points.
In addition, the National Association of Home Builders (NAHB) / Wells Fargo said that the confidence of builders in the market of newly built houses for one family in April fell by 1 point to the level of 69. The sub-index of HMI, measuring consumer traffic, remained at 51, and The indicator measuring sales expectations for the next six months fell by one point to 77, and the component measuring current sales conditions fell by two points to 75.
Most components of the DOW index finished trading in positive territory (27 out of 30). The leader of growth was UnitedHealth Group Incorporated (UNH, + 3.02%). Outsider were shares of General Electric Company (GE, -1.41%).
All sectors of the S & P index recorded an increase. The services sector grew most (+ 1.1%).
At closing:
Index
Dow 24,574.04 +213.90 +0.88%
S&P 500 2,677.88 +21.58 +0.81%
Nasdaq 100 7,156.28 +49.64 +0.70%
-
Says pricing power of businesses more limited than we're used to at this stage of expansion
-
Sees cyclical wage pressures building in 2018
-
Without structural reforms U.S. economic growth will be sluggish in mid- and long-term
Builder confidence in the market for newly-built single-family homes edged down one point to a level of 69 in April on the National Association of Home Builders/Wells Fargo Housing Market Index (HMI) but remains on firm ground.
"Strong demand for housing is keeping builders optimistic about future market conditions," said NAHB Chairman Randy Noel, a custom home builder from LaPlace, La. "However, builders are facing supply-side constraints, such as a lack of buildable lots and increasing construction material costs. Tariffs placed on Canadian lumber and other imported products are pushing up prices and hurting housing affordability."
Manufacturers' and trade inventories, adjusted for seasonal variations but not for price changes, were estimated at an end-of-month level of $1,928.8 billion, up 0.6 percent (±0.1 percent) from January 2018 and were up 4.0 percent (±0.3 percent) from February 2017.
The total business inventories/sales ratio based on seasonally adjusted data at the end of February was 1.35. The February 2017 ratio was 1.37.
Advance estimates of U.S. retail and food services sales for March 2018, adjusted for seasonal variation and holiday and trading-day differences, but not for price changes, were $494.6 billion, an increase of 0.6 percent from the previous month, and 4.5 percent above March 2017. Total sales for the January 2018 through March 2018 period were up 4.1 percent from the same period a year ago. The January 2018 to February 2018 percent change was unrevised from down 0.1 percent.
Retail trade sales were up 0.6 percent from February 2018, and 4.7 percent above last year. Gasoline Stations were up 9.7 percent (±1.6 percent) from March 2017, while Nonstore Retailers were up 9.7 percent (±1.4 percent) from last year.
U.S. stock-index futures rose on Monday, as investor fears that the weekend's U.S.-led attack on the Syrian government would escalate into a broader conflict, eased, while Q1 corporate earnings came into focus.
Global Stocks:
| Index/commodity | Last | Today's Change, points | Today's Change, % |
| Nikkei | 21,835.53 | +56.79 | +0.26% |
| Hang Seng | 30,315.59 | -492.79 | -1.60% |
| Shanghai | 3,110.75 | -48.30 | -1.53% |
| S&P/ASX | 5,841.30 | +12.20 | +0.21% |
| FTSE | 7,236.74 | -27.82 | -0.38% |
| CAC | 5,311.22 | -3.80 | -0.07% |
| DAX | 12,442.33 | -0.07 | 0.00% |
| Crude | $66.86 | | -0.79% |
| Gold | $1,349.80 | | +0.13% |
(company / ticker / price / change ($/%) / volume)
| 3M Co | MMM | 217.35 | 1.83(0.85%) | 2763 |
| ALCOA INC. | AA | 55.79 | 0.83(1.51%) | 3291 |
| ALTRIA GROUP INC. | MO | 63.92 | -0.03(-0.05%) | 2563 |
| Amazon.com Inc., NASDAQ | AMZN | 1,444.85 | 14.06(0.98%) | 34496 |
| American Express Co | AXP | 93.93 | 0.90(0.97%) | 1513 |
| Apple Inc. | AAPL | 175.89 | 1.16(0.66%) | 88254 |
| AT&T Inc | T | 35.25 | 0.11(0.31%) | 8312 |
| Barrick Gold Corporation, NYSE | ABX | 13.18 | 0.03(0.23%) | 12053 |
| Boeing Co | BA | 331.95 | 2.67(0.81%) | 13727 |
| Caterpillar Inc | CAT | 151.5 | 1.27(0.85%) | 3621 |
| Chevron Corp | CVX | 120.5 | 0.58(0.48%) | 1096 |
| Cisco Systems Inc | CSCO | 43.23 | 0.23(0.53%) | 13548 |
| Citigroup Inc., NYSE | C | 70.95 | -0.06(-0.08%) | 59220 |
| Deere & Company, NYSE | DE | 150.47 | 0.49(0.33%) | 531 |
| Exxon Mobil Corp | XOM | 78.13 | 0.29(0.37%) | 7889 |
| Facebook, Inc. | FB | 165.59 | 1.07(0.65%) | 89303 |
| Ford Motor Co. | F | 11.33 | 0.05(0.44%) | 5498 |
| Freeport-McMoRan Copper & Gold Inc., NYSE | FCX | 17.99 | 0.12(0.67%) | 338 |
| General Electric Co | GE | 13.45 | -0.04(-0.30%) | 322282 |
| General Motors Company, NYSE | GM | 38.97 | 0.24(0.62%) | 2387 |
| Goldman Sachs | GS | 257.4 | 1.48(0.58%) | 5684 |
| Google Inc. | GOOG | 1,034.75 | 5.48(0.53%) | 2895 |
| Hewlett-Packard Co. | HPQ | 21.91 | 0.14(0.64%) | 983 |
| Home Depot Inc | HD | 174 | 1.20(0.69%) | 698 |
| Intel Corp | INTC | 52.31 | 0.45(0.87%) | 37072 |
| International Business Machines Co... | IBM | 158 | 1.29(0.82%) | 3913 |
| International Paper Company | IP | 53.47 | 0.25(0.47%) | 188 |
| Johnson & Johnson | JNJ | 131.3 | 0.68(0.52%) | 3807 |
| McDonald's Corp | MCD | 161.19 | -0.54(-0.33%) | 10357 |
| Merck & Co Inc | MRK | 57.5 | 0.33(0.58%) | 8693 |
| Microsoft Corp | MSFT | 93.8 | 0.72(0.77%) | 38369 |
| Nike | NKE | 67.5 | 0.25(0.37%) | 546 |
| Pfizer Inc | PFE | 36.48 | 0.16(0.44%) | 4526 |
| Procter & Gamble Co | PG | 78.73 | 0.36(0.46%) | 5755 |
| Starbucks Corporation, NASDAQ | SBUX | 58.94 | -0.30(-0.51%) | 21399 |
| Tesla Motors, Inc., NASDAQ | TSLA | 301 | 0.66(0.22%) | 34576 |
| The Coca-Cola Co | KO | 44.69 | 0.18(0.40%) | 3535 |
| Twitter, Inc., NYSE | TWTR | 28.93 | 0.17(0.59%) | 29175 |
| United Technologies Corp | UTX | 123.75 | 1.04(0.85%) | 1623 |
| UnitedHealth Group Inc | UNH | 226.1 | 1.82(0.81%) | 1993 |
| Verizon Communications Inc | VZ | 47.9 | 0.24(0.50%) | 3116 |
| Visa | V | 121.41 | 0.66(0.55%) | 2261 |
| Wal-Mart Stores Inc | WMT | 86.43 | 0.41(0.48%) | 2367 |
| Walt Disney Co | DIS | 101.17 | 0.82(0.82%) | 3974 |
| Yandex N.V., NASDAQ | YNDX | 32.95 | -0.03(-0.09%) | 21843 |
McDonald's (MCD) downgraded to Equal-Weight from Overweight at Stephens
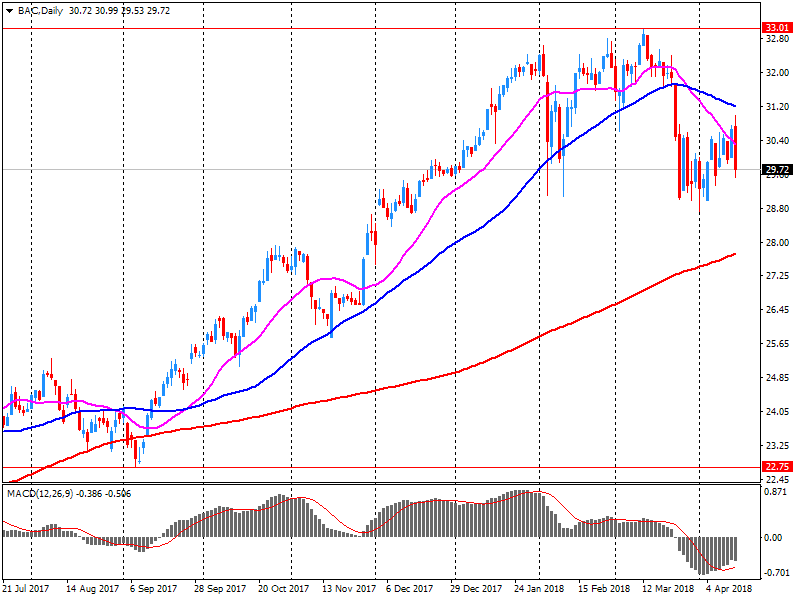
Bank of America (BAC) reported Q1 FY 2018 earnings of $0.62 per share (versus $0.41 in Q1 FY 2017), beating analysts' consensus estimate of $0.59.
The company's quarterly revenues amounted to $23.100 bln (+4.1% y/y), in-line with analysts' consensus estimate of $23.036 bln.
BAC rose to $29.94 (+0.47%) in pre-market trading.
April 16
Before the Open:
Bank of America (BAC). Consensus EPS $0.59, Consensus Revenues $23035.80 mln.
April 17
Before the Open:
Goldman Sachs (GS). Consensus EPS $5.57, Consensus Revenues $8727.11 mln.
Johnson & Johnson (JNJ). Consensus EPS $2.00, Consensus Revenues $19497.45 mln.
UnitedHealth (UNH). Consensus EPS $2.91, Consensus Revenues $54898.52 mln.
After the Close:
IBM (IBM). Consensus EPS $2.42, Consensus Revenues $18802.84 mln.
April 18
Before the Open:
Morgan Stanley (MS). Consensus EPS $1.25, Consensus Revenues $10369.14 mln.
After the Close:
Alcoa (AA). Consensus EPS $0.63, Consensus Revenues $3130.82 mln.
American Express (AXP). Consensus EPS $1.71, Consensus Revenues $9516.25 mln.
April 20
Before the Open:
General Electric (GE). Consensus EPS $0.11, Consensus Revenues $27316.83 mln.
Honeywell (HON). Consensus EPS $1.90, Consensus Revenues $10034.47 mln.
Procter & Gamble (PG). Consensus EPS $0.99, Consensus Revenues $16214.70 mln.
The Producer and Import Price Index fell in March 2018 by 0.2% compared with the previous month, reaching 102.3 points (December 2015 = 100). This decline was due in particular to lower prices for petroleum products and pharmaceutical preparations. Compared with March 2017, the price level of the whole range of domestic and imported products rose by 2.0%.
-
Says oil producers, companies must invest to meet future oil demand, compensate for annual decline rate
-
Says unless U.S. makes some meaningful changes, NAFTA agreement by end of april is unlkely
-
Japan told Chinese side that steps must be taken to address overcapacity of steel production
-
Shared understanding with Chinese side that a trade war would have serious effect on world economy
As reported by the Federal Statistical Office, the selling prices in wholesale trade increased by 1.2% in March 2018 from the corresponding month of the preceding year. In February 2018 and in January 2018 the annual rates of change were +1.2% and +2.0%, respectively.
From February 2018 to March 2018 the index did not change.
European stocks edged higher on Friday, with the benchmark index scoring a third straight week of gains, as investors watched for developments in the Syria situation and in the trade spat between the U.S. and China.
U.S. stock benchmarks on Friday wrapped up a solid week on a down note as better-than-expected first-quarter earnings failed to stir buying appetite on Wall Street, underlining concerns about lofty quarterly expectations for American corporations, high valuations and geopolitical anxiety.
Asian stocks saw early gains erode by midmorning Monday, led by declines in Hong Kong and Chinese equities as investors assess airstrikes against Syria over the weekend and focus on the start of earnings season in the U.S. as well as speeches by Federal Reserve officials.
EUR/USD
Resistance levels (open interest**, contracts)
$1.2442 (2115)
$1.2425 (1393)
$1.2394 (215)
Price at time of writing this review: $1.2332
Support levels (open interest**, contracts):
$1.2264 (3470)
$1.2227 (4047)
$1.2185 (3786)
Comments:
- Overall open interest on the CALL options and PUT options with the expiration date May, 4 is 77327 contracts (according to data from April, 13) with the maximum number of contracts with strike price $1,2650 (4066);
GBP/USD
Resistance levels (open interest**, contracts)
$1.4338 (2092)
$1.4309 (2028)
$1.4287 (883)
Price at time of writing this review: $1.4256
Support levels (open interest**, contracts):
$1.4191 (408)
$1.4166 (464)
$1.4136 (899)
Comments:
- Overall open interest on the CALL options with the expiration date May, 4 is 22602 contracts, with the maximum number of contracts with strike price $1,4400 (3207);
- Overall open interest on the PUT options with the expiration date May, 4 is 23721 contracts, with the maximum number of contracts with strike price $1,3850 (2488);
- The ratio of PUT/CALL was 1.05 versus 1.03 from the previous trading day according to data from April, 13
* - The Chicago Mercantile Exchange bulletin (CME) is used for the calculation.
** - Open interest takes into account the total number of option contracts that are open at the moment.


© 2000-2024. All rights reserved.
This site is managed by Teletrade D.J. LLC 2351 LLC 2022 (Euro House, Richmond Hill Road, Kingstown, VC0100, St. Vincent and the Grenadines).
The information on this website is for informational purposes only and does not constitute any investment advice.
The company does not serve or provide services to customers who are residents of the US, Canada, Iran, The Democratic People's Republic of Korea, Yemen and FATF blacklisted countries.
Making transactions on financial markets with marginal financial instruments opens up wide possibilities and allows investors who are willing to take risks to earn high profits, carrying a potentially high risk of losses at the same time. Therefore you should responsibly approach the issue of choosing the appropriate investment strategy, taking the available resources into account, before starting trading.
Use of the information: full or partial use of materials from this website must always be referenced to TeleTrade as the source of information. Use of the materials on the Internet must be accompanied by a hyperlink to teletrade.org. Automatic import of materials and information from this website is prohibited.
Please contact our PR department if you have any questions or need assistance at pr@teletrade.global.
transfers