- Analytics
- News and Tools
- Market News
CFD Markets News and Forecasts — 14-11-2018
| Time | Country | Event | Period | Previous value | Forecast |
|---|---|---|---|---|---|
| 00:30 | Australia | Changing the number of employed | October | 5.6 | 20 |
| 00:30 | Australia | Unemployment rate | October | 5% | 5.1% |
| 01:00 | Australia | Consumer Inflation Expectation | November | 4% | |
| 09:30 | United Kingdom | Retail Sales (YoY) | October | 3% | 3% |
| 09:30 | United Kingdom | Retail Sales (MoM) | October | -0.8% | 0.2% |
| 10:00 | Eurozone | Trade balance unadjusted | September | 11.7 | |
| 12:15 | Eurozone | ECB's Benoit Coeure Speaks | |||
| 13:10 | Eurozone | ECB's Peter Praet Speaks | |||
| 13:30 | U.S. | Continuing Jobless Claims | November | 1623 | 1630 |
| 13:30 | U.S. | Retail Sales YoY | October | 4.7% | |
| 13:30 | U.S. | Retail sales excluding auto | October | -0.1% | 0.5% |
| 13:30 | U.S. | Retail sales | October | 0.1% | 0.5% |
| 13:30 | U.S. | NY Fed Empire State manufacturing index | November | 21.1 | 20 |
| 13:30 | U.S. | Import Price Index | October | 0.5% | 0.1% |
| 13:30 | U.S. | Philadelphia Fed Manufacturing Survey | November | 22.2 | 20 |
| 13:30 | U.S. | Initial Jobless Claims | November | 214 | 212 |
| 15:00 | U.S. | Business inventories | September | 0.5% | 0.3% |
| 15:00 | U.S. | FOMC Member Quarles Speaks | |||
| 16:00 | U.S. | Crude Oil Inventories | November | 5.783 | 3.012 |
| 16:00 | U.S. | Fed Chair Powell Speaks | |||
| 18:00 | U.S. | FOMC Member Bostic Speaks | |||
| 21:30 | New Zealand | Business NZ PMI | October | 51.7 |
Major US stock indexes finished trading in the red, as the fall of the conglomerate sector and the health sector offset the support from the growth of the commodity sector.
In addition, investors analyzed inflation data for the United States. The Ministry of Labor reported that the consumer price index rose by 0.3% last month, after rising 0.1% in September. In the 12 months to October, the consumer price index rose 2.5%, rising from 2.3% recorded in September. With the exception of food and energy prices, CPI rose 0.2%. The so-called base CPI rose 0.1% for two consecutive months. Over the 12 months to October, the base consumer price index rose 2.1% after rising 2.2% in September. Economists had forecast that the consumer price index would rise by 0.3%, and the basic consumer price index - by 0.2% in October.
Most of the components of DOW recorded a drop (21 of 30). The Travelers Companies, Inc. shares turned out to be an outsider. (TRV, -2.77%). The growth leader was DowDuPont Inc. (DWDP, + 1.17%).
Most sectors of the S & P finished trading in the red. The largest decline was shown by the conglomerate sector (-0.9%). The commodity sector grew the most (+ 0.6%).
At the time of closing:
Dow 25,080.91 -205.58 -0.81%
S & P 500 2,701.63 -20.55 -0.75%
Nasdaq 100 7,136.39 -64.48 -0.90%
| Time | Country | Event | Period | Previous value | Forecast |
|---|---|---|---|---|---|
| 00:30 | Australia | Changing the number of employed | October | 5.6 | 20 |
| 00:30 | Australia | Unemployment rate | October | 5% | 5.1% |
| 01:00 | Australia | Consumer Inflation Expectation | November | 4% | |
| 09:30 | United Kingdom | Retail Sales (YoY) | October | 3% | 3% |
| 09:30 | United Kingdom | Retail Sales (MoM) | October | -0.8% | 0.2% |
| 10:00 | Eurozone | Trade balance unadjusted | September | 11.7 | |
| 12:15 | Eurozone | ECB's Benoit Coeure Speaks | |||
| 13:10 | Eurozone | ECB's Peter Praet Speaks | |||
| 13:30 | U.S. | Continuing Jobless Claims | November | 1623 | 1630 |
| 13:30 | U.S. | Retail Sales YoY | October | 4.7% | |
| 13:30 | U.S. | Retail sales excluding auto | October | -0.1% | 0.5% |
| 13:30 | U.S. | Retail sales | October | 0.1% | 0.5% |
| 13:30 | U.S. | NY Fed Empire State manufacturing index | November | 21.1 | 20 |
| 13:30 | U.S. | Import Price Index | October | 0.5% | 0.1% |
| 13:30 | U.S. | Philadelphia Fed Manufacturing Survey | November | 22.2 | 20 |
| 13:30 | U.S. | Initial Jobless Claims | November | 214 | 212 |
| 15:00 | U.S. | Business inventories | September | 0.5% | 0.3% |
| 15:00 | U.S. | FOMC Member Quarles Speaks | |||
| 16:00 | U.S. | Crude Oil Inventories | November | 5.783 | 3.012 |
| 16:00 | U.S. | Fed Chair Powell Speaks | |||
| 18:00 | U.S. | FOMC Member Bostic Speaks | |||
| 21:30 | New Zealand | Business NZ PMI | October | 51.7 |
Before the bell: S&P futures +0.51%, NASDAQ futures +0.59%
U.S. stock-index futures rose moderately on Tuesday, the U.S. inflation data showed that consumer prices in October rose in line with expectations, relieving investors’ worries the Fed to tighten policy at a faster-than-expected pace.
Global Stocks:
Index/commodity | Last | Today's Change, points | Today's Change, % |
Nikkei | 21,846.48 | +35.96 | +0.16% |
Hang Seng | 25,654.43 | -138.44 | -0.54% |
Shanghai | 2,632.24 | -22.64 | -0.85% |
S&P/ASX | 5,732.80 | -101.40 | -1.74% |
FTSE | 7,091.38 | +37.62 | +0.53% |
CAC | 5,122.00 | +20.15 | +0.39% |
DAX | 11,539.93 | +67.71 | +0.59% |
Crude | $56.19 | +0.90% | |
Gold | $1,200.30 | -0.09% |
(company / ticker / price / change ($/%) / volume)
3M Co | MMM | 201.28 | 2.91(1.47%) | 691 |
Amazon.com Inc., NASDAQ | AMZN | 1,649.97 | 18.80(1.15%) | 54704 |
Apple Inc. | AAPL | 193.69 | 1.46(0.76%) | 348681 |
AT&T Inc | T | 30.5 | 0.17(0.56%) | 40312 |
Barrick Gold Corporation, NYSE | ABX | 12.39 | -0.04(-0.32%) | 41653 |
Boeing Co | BA | 350.48 | 0.97(0.28%) | 15699 |
Caterpillar Inc | CAT | 126.99 | 1.03(0.82%) | 3948 |
Chevron Corp | CVX | 116.6 | 1.25(1.08%) | 3693 |
Cisco Systems Inc | CSCO | 45.42 | 0.30(0.66%) | 27796 |
Citigroup Inc., NYSE | C | 65.2 | 0.42(0.65%) | 5459 |
Deere & Company, NYSE | DE | 148.06 | 0.83(0.56%) | 1210 |
Exxon Mobil Corp | XOM | 78.86 | 0.86(1.10%) | 7721 |
Facebook, Inc. | FB | 143.29 | 1.13(0.79%) | 55762 |
FedEx Corporation, NYSE | FDX | 225 | 2.49(1.12%) | 391 |
Ford Motor Co. | F | 9.56 | 0.02(0.21%) | 17920 |
Freeport-McMoRan Copper & Gold Inc., NYSE | FCX | 11.3 | 0.05(0.44%) | 12201 |
General Electric Co | GE | 8.65 | 0.04(0.46%) | 344449 |
General Motors Company, NYSE | GM | 36 | 0.07(0.19%) | 300 |
Goldman Sachs | GS | 205.8 | 0.75(0.37%) | 6313 |
Google Inc. | GOOG | 1,038.20 | 2.15(0.21%) | 2684 |
Home Depot Inc | HD | 180.7 | 1.70(0.95%) | 14423 |
Intel Corp | INTC | 47.85 | 0.46(0.97%) | 10914 |
International Business Machines Co... | IBM | 121.31 | 0.47(0.39%) | 3534 |
International Paper Company | IP | 45.39 | -0.01(-0.02%) | 230 |
Johnson & Johnson | JNJ | 144.9 | 0.22(0.15%) | 1005 |
JPMorgan Chase and Co | JPM | 109.55 | -0.04(-0.04%) | 730 |
McDonald's Corp | MCD | 184.7 | 0.69(0.38%) | 2605 |
Merck & Co Inc | MRK | 75 | 0.39(0.52%) | 1679 |
Microsoft Corp | MSFT | 107.39 | 0.91(0.85%) | 37450 |
Procter & Gamble Co | PG | 93.36 | -0.11(-0.12%) | 2098 |
Starbucks Corporation, NASDAQ | SBUX | 67.34 | 0.29(0.43%) | 4399 |
Tesla Motors, Inc., NASDAQ | TSLA | 341.8 | 3.07(0.91%) | 33250 |
The Coca-Cola Co | KO | 49.88 | 0.02(0.04%) | 2245 |
Twitter, Inc., NYSE | TWTR | 32.9 | 0.41(1.26%) | 9729 |
Verizon Communications Inc | VZ | 58.88 | 0.22(0.38%) | 2451 |
Visa | V | 140.83 | 1.11(0.79%) | 4940 |
Wal-Mart Stores Inc | WMT | 103.3 | 0.36(0.35%) | 9010 |
Walt Disney Co | DIS | 117.47 | 0.62(0.53%) | 962 |
Yandex N.V., NASDAQ | YNDX | 28.53 | 0.49(1.75%) | 12503 |
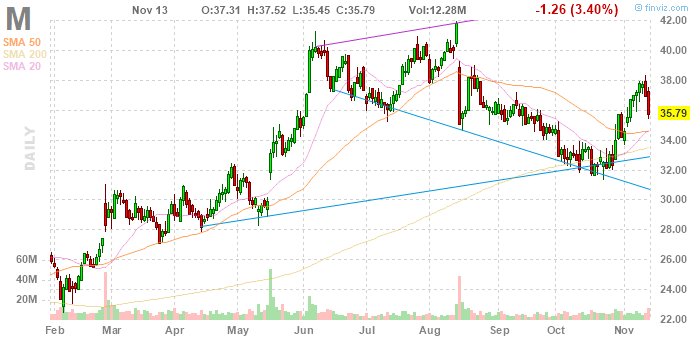
Macy's Inc (M) reported Q3 FY 2018 earnings of $0.27 per share (versus $0.23 in Q3 FY 2017), beating analysts’ consensus estimate of $0.14.
The company’s quarterly revenues amounted to $5.404 bln (+2.3% y/y), generally in-line with analysts’ consensus estimate of $5.403 bln.
M rose to $36.00 (+0.59%) in pre-market trading.
The Consumer Price Index for All Urban Consumers (CPI-U) increased 0.3 percent in October on a seasonally adjusted basis after rising 0.1 percent in September, the U.S. Bureau of Labor Statistics reported today. Over the last 12 months, the all items index rose 2.5 percent before seasonal adjustment.
An increase in the gasoline index was responsible for over one-third of the seasonally adjusted increase in the all items index; advances in the indexes for shelter, used cars and trucks, and electricity also contributed. The increases in the gasoline and electricity indexes led to a 2.4-percent rise in the energy index. The food index, in contrast, declined slightly in October.
The index for all items less food and energy rose 0.2 percent in October following a 0.1-percent increase in September. Along with the indexes for shelter and for used cars and trucks, the indexes for medical care, household furnishings and operations, motor vehicle insurance, and tobacco all increased in October. The indexes for communication, new vehicles, and recreation all declined.
EU Has Received Revised Draft Budget From Italy
In September 2018 compared with August 2018, seasonally adjusted industrial production fell by 0.3% in the euro area (EA19) and by 0.2% in the EU28, according to estimates from Eurostat, the statistical office of the European Union. In August 2018, industrial production rose by 1.1% in the euro area and by 0.8% in the EU28. In September 2018 compared with September 2017, industrial production increased by 0.9% in the euro area and by 1.1% in the EU28.
The number of persons employed increased by 0.2% in both the euro area (EA19) and the EU28 in the third quarter of 2018 compared with the previous quarter, according to a flash estimate published by Eurostat, the statistical office of the European Union. In the second quarter of 2018, employment increased by 0.4% in both the euro area and the EU28. These figures are seasonally adjusted. Compared with the same quarter of the previous year, employment increased by 1.3% in the euro area and by 1.2% in the EU28 in the third quarter of 2018 (after +1.5% and +1.4% respectively in the second quarter of 2018).
Seasonally adjusted GDP rose by 0.2% in the euro area (EA19) and by 0.3% in the EU28 during the third quarter of 2018, compared with the previous quarter, according to a flash estimate published by Eurostat, the statistical office of the European Union. In the second quarter of 2018, GDP had grown by 0.4% in the euro area and by 0.5% in the EU28. Compared with the same quarter of the previous year, seasonally adjusted GDP rose by 1.7% in the euro area and by 1.9% in the EU28 in the third quarter of 2018, after +2.2% and +2.1% respectively in the previous quarter. During the third quarter of 2018, GDP in the United States increased by 0.9% compared with the previous quarter (after +1.0% in the second quarter of 2018). Compared with the same quarter of the previous year, GDP grew by 3.0% (after +2.9% in the previous quarter).
UK house prices rose by 3.5% in the year to September 2018, up from 3.1% in the year to August 2018. On a non-seasonally adjusted basis, average house prices in the UK were unchanged (0.0%) between August 2018 and September 2018, compared with a fall of 0.4% in average prices during the same period a year earlier (August 2017 and September 2017).
House prices grew fastest in the West Midlands region increasing by 6.1% in the year to September 2018, closely followed by the East Midlands which increased by 6.0% over the year. House prices in London fell by 0.3% in the year to September 2018. London house price have been falling over the year since March 2018.
The headline rate of output inflation for goods leaving the factory gate was 3.3% on the year to October 2018, up from 3.1% in September 2018.
The growth rate of prices for materials and fuels used in the manufacturing process slowed to 10.0% on the year to October 2018, from 10.5% in September 2018.
All product groups provided upward contributions to output and input annual inflation, for the second consecutive month.
Petroleum and crude oil provided the largest contribution to both the annual and monthly rates of inflation for output and input inflation respectively.
The Consumer Prices Index including owner occupiers’ housing costs (CPIH) 12-month inflation rate was 2.2% in October 2018, unchanged from September 2018.
The large downward contributions to the change in the 12-month rate from food and non-alcoholic beverages, clothing and footwear, and some transport elements were offset by upward contributions from rising petrol, diesel and domestic gas prices.
Other smaller upward contributions came from items in the miscellaneous goods and services, recreation and culture, and communication sectors.
The Consumer Prices Index (CPI) 12-month rate was 2.4% in October 2018, unchanged from September 2018.
EUR/USD
Resistance levels (open interest**, contracts)
$1.1391 (399)
$1.1369 (663)
$1.1351 (100)
Price at time of writing this review: $1.1296
Support levels (open interest**, contracts):
$1.1250 (4920)
$1.1231 (2317)
$1.1207 (4042)
Comments:
- Overall open interest on the CALL options and PUT options with the expiration date December, 7 is 121016 contracts (according to data from November, 13) with the maximum number of contracts with strike price $1,1200 (6640);
GBP/USD
Resistance levels (open interest**, contracts)
$1.3125 (2011)
$1.3084 (1276)
$1.3052 (618)
Price at time of writing this review: $1.2995
Support levels (open interest**, contracts):
$1.2886 (1298)
$1.2847 (1174)
$1.2824 (2537)
Comments:
- Overall open interest on the CALL options with the expiration date December, 7 is 57462 contracts, with the maximum number of contracts with strike price $1,3100 (5223);
- Overall open interest on the PUT options with the expiration date December, 7 is 45387 contracts, with the maximum number of contracts with strike price $1,2500 (4378);
- The ratio of PUT/CALL was 0.79 versus 0.78 from the previous trading day according to data from November, 13
* - The Chicago Mercantile Exchange bulletin (CME) is used for the calculation.
** - Open interest takes into account the total number of option contracts that are open at the moment.
In October 2018, the Consumer Prices Index (CPI) slightly recovered to +0.1% over a month, after a 0.2% downturn in September. This rebound came from an acceleration in energy prices (+1.8% after +0.9%). Those of services were stable after a 1.5% downturn in September. Manufactured product prices were unchanged too after +1.3% in the previous month. The downturn in fresh food prices (−1.2% after +3.8%) limited the month-on-month global rebound.
Seasonally adjusted, consumer prices rose by 0.1% over a month, as in the two previous months.
Year on year, consumer prices increased by 2.2%, as in September. This stability in inflation resulted from a year-on-year acceleration in services and energy prices, offset by a slowdown in fresh food prices and a little higher decrease in those of manufactured products.
A negative start to trading in the stock markets of Europe is expected, following basically similar tones in Asian funds markets.
The Federal Statistical Office (Destatis) reports that, in the third quarter of 2018, the gross domestic product (GDP) shrank by 0.2% on the second quarter of 2018 after adjustment for price, seasonal and calendar variations. This was the first decline recorded in a quarter-on-quarter comparison since the first quarter of 2015. In the first half of 2018, the GDP had increased, by 0.5% in the second quarter and 0.4% in the first quarter.
The slight quarter-on-quarter decline in the gross domestic product was mainly due to the development of foreign trade. According to provisional calculations, exports were down while imports were up in the third quarter of 2018 compared with the second quarter of the year. As regards domestic demand, there were mixed signals. While gross fixed capital formation both in machinery and equipment and in construction was higher than in the previous quarter, final consumption expenditure of households declined. Government final consumption expenditure was slightly higher than in the previous quarter.
Compared with a year earlier, the price adjusted GDP rose by 1.1% in the third quarter of 2018 (calendar adjusted: +1.1%), following increases of 2.3% in the second quarter (calendar adjusted: +2.0%) and 1.4% in the first quarter of 2018 (calendar adjusted: +2.1%).
Industrial production in China was up 5.9 percent on year in October, rttnews says.
That exceeded expectation for 5.8 percent, which would have been unchanged from the September reading.
The bureau also said that retail sales climbed 8.6 percent on year - missing forecasts for a gain of 9.2 percent, which again would have been unchanged from the previous month.
Fixed asset investment advanced an annual 5.7 percent, surpassing forecasts for 5.5 percent and up from 5.4 percent a month prior.
The headline index remains 1.6% below its July peak but is now more comfortably above the 100 line, indicating optimists outnumber pessimists. Indeed, while confidence may still not be particularly strong, there has been a clear improvement over 2018. November marks the twelfth successive month that optimists have outnumbered pessimists contrasting with the previous twelve months when pessimism held sway for 11 out of 12 reads.
The seasonally adjusted Wage Price Index (WPI) rose 0.6 per cent in September quarter 2018 and 2.3 per cent through the year, according to figures released today by the Australian Bureau of Statistics (ABS).
ABS Chief Economist Bruce Hockman said seasonally adjusted, private sector wages rose 2.1 per cent and public sector wages grew 2.5 per cent, through the year to September quarter 2018.
"There was a higher rate of wage growth recorded across the majority of industries in comparison to this time last year, reflecting the influence of improved labour market conditions," Mr Hockman said. "Annual wage growth at the Australia level was 2.3%, the highest growth rate since September quarter 2015."
In original terms, annual growth to the September quarter 2018 ranged from 1.8 per cent for the Mining and Retail trade industries to 2.8 per cent for the Health care and social assistance industry.
Western Australia recorded the lowest through the year wage growth of 1.8 per cent while Tasmania recorded the highest of 2.6 per cent.
Japan's gross domestic product slipped a seasonally adjusted 0.3 percent on quarter in the third quarter of 2018, according to rttnews.
That was in line with expectations following the 0.7 percent gain in the previous three months.
On an annualized seasonally adjusted basis, GDP tumbled 1.2 percent on year - missing forecasts for a fall of 1.0 percent following the 3.0 percent jump in the three months prior.
Nominal GDP fell 0.3 percent on quarter, matching forecasts following the 0.7 percent increase in Q2.
The GDP deflator fell 0.3 percent on year, missing forecasts for a drop of 0.1 percent following the flat reading in the previous three months.


© 2000-2024. All rights reserved.
This site is managed by Teletrade D.J. LLC 2351 LLC 2022 (Euro House, Richmond Hill Road, Kingstown, VC0100, St. Vincent and the Grenadines).
The information on this website is for informational purposes only and does not constitute any investment advice.
The company does not serve or provide services to customers who are residents of the US, Canada, Iran, The Democratic People's Republic of Korea, Yemen and FATF blacklisted countries.
Making transactions on financial markets with marginal financial instruments opens up wide possibilities and allows investors who are willing to take risks to earn high profits, carrying a potentially high risk of losses at the same time. Therefore you should responsibly approach the issue of choosing the appropriate investment strategy, taking the available resources into account, before starting trading.
Use of the information: full or partial use of materials from this website must always be referenced to TeleTrade as the source of information. Use of the materials on the Internet must be accompanied by a hyperlink to teletrade.org. Automatic import of materials and information from this website is prohibited.
Please contact our PR department if you have any questions or need assistance at pr@teletrade.global.
transfers