- Analytics
- News and Tools
- Market News
CFD Markets News and Forecasts — 10-11-2017
Major US stock indices fell mainly on Friday amid fears that the delay in lowering corporate tax rates to 20% from the current 35% for one year could stop the rally in the stock market.
In addition, according to preliminary research results submitted by Thomson-Reuters and the Michigan Institute, a gauge of sentiment among US consumers fell in November, despite the average predictions of experts. According to the data, in November the consumer sentiment index fell to 97.8 points compared with the final reading for October at the level of 100.7 points. It was expected that the index will remain unchanged, at the level of 100.7 points.
Oil prices fell on Friday, but still remain at a high level, which is the result of efforts by OPEC and Russia to tighten the market by cutting production, as well as strong demand and growing political tensions. Market participants also expect that during the next OPEC meeting on November 30, agreement will be reached on the extension of the pact to cut production, which expires in March 2018. "Obviously, the market remains convinced that OPEC will be able to tighten the market sufficiently by extending its agreement to cut production, so attention is paid to any news that supports this view," said analysts at Commerzbank. "Even much more the weak import of crude oil by China in October and the increase in oil production in the US to a record level did not have any sustained pressure on prices. "
Most components of the DOW index finished trading in the red (21 out of 30). Outsider were shares of Intel Corporation (INTC, -1.56%). The leader of growth was shares of General Electric Company (GE, + 2.80%).
Most sectors of the S & P index recorded a decline. The largest drop was shown by the sector of conglomerates (-1.7%). The services sector grew most (+ 0.3%).
At closing:
Dow -0.17% 23.422.21 -39.73
Nasdaq + 0.01% 6,750.94 +0.89
S & P -0.09% 2,582.30 -2.32
Consumer sentiment declined slightly in early November due to widespread losses across current and expected economic conditions. The losses were quite small as the Sentiment Index remained at its second highest level since January. Overall, the Sentiment Index has remained trendless since the start of the year, varying by less that 4.0 Index-points around its 2017 average of 96.8. Consumers (and policy makers) have four key concerns: prospective trends in jobs, wages, inflation, and interest rates. An improving labor market was spontaneously mentioned by a record number of consumers in early November, and anticipated wage gains recorded their highest two-month level in a decade.
U.S. stock-index futures were lower on Friday, weighed down by fears that a delay in corporate tax cuts by one year may stall the market rally that is partly hinged on the U.S. President Donald Trump's election promise to boost corporate profits and create jobs.
Global Stocks:
Nikkei 22,868.71 -45.11 -0.20%
Nikkei 22,681.42 -187.29 -0.82%
Hang Seng 29,120.92 -15.65 -0.05%
Shanghai 3,433.35 +5.56 +0.16%
S&P/ASX 6,029.37 -20.05 -0.33%
FTSE 7,444.47 -39.63 -0.53%
CAC 5,400.47 -7.28 -0.13%
DAX 13,188.94 +6.38 +0.05%
Crude $57.24 (+0.12%)
Gold $1,284.30 (+0.25%)
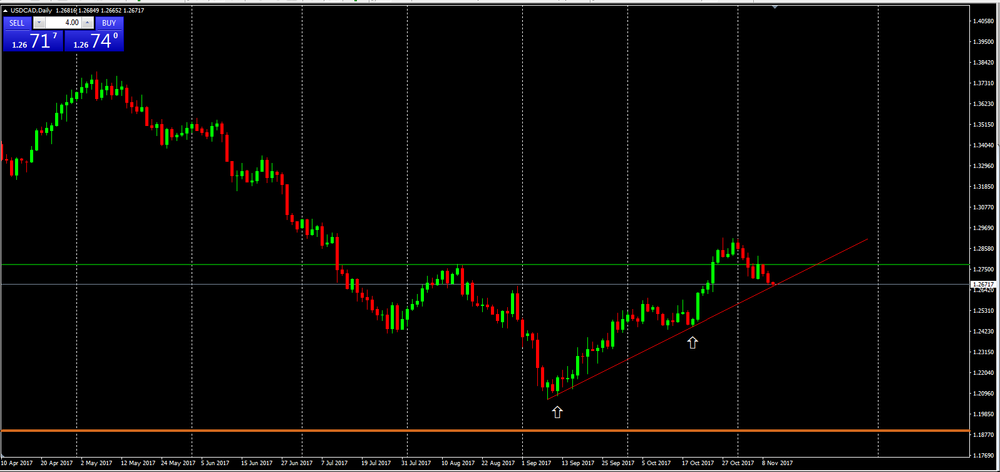
As we can see on daily time frame chart, the price is now close to the upside trend line.
Besides that, we can see as well that, for the 3rdtime, the price is touching the trend line and if it confirms that touch we might see a new bullish movement to new highs or close to the previous one.
However, if the price of Crude Oil still bullish and, until now, there has been no tendency for a slowdown or a reversal of trend.
This correlation between Oil and CAD might help CAD gain strenght against U.S dollar.
Therefore, if the price breaks the upside trend line so we might see a strong depreciation on USD/CAD
(company / ticker / price / change ($/%) / volume)
| Amazon.com Inc., NASDAQ | AMZN | 1,127.37 | -1.76(-0.16%) | 7257 |
| Apple Inc. | AAPL | 175.3 | 0.05(0.03%) | 177498 |
| AT&T Inc | T | 34.19 | 0.19(0.56%) | 51125 |
| Barrick Gold Corporation, NYSE | ABX | 14.12 | 0.01(0.07%) | 6981 |
| Boeing Co | BA | 261.4 | -1.30(-0.49%) | 815 |
| Caterpillar Inc | CAT | 134.25 | -1.09(-0.81%) | 1312 |
| Cisco Systems Inc | CSCO | 33.94 | -0.11(-0.32%) | 4584 |
| Citigroup Inc., NYSE | C | 72.74 | 0.31(0.43%) | 9263 |
| Deere & Company, NYSE | DE | 131.32 | 0.04(0.03%) | 880 |
| Exxon Mobil Corp | XOM | 83.3 | 0.10(0.12%) | 1641 |
| Facebook, Inc. | FB | 178.79 | -0.51(-0.28%) | 45688 |
| Freeport-McMoRan Copper & Gold Inc., NYSE | FCX | 14.75 | 0.03(0.20%) | 642 |
| General Electric Co | GE | 20.03 | 0.04(0.20%) | 120382 |
| Goldman Sachs | GS | 240.88 | 0.09(0.04%) | 1247 |
| Home Depot Inc | HD | 163.5 | 0.23(0.14%) | 947 |
| Intel Corp | INTC | 46.23 | -0.07(-0.15%) | 6452 |
| International Business Machines Co... | IBM | 150.15 | -0.15(-0.10%) | 728 |
| JPMorgan Chase and Co | JPM | 98 | 0.37(0.38%) | 8376 |
| McDonald's Corp | MCD | 166.71 | -0.29(-0.17%) | 1472 |
| Microsoft Corp | MSFT | 83.82 | -0.27(-0.32%) | 13518 |
| Starbucks Corporation, NASDAQ | SBUX | 57.31 | -0.05(-0.09%) | 580 |
| Tesla Motors, Inc., NASDAQ | TSLA | 303.3 | 0.31(0.10%) | 22007 |
| Twitter, Inc., NYSE | TWTR | 19.86 | -0.04(-0.20%) | 35664 |
| Verizon Communications Inc | VZ | 45.08 | 0.01(0.02%) | 5417 |
| Visa | V | 111.84 | -0.30(-0.27%) | 2321 |
| Walt Disney Co | DIS | 105.3 | 2.62(2.55%) | 133357 |
| Yandex N.V., NASDAQ | YNDX | 31.9 | -0.02(-0.06%) | 2000 |
EURUSD: 1.1500-05 (EUR 470m) 1.1515 (300m) 1.1545-50 (1.25bln) 1.1600 (400m) 1.1650 (465m)
USDJPY: 112.50-55 (USD 870m) 113.00 (1.63bln) 113.50 (380m) 114.00 (435m) 115.00-05 (615m) 115.25 (710m)
GBPUSD: 1.2850 (GBP 1.03bln)
EURGBP: 0.8800 (EUR 490m)
USDCHF: 0.9900 (805m) 1.0000 (430m) 1.0040-50 (450m)
AUDUSD: 0.7650 (AUD 320m)
EURJPY: 132.00 (EUR 540m)
USDCAD: 1.2695-1.2700 (335m)
AUDJPY: 86.25 (AUD 375m)
AUDNZD: 1.1070 (AUD 320m)
AUDCAD: 0.9820 (AUD 235m)
Walt Disney (DIS) reiterated with a Hold rating at Needham
Walt Disney (DIS) reiterated with a Neutral rating at B. Riley FBR; target raised to $101 from $97
Walt Disney (DIS) reiterated with a Top Pick rating at RBC Capital Mkts; target $125
"Our monthly estimates of GDP suggest that output expanded by 0.5 per cent in the three months to October, slightly stronger than the official outturn for the third quarter of 2017 which was 0.4 per cent. The monthly estimate is closely tracking our forecast for real GDP growth for the final quarter of this year which also stands at 0.5 per cent".
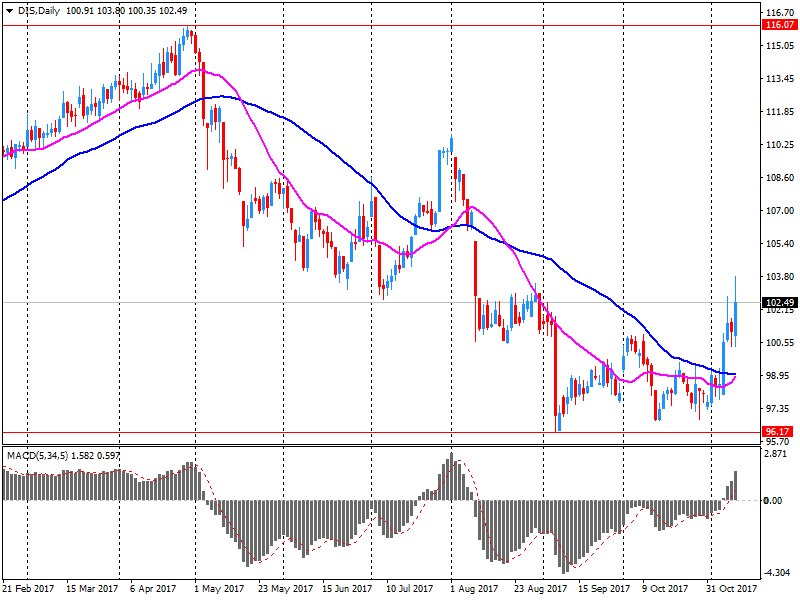
Disney (DIS) reported Q4 FY 2017 earnings of $1.07 per share (versus $1.10 in Q4 FY 2016), missing analysts' consensus estimate of $1.12.
The company's quarterly revenues amounted to $12.779 bln (-2.8% y/y), missing analysts' consensus estimate of $13.295 bln.
DIS rose to $103.00 (+0.31%) in pre-market trading.
-
Asked if Ireland might veto move to phase 2 of brexit talks, says talk of individual countries vetoing 'not helpful at this stage'
EUR/USD: 1.1500-05(470 m), 1.1515(299 m), 1.1545-50(1.25 b), 1.1600(400 m), 1.1650(465 m)
GBP/USD: 1.2850(1.03 b)
USD/JPY: 112.50-55(869 m), 113.00(1.63 b), 113.50(378 m), 114.00(435 m), 115.00-05(611 m), 115.25(710 m)
USD/CHF: 0.9900(805 m), 10000(430 m), 1.0040-50(450 m)
AUD/USD: 0.7650(319 m)
USD/CAD: 1.2695-1.2700(334 m)
EUR/GBP: 0.8800(486 m)
EUR/JPY: 132.00(540 m)
In the three months to September 2017, the total UK trade (goods and services) deficit widened by £3.0 billion to £9.5 billion; this was largely due to an increase in imports of goods, primarily due to increased imports of machinery, unspecified goods (including non-monetary gold) and fuels, partially offset by a decrease in imports of aircraft.
Imports of goods from both EU and non-EU countries increased between the three months to June 2017 and the three months to September 2017; exports to EU countries increased by £0.9 billion, while exports to non-EU countries fell by £1.7 billion in the same period.
The UK's total trade deficit (goods and services) narrowed by £0.7 billion between August and September 2017; this was primarily due to increased exports of unspecified goods (including non-monetary gold).
In the three months to September 2017, the Index of Production was estimated to have increased by 1.1% compared with the three months to June 2017, due mainly to a rise of 1.1% in manufacturing.
The largest contribution to the rise in manufacturing in the three months to September 2017 came from transport equipment, which rose by 3.0% followed by other manufacturing and repair, which rose by 4.4%.
In September 2017, total production was estimated to have increased by 0.7% compared with August 2017, due mainly to a rise of 0.7% in manufacturing, with the largest upward contribution from machinery and equipment not elsewhere classified and smaller increases from a range of other industries.
Total production output for September 2017 compared with September 2016 increased by 2.5%, with manufacturing providing the largest upward contribution, increasing by 2.7%; this was supported by rises in the other three main sectors.
-
Entry of foreign retailers to constrain retail inflation
-
Forecasts cpi inflation at 2 pct to june2018, then 2.25 pct to dec 2019
-
Unemployment rate at 5.5 pct out to june 2019, 5.25 pct by dec 2019
-
Household consumption likely slowed in q3, constrained by slow income growth and high debt
-
Further rise in AUD would slow pick up in economic growth, inflation
-
Revises up outlook for jobs growth, leading indicators point to solid growth over next 6 months
-
Housing market has eased nationally, Sydney has slowed noticeably
In Q3 2017, private payroll employment slowed down softly : +0.2%, after +0.4%, that is +29,700 jobs after +81,500. Year on year, private payroll employment increased by +1.3% (that is +240,900 jobs). Excluding temporary employment, it increased over the quarter by +0.2% (that is +28,200 jobs) and by +0.8% over the year (+152,800 jobs).
Private payroll employment was almost stable in industry (−0.1%, −3,600 jobs) and in agriculture. It continued to increase strongly in construction (+0.5%, that is +6,700 jobs, after 0.4%). Year on year, private employment dipped by 15,700 in industry whereas it increased by 18,100 in construction.
In Q3 2017, in market services, private employment slowed down: +0.3% (that is +31,000 jobs), after +0.6%. Excluding temporary employment, the slowdown is less pronounced: +0.3%, after +0.4%. Private employment in non-market services decreased by 0.2% over the quarter (after +0.2% in the previous quarter) but increased over a year (+0.5%, that is +12,500 jobs).
In September 2017, output bounced back slightly in the manufacturing industry (+0.4% after −0.3% in August) and in the whole industry (+0.6% after −0.2%).
Over the third quarter of 2017, output increased in the manufacturing industry (+0.6%) as well as in the overall industry (+0.6%).
Output grew strongly in the manufacture of transport equipment (+4.8%). It went up in mining and quarrying, energy, water supply (+1.0%) and more moderately in "other manufacturing" (+0.2%). It remained stable in the manufacture of food products and beverages. Conversely, it decreased in the manufacture of machinery and equipment goods (−0.9%) and in the manufacture of coke and refined petroleum products (−2.1%).
EUR/USD
Resistance levels (open interest**, contracts)
$1.1765 (5284)
$1.1718 (1417)
$1.1683 (761)
Price at time of writing this review: $1.1636
Support levels (open interest**, contracts):
$1.1581 (5673)
$1.1552 (8200)
$1.1517 (5972)
Comments:
- Overall open interest on the CALL options and PUT options with the expiration date December, 8 is 150413 contracts (according to data from November, 9) with the maximum number of contracts with strike price $1,1600 (8200);
GBP/USD
Resistance levels (open interest**, contracts)
$1.3268 (1924)
$1.3216 (657)
$1.3185 (616)
Price at time of writing this review: $1.3123
Support levels (open interest**, contracts):
$1.3097 (1108)
$1.3052 (1399)
$1.3023 (2716)
Comments:
- Overall open interest on the CALL options with the expiration date December, 8 is 39752 contracts, with the maximum number of contracts with strike price $1,3200 (3211);
- Overall open interest on the PUT options with the expiration date December, 8 is 38612 contracts, with the maximum number of contracts with strike price $1,3000 (4775);
- The ratio of PUT/CALL was 0.97 versus 0.95 from the previous trading day according to data from November, 9
* - The Chicago Mercantile Exchange bulletin (CME) is used for the calculation.
** - Open interest takes into account the total number of option contracts that are open at the moment.
European stocks posted sharp declines by Thursday's market close, as a string of corporate earnings triggered negative moves across sectors and bourses. The pan-European Stoxx 600 closed sharply lower, down 1.11 percent provisionally on Thursday, with all sectors and major bourses ending in negative territory.
U.S. stocks closed lower Thursday in their worst session in two weeks with the Dow snapping a seven-day win streak on worries over a possible delay in much-anticipated corporate tax cut. However, main indexes trimmed losses after the House Ways and Committee approved a bill to overhaul the tax code, setting up a vote by the full House.
Global equities remained under selling pressure on Friday with Japan's benchmark index leading declines in Asia, tracking overnight weakness on Wall Street on concerns over the U.S. tax-overhaul plan. Key U.S. stock indexes slid as the U.S. Senate's plan to push through a different tax proposal than what the House of Representatives released last week caused some investors to question the Republicans' ability to get a bill through to the White House.


© 2000-2024. All rights reserved.
This site is managed by Teletrade D.J. LLC 2351 LLC 2022 (Euro House, Richmond Hill Road, Kingstown, VC0100, St. Vincent and the Grenadines).
The information on this website is for informational purposes only and does not constitute any investment advice.
The company does not serve or provide services to customers who are residents of the US, Canada, Iran, The Democratic People's Republic of Korea, Yemen and FATF blacklisted countries.
Making transactions on financial markets with marginal financial instruments opens up wide possibilities and allows investors who are willing to take risks to earn high profits, carrying a potentially high risk of losses at the same time. Therefore you should responsibly approach the issue of choosing the appropriate investment strategy, taking the available resources into account, before starting trading.
Use of the information: full or partial use of materials from this website must always be referenced to TeleTrade as the source of information. Use of the materials on the Internet must be accompanied by a hyperlink to teletrade.org. Automatic import of materials and information from this website is prohibited.
Please contact our PR department if you have any questions or need assistance at pr@teletrade.global.
transfers