- Analytics
- News and Tools
- Market News
CFD Markets News and Forecasts — 10-10-2018
| Raw materials | Closing price | % change |
| Oil | $72.63 | -3.11% |
| Gold | $1,197.50 | +0.50% |
| Index | Change items | Closing price | % change |
| Nikkei | +36.65 | 23506.04 | +0.16% |
| TOPIX | +2.74 | 1763.86 | +0.16% |
| CSI 300 | -7.09 | 3281.60 | -0.22% |
| KOSPI | -25.22 | 2228.61 | -1.12% |
| FTSE 100 | -91.85 | 7145.74 | -1.27% |
| DAX | -264.72 | 11712.50 | -2.21% |
| CAC 40 | -112.33 | 5206.22 | -2.11% |
| DJIA | -831.83 | 25598.74 | -3.15% |
| S&P 500 | -94.66 | 2785.68 | -3.29% |
| NASDAQ | -315.96 | 7422.05 | -4.08% |
| Pare | Closed | % change |
| EUR/USD | $1,1526 | +0,30% |
| GBP/USD | $1,3196 | +0,42% |
| USD/CHF | Chf0,98912 | -0,27% |
| USD/JPY | Y112,26 | -0,62% |
| EUR/JPY | Y129,40 | -0,32% |
| GBP/JPY | Y148,155 | -0,19% |
| AUD/USD | $0,7056 | -0,66% |
| NZD/USD | $0,6461 | -0,22% |
| USD/CAD | C$1,30478 | +0,81% |
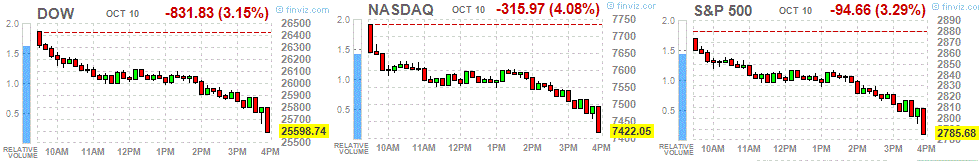
Major US stock indexes have fallen significantly, as concerns about China and the impact of higher Treasury bond yields on global growth led to a fall in luxury companies and microchip manufacturers.
The focus of market participants was also data on the United States. According to a report by the Department of Labor, US producer prices rose 0.2% in September, which followed an unexpected decline in August and was in line with expectations. The rise in prices for services outweighed a slight drop in commodity prices. In August, the final demand price index fell by 0.1%. For 12 months to September, the producer price index rose by 2.6%, which is slightly less than expected. Economists had forecast a PPI growth of 0.2% for the month and an increase of 2.8% on an annualized basis. Last month, a key indicator of producer prices, which excludes services in the field of food, energy and trade, grew by 0.4%, which is the largest increase since January. For 12 months to September, the main PPI rose by 2.9%, as in the previous month.
In addition, as it became known, wholesale inventories in the US grew slightly more than originally estimated in August. The Commerce Department reported that wholesale inventories rose 1.0% instead of the 0.8% originally reported last month. Stocks rose 5.3% over the same period last year. The component of wholesale inventories, which is included in the calculation of gross domestic product growth, rose by 0.7% in August.
All DOW components recorded a decline (30 out of 30). Outsiders were NIKE, Inc. shares. (NKE, -6.81%).
All sectors of the S & P finished trading in the red. The largest decline was shown by the technology sector (-3.9%)
At the time of closing:
Dow 25,598.74 -831.83 -3.15%
S & P 500 2,785.68 -94.66 -3.29%
Nasdaq 100 7,422.05 -315.97 -4.08%
Total inventories of merchant wholesalers, except manufacturers' sales branches and offices, after adjustment for seasonal variations but not for price changes, were $642.7 billion at the end of August, up 1.0 percent from the revised July level. Total inventories were up 5.3 percent from the revised August 2017 level. The July 2018 to August 2018 percent change was revised from the advance estimate of up 0.8 percent to up 1.0 percent.
The August inventories/sales ratio for merchant wholesalers, except manufacturers' sales branches and offices, based on seasonally adjusted data, was 1.26. The August 2017 ratio was 1.30.
Latest economic data confirms that the UK economy has recovered from a soft patch earlier in the year and is now growing at a pace that is well above potential. According to new ONS statistics published this morning, the UK economy expanded by 0.7 per cent in the 3 months to August after growing by 0.4 per cent in the second quarter (three months to June).
The outturn was slightly higher than the 0.6 per cent monthly GDP forecast that we published last month for the same period and the error is partly because of back data revisions. Building on the official data, our monthly GDP Tracker suggests that the economy will expand by 0.7 per cent in the third quarter and by 0.5 per cent in the final quarter of this year.
The biggest surprise was from the production sector and, in particular, manufacturing output which expanded by 0.8 per cent. This strength was across the board and the outturn was above our forecast for the same period, partly because of changes to the back data.
U.S. stock-index futures fell on Wednesday amid lingering concerns about rising interest rates and slowing global growth.
Global Stocks:
| Index/commodity | Last | Today's Change, points | Today's Change, % |
| Nikkei | 23,506.04 | +36.65 | +0.16% |
| Hang Seng | 26,193.07 | +20.16 | +0.08% |
| Shanghai | 2,725.84 | +4.82 | +0.18% |
| S&P/ASX | 6,049.80 | +8.70 | +0.14% |
| FTSE | 7,222.57 | -15.02 | -0.21% |
| CAC | 5,269.33 | -49.22 | -0.93% |
| DAX | 11,877.18 | -100.04 | -0.84% |
| Crude | $74.59 | | -0.49% |
| Gold | $1,189.20 | | -0.19% |
Wall Street. Stocks before the bell
(company / ticker / price / change ($/%) / volume)
| 3M Co | MMM | 210.01 | -0.41(-0.19%) | 428 |
| ALCOA INC. | AA | 37.4 | -0.24(-0.64%) | 3217 |
| ALTRIA GROUP INC. | MO | 63.24 | 0.14(0.22%) | 2181 |
| Amazon.com Inc., NASDAQ | AMZN | 1,863.59 | -6.73(-0.36%) | 30699 |
| Apple Inc. | AAPL | 225.84 | -1.03(-0.45%) | 164305 |
| AT&T Inc | T | 33.53 | 0.03(0.09%) | 24039 |
| Barrick Gold Corporation, NYSE | ABX | 11.2 | -0.12(-1.06%) | 47039 |
| Boeing Co | BA | 382.75 | -2.69(-0.70%) | 4594 |
| Caterpillar Inc | CAT | 148.51 | -0.95(-0.64%) | 1912 |
| Chevron Corp | CVX | 126.81 | -0.01(-0.01%) | 6146 |
| Cisco Systems Inc | CSCO | 47.31 | -0.18(-0.38%) | 1754 |
| Exxon Mobil Corp | XOM | 86.5 | -0.01(-0.01%) | 1508 |
| Facebook, Inc. | FB | 157.34 | -0.56(-0.35%) | 70641 |
| Freeport-McMoRan Copper & Gold Inc., NYSE | FCX | 12.89 | -0.29(-2.20%) | 54335 |
| General Electric Co | GE | 13.36 | -0.19(-1.40%) | 373453 |
| General Motors Company, NYSE | GM | 32.6 | -0.05(-0.15%) | 3540 |
| Google Inc. | GOOG | 1,132.50 | -6.32(-0.56%) | 3632 |
| Hewlett-Packard Co. | HPQ | 24.93 | -0.04(-0.16%) | 1010 |
| Home Depot Inc | HD | 197.89 | 2.14(1.09%) | 11302 |
| Intel Corp | INTC | 46 | -0.55(-1.18%) | 79322 |
| International Business Machines Co... | IBM | 147.11 | -0.13(-0.09%) | 251 |
| International Paper Company | IP | 45 | 0.36(0.81%) | 28752 |
| JPMorgan Chase and Co | JPM | 114.45 | -0.07(-0.06%) | 13227 |
| McDonald's Corp | MCD | 171.38 | 1.55(0.91%) | 11249 |
| Merck & Co Inc | MRK | 72.35 | 0.01(0.01%) | 437 |
| Microsoft Corp | MSFT | 111.84 | -0.42(-0.37%) | 29607 |
| Pfizer Inc | PFE | 45.6 | 0.13(0.29%) | 1501 |
| Procter & Gamble Co | PG | 81.87 | -0.33(-0.40%) | 6920 |
| Starbucks Corporation, NASDAQ | SBUX | 57.68 | -0.03(-0.05%) | 29910 |
| Tesla Motors, Inc., NASDAQ | TSLA | 264.26 | 1.46(0.56%) | 74723 |
| The Coca-Cola Co | KO | 46.46 | 0.07(0.15%) | 1351 |
| Travelers Companies Inc | TRV | 133 | 1.41(1.07%) | 4760 |
| Twitter, Inc., NYSE | TWTR | 29.12 | -0.15(-0.51%) | 39507 |
| United Technologies Corp | UTX | 135.56 | -0.32(-0.24%) | 187 |
| UnitedHealth Group Inc | UNH | 270.75 | 0.64(0.24%) | 243 |
| Verizon Communications Inc | VZ | 55 | 0.01(0.02%) | 3792 |
| Visa | V | 142.06 | -0.25(-0.18%) | 6552 |
| Wal-Mart Stores Inc | WMT | 97.02 | -0.06(-0.06%) | 2103 |
| Walt Disney Co | DIS | 117.1 | 0.21(0.18%) | 645 |
| Yandex N.V., NASDAQ | YNDX | 33.35 | 0.02(0.06%) | 1500 |
Analyst coverage initiations before the market open
Freeport-McMoRan (FCX) initiated with a Underweight at Barclays; target $12
The Producer Price Index for final demand increased 0.2 percent in September, seasonally adjusted, the U.S. Bureau of Labor Statistics reported today. Final demand prices declined 0.1 percent in August and were unchanged in July. On an unadjusted basis, the final demand index advanced 2.6 percent for the 12 months ended in September.
In September, the rise in the final demand index can be traced to a 0.3-percent increase in prices for final demand services. In contrast, the index for final demand goods decreased 0.1 percent.
The index for final demand less foods, energy, and trade services moved up 0.4 percent in September, the largest rise since a 0.5-percent increase in January. For the 12 months ended in September, prices for final demand less foods, energy, and trade services advanced 2.9 percent.
Strength in the non-residential sector drove the increase, while the residential sector declined for the third consecutive month.
n the non-residential sector, $3.2 billion worth of permits were issued in August, up 8.8% from the previous month. Both the institutional (+25.8%) and commercial (+8.9%) components contributed to the gain, which was largely the result of the issuance of permits for a new hospital in Ontario and new office buildings in British Columbia.
Meanwhile, the value of industrial permits fell 5.9% in August to $677 million. This followed a 13.4% gain in July, as multiple permits were issued that month for transportation terminals and manufacturing structures in Ontario and Alberta.
The total UK trade deficit (goods and services) narrowed £4.7 billion to £2.8 billion in the three months to August 2018.
Removing the effect of inflation, the total trade deficit narrowed £6.1 billion to £0.8 billion in the three months to August 2018.
A £3.5 billion narrowing of the goods deficit plus a £1.1 billion widening of the services surplus led to the £4.7 billion narrowing of the trade deficit in the three months to August 2018.
The narrowing goods deficit was due mostly to falling imports of unspecified goods (including non-monetary gold) and rising fuels exports in the three months to August 2018.
The trade in goods deficit narrowed £2.4 billion with the EU and £1.1 billion with countries outside the EU in the three months to August 2018.
In the 12 months to August 2018, the total trade deficit narrowed £13.5 billion due to rises in exports for goods and services that were partially offset by corresponding rises in imports.
Construction output continued to recover following a relatively weak start to the year, increasing by 2.9% in the three months to August 2018.
The three-month on three-month growth in August 2018 was driven by both repair and maintenance and all new work which increased by 2.8% and 2.9% respectively.
Construction output declined by 0.7% between July and August 2018, driven by falls in both repair and maintenance and all new work which decreased by 0.6% and 0.8% respectively.
In the three months to August 2018, services output increased by 0.5% compared with the three months ending May 2018.
The wholesale, retail and motor trade sector made the largest contribution to the three-month on three-month growth for the fourth consecutive month, contributing 0.21 percentage points.
The Index of Services was flat between July 2018 and August 2018.
Month-on-month growth in the information and communication sector was partially offset by a fall in accommodation and food services.
In the three months to August 2018, services output increased by 1.6% compared with the three months ending August 2017.
The rise of 0.7% in total production output for the three months to August 2018, compared with the three months to May 2018, is due primarily to a rise of 0.8% in manufacturing, which displays widespread strength throughout the sector with 10 of the 13 sub-sectors increasing.
The three-monthly increase in manufacturing output is due primarily to strength from pharmaceutical products (3.3%), food, beverages and tobacco (1.5%), and rubber and plastic products (2.1%).
In August 2018, total production output was estimated to have increased by 0.2% compared with July 2018, due primarily to rises in electricity and gas supply of 1.8% and mining and quarrying of 2.1%.
Commenting on today's GDP figures, Head of GDP Rob Kent-Smith said:
"The economy continued to rebound strongly after a weak spring, with retail, food and drink production and housebuilding all performing particularly well during the hot summer months. However, long-term growth continues to lag behind its historical trend."
The services sector had a rolling three-month growth of 0.5%, resulting in a large positive contribution to headline GDP growth. The production industries and construction also had positive contributions to GDP growth, with rolling three-month growths of 0.7% and 2.9%, respectively.
The percentage change of the average of the last three months with respect to the previous three months was -0.2.
The calendar adjusted industrial production index decreased by 0.8% compared with August 2017 (calendar working days in August 2018 being the same as in August 2017); in the period January- August 2018 the percentage change was +1.8 compared with the same period of 2017.
The unadjusted industrial production index decreased by 0.8% compared with August 2017.
This month's small gain follows a 5.2% fall through August and September. During that period the boost from the tax cuts announced in the May budget had faded while the leadership change; mortgage rate increases; declining house prices and rising petrol prices were weighing on confidence. It is encouraging that these negatives seem to have, at least for the time being, run their course. Several positives have likely helped stabilise the Index, including strong economic growth, a solid labour market and ongoing recoveries in the previously weak mining states.
-
Hopeful Preferred Rate Path Won't Invert Yield Curve
-
Unclear if Yield Curve Moving Away From Inversion
-
Inversions Hurt Economy by Upending Credit Allocation
It slowed down in the whole industry (+0.3% after +0.8%).
Manufacturing output accelerated over the last three months (+1.1%), as well as in the whole industry (+1.0%).
Over the last three months, output increased strongly in the manufacture of transport equipment (+4.7%), and in the manufacture of coke and refined petroleum products (+13.7%). It also increased in "other manufacturing" (+0.6%), in mining and quarrying, energy, water supply (+0.7%) and in the manufacture of machinery and equipment goods (+0.4%). Conversely, it diminished in the manufacture of food products and beverages (−1.2%).
EUR/USD
Resistance levels (open interest**, contracts)
$1.1658 (988)
$1.1637 (406)
$1.1620 (94)
Price at time of writing this review: $1.1501
Support levels (open interest**, contracts):
$1.1452 (3157)
$1.1423 (2712)
$1.1390 (2868)
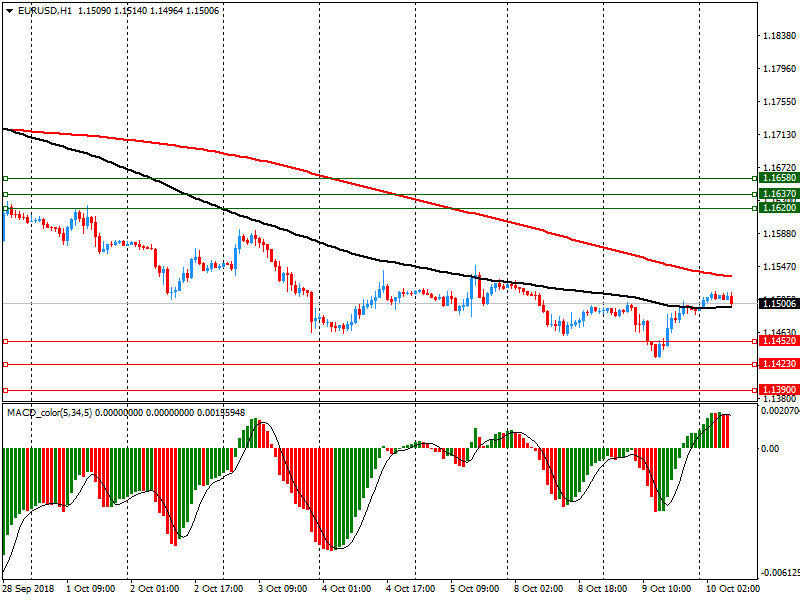
Comments:
- Overall open interest on the CALL options and PUT options with the expiration date November, 19 is 76203 contracts (according to data from October, 9) with the maximum number of contracts with strike price $1,1600 (4584);
GBP/USD
Resistance levels (open interest**, contracts)
$1.3295 (1059)
$1.3264 (799)
$1.3241 (388)
Price at time of writing this review: $1.3171
Support levels (open interest**, contracts):
$1.3094 (130)
$1.3073 (296)
$1.3049 (557)
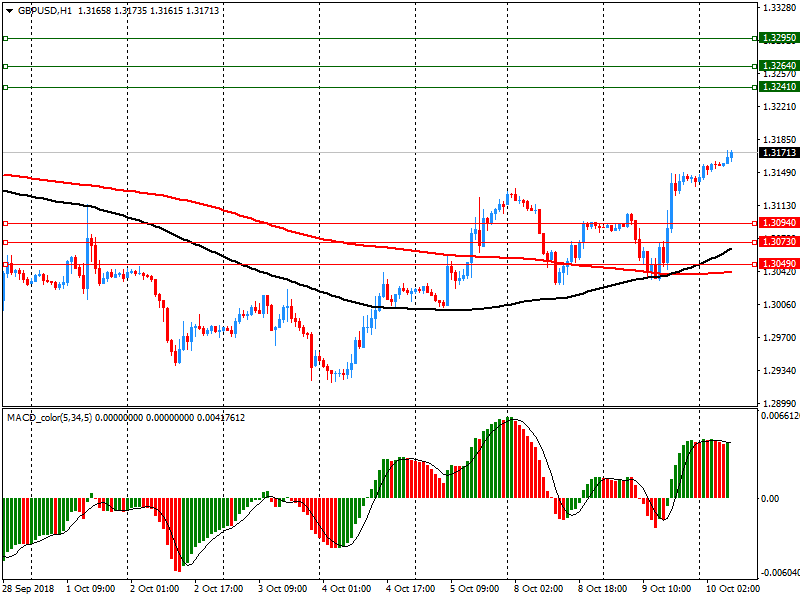
Comments:
- Overall open interest on the CALL options with the expiration date November, 19 is 20100 contracts, with the maximum number of contracts with strike price $1,3200 (2296);
- Overall open interest on the PUT options with the expiration date November, 19 is 24125 contracts, with the maximum number of contracts with strike price $1,3000 (2060);
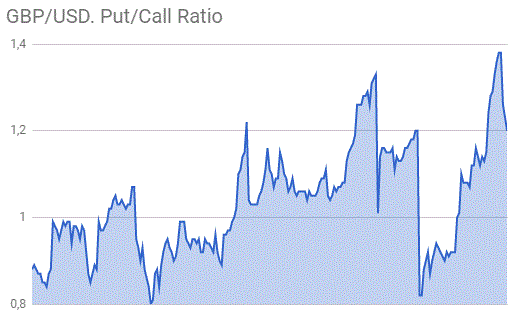
- The ratio of PUT/CALL was 1.20 versus 1.23 from the previous trading day according to data from October, 9.
* - The Chicago Mercantile Exchange bulletin (CME) is used for the calculation.
** - Open interest takes into account the total number of option contracts that are open at the moment.


© 2000-2024. All rights reserved.
This site is managed by Teletrade D.J. LLC 2351 LLC 2022 (Euro House, Richmond Hill Road, Kingstown, VC0100, St. Vincent and the Grenadines).
The information on this website is for informational purposes only and does not constitute any investment advice.
The company does not serve or provide services to customers who are residents of the US, Canada, Iran, The Democratic People's Republic of Korea, Yemen and FATF blacklisted countries.
Making transactions on financial markets with marginal financial instruments opens up wide possibilities and allows investors who are willing to take risks to earn high profits, carrying a potentially high risk of losses at the same time. Therefore you should responsibly approach the issue of choosing the appropriate investment strategy, taking the available resources into account, before starting trading.
Use of the information: full or partial use of materials from this website must always be referenced to TeleTrade as the source of information. Use of the materials on the Internet must be accompanied by a hyperlink to teletrade.org. Automatic import of materials and information from this website is prohibited.
Please contact our PR department if you have any questions or need assistance at pr@teletrade.global.
transfers