- Analytics
- News and Tools
- Market News
CFD Markets News and Forecasts — 05-10-2018
U.S. stock-index futures were flat on Friday, as investors assessed the September jobs report.
Global Stocks:
| Index/commodity | Last | Today's Change, points | Today's Change, % |
| Nikkei | 23,783.72 | -191.90 | -0.80% |
| Hang Seng | 26,572.57 | -51.30 | -0.19% |
| Shanghai | - | - | - |
| S&P/ASX | 6,185.50 | +9.20 | +0.15% |
| FTSE | 7,345.14 | -73.20 | -0.99% |
| CAC | 5,375.10 | -35.75 | -0.66% |
| DAX | 12,130.10 | -114.04 | -0.93% |
| Crude | $74.58 | | +0.34% |
| Gold | $1,208.00 | | +0.53% |
The US dollar jumped up and then down after the latest batch of US labor market data, which came out below market expectations.
The key non-farm payroll number slipped to 134,000, while the market had expected 185,000, however, the August number was revised significantly higher from 201,000 to 270,000. In addition, wage growth also slowed, albeit marginally to 2.8% year-on-year from 2.9% in the previous month.
The unemployment rate dropped to 48-year lows to 3.7% and the participation rate remained at 62.7%.
Due to the big NFP revision traders were a bit confused how to trade these results and therefore the big zig-zag movement occurred. US yields remained higher, which imply that the US dollar could end the day stronger, while stocks were neutral-to-positive. All will depend how Wall Street will react on these numbers.
The Fed will stay on track to raise rates in December and we will probably see another 3 to 4 hikes in 2019, which should keep the US dollar supported.
Wall Street. Stocks before the bell
(company / ticker / price / change ($/%) / volume)
| ALCOA INC. | AA | 42.9 | -0.21(-0.49%) | 2397 |
| ALTRIA GROUP INC. | MO | 61.7 | -0.08(-0.13%) | 1415 |
| Amazon.com Inc., NASDAQ | AMZN | 1,898.05 | -11.37(-0.60%) | 88349 |
| Apple Inc. | AAPL | 227.25 | -0.74(-0.32%) | 249929 |
| AT&T Inc | T | 34.15 | 0.03(0.09%) | 45743 |
| Barrick Gold Corporation, NYSE | ABX | 11.5 | -0.15(-1.29%) | 120792 |
| Boeing Co | BA | 390 | 0.01(0.00%) | 7715 |
| Caterpillar Inc | CAT | 156.77 | 0.02(0.01%) | 1566 |
| Chevron Corp | CVX | 125 | 0.05(0.04%) | 546 |
| Cisco Systems Inc | CSCO | 48.15 | -0.23(-0.48%) | 19514 |
| Citigroup Inc., NYSE | C | 72.81 | 0.19(0.26%) | 14736 |
| Deere & Company, NYSE | DE | 157.75 | -0.56(-0.35%) | 2847 |
| Facebook, Inc. | FB | 158.4 | -0.45(-0.28%) | 118524 |
| FedEx Corporation, NYSE | FDX | 238.5 | -0.57(-0.24%) | 1200 |
| Freeport-McMoRan Copper & Gold Inc., NYSE | FCX | 13.35 | -0.28(-2.05%) | 61006 |
| General Electric Co | GE | 12.68 | 0.02(0.16%) | 53144 |
| General Motors Company, NYSE | GM | 34.19 | -0.06(-0.18%) | 5773 |
| Goldman Sachs | GS | 228.19 | 0.71(0.31%) | 1716 |
| Google Inc. | GOOG | 1,166.04 | -2.15(-0.18%) | 4815 |
| Hewlett-Packard Co. | HPQ | 25.75 | -0.67(-2.54%) | 8763 |
| Home Depot Inc | HD | 199 | 0.15(0.08%) | 8829 |
| Intel Corp | INTC | 47.96 | -0.17(-0.35%) | 96582 |
| International Business Machines Co... | IBM | 151.56 | 0.25(0.17%) | 6509 |
| JPMorgan Chase and Co | JPM | 115.35 | 0.08(0.07%) | 7288 |
| McDonald's Corp | MCD | 165.9 | 0.10(0.06%) | 215 |
| Microsoft Corp | MSFT | 112.05 | -0.74(-0.66%) | 64037 |
| Nike | NKE | 80.35 | 0.17(0.21%) | 13249 |
| Pfizer Inc | PFE | 44.55 | -0.15(-0.34%) | 6296 |
| Starbucks Corporation, NASDAQ | SBUX | 55.84 | -0.05(-0.09%) | 963 |
| Tesla Motors, Inc., NASDAQ | TSLA | 273.58 | -8.25(-2.93%) | 179798 |
| The Coca-Cola Co | KO | 45.8 | -0.05(-0.11%) | 451 |
| Twitter, Inc., NYSE | TWTR | 28.07 | -0.16(-0.57%) | 32812 |
| Verizon Communications Inc | VZ | 55 | -0.02(-0.04%) | 924 |
| Visa | V | 146.35 | -0.41(-0.28%) | 11396 |
| Wal-Mart Stores Inc | WMT | 93.89 | -0.32(-0.34%) | 3714 |
| Walt Disney Co | DIS | 115.77 | -0.36(-0.31%) | 1470 |
| Yandex N.V., NASDAQ | YNDX | 31.81 | -0.50(-1.55%) | 3371 |
The U.S. Census Bureau and the U.S. Bureau of Economic Analysis announced today that the goods and services deficit was $53.2 billion in August, up $3.2 billion from $50.0 billion in July, revised.
August exports were $209.4 billion, $1.7 billion less than July exports. August imports were $262.7 billion, $1.5 billion more than July imports.
The August increase in the goods and services deficit reflected an increase in the goods deficit of $3.6 billion to $76.7 billion and an increase in the services surplus of $0.4 billion to $23.5 billion.
Year-to-date, the goods and services deficit increased $31.0 billion, or 8.6 percent, from the same period in 2017. Exports increased $129.6 billion or 8.4 percent. Imports increased $160.6 billion or 8.4 percent.
In August, Canada's merchandise trade balance with the world was in a surplus position for the first time since December 2016. The $526 million surplus followed a $189 million deficit in July. Both imports and exports declined in August. Imports fell 2.5%, mainly on lower imports from non-US countries, while exports were down 1.1%, mostly on decreased exports of passenger cars and light trucks.
In real (or volume) terms, imports declined 1.5% and exports fell 0.7%.
Yandex N.V. (YNDX) target lowered to $47 from $49 at BofA/Merrill
Compared with September 2017, employment was up 222,000 or 1.2%, entirely the result of gains in full-time work (+224,000). Over the same period, total hours worked increased 0.7%.
In the third quarter, employment grew by 66,000 (+0.4%), following little change in the first and second quarters.
Employment increased in Ontario and British Columbia while it was little changed in the remaining provinces.
More people worked in construction; finance, insurance, real estate, rental and leasing; public administration; and agriculture. At the same time, employment fell in information, culture and recreation; and business, building and other support services.
Employment increased for private sector employees while the number of public sector employees was little changed. The number of self-employed workers decreased.
Employment increased for the core age population (aged 25 to 54) and held steady for the other demographic groups.
The average workweek for all employees on private nonfarm payrolls remained unchanged at 34.5 hours in September. In manufacturing, the workweek edged down by 0.1 hour to 40.8 hours, and overtime edged down by 0.1 hour to 3.4 hours. The average workweek for production and nonsupervisory employees on private nonfarm payrolls was unchanged at 33.7 hours.
In September, average hourly earnings for all employees on private nonfarm payrolls rose by 8 cents to $27.24. Over the year, average hourly earnings have increased by 73 cents, or 2.8 percent. Average hourly earnings of private-sector production and nonsupervisory employees increased by 6 cents to $22.81 in September.
The unemployment rate declined to 3.7 percent in September, and total nonfarm payroll employment increased by 134,000, the U.S. Bureau of Labor Statistics reported today. Job gains occurred in professional and business services, in health care, and in transportation and warehousing.
The number of long-term unemployed (those jobless for 27 weeks or more) was little changed at 1.4 million over the month; these individuals accounted for 22.9 percent of the unemployed.
Employment in professional and business services increased by 54,000 in September and has risen by 560,000 over the year.
Health care employment rose by 26,000 in September. Hospitals added 12,000 jobs, and employment in ambulatory health care services continued to trend up (+10,000). Over the year, health care employment has increased by 302,000.
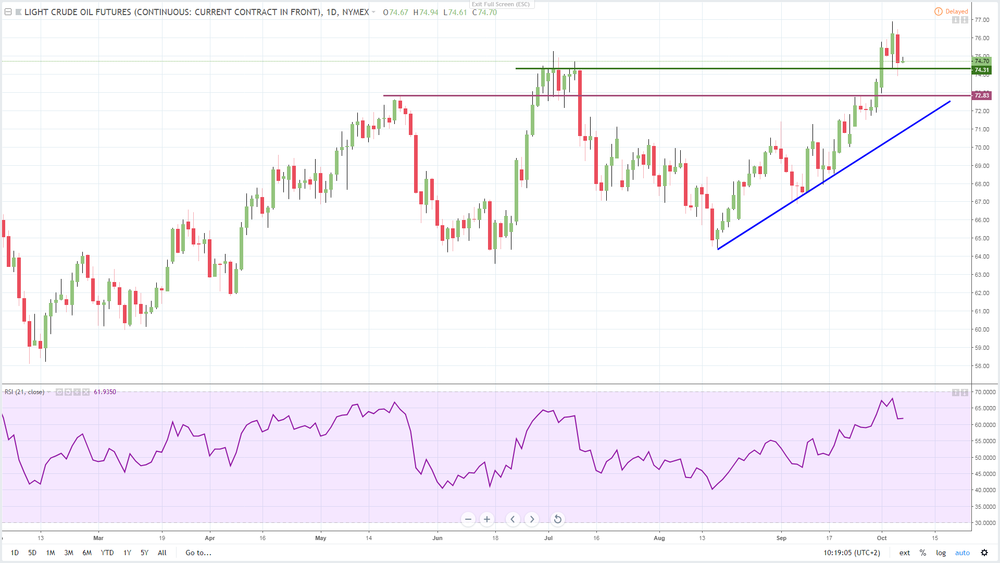
The price of oil dropped considerably on Thursday, but it was only a correction of the previous steep bullish move. The price rose by 0.30% during the London session on Friday, hovering around the 75.00 USD mark.
The price is now testing July's highs of around 74.30 USD, where the first major support is located. If oil stays above, the short-term outlook may remain bullish. The next buying zone mat lay at May's highs at 72.80 USD and subsequently, at the bullish trend line, which lies near 71.80 USD. As long as oil trades above these supports, the short and medium-term outlooks seem bullish.
The resistance to Friday's trading might be at around the 75 USD mark and if broken, oil could accelerate higher towards the current cycle highs of 77.00 USD.
However, the daily RSI is approaching overbought conditions and remains slightly below the 70 zone, which points to the possibility that a correction could occur soon. This could bring about another market opportunity and traders might jump in to the dip. Volatility might be expected to be higher today due to the US labour market data release.
Disclaimer:
Analysis and opinions provided herein are intended solely for informational and educational purposes and don't represent a recommendation or an investment advice by TeleTrade. Indiscriminate reliance on illustrative or informational materials may lead to losses.
On the basis of an assessment of the current and evolving macroeconomic situation at its meeting today, the Monetary Policy Committee (MPC) decided to:
• keep the policy repo rate under the liquidity adjustment facility (LAF) unchanged at 6.5 per cent. Consequently, the reverse repo rate under the LAF remains at 6.25 per cent, and the marginal standing facility (MSF) rate and the Bank Rate at 6.75 per cent.
The decision of the MPC is consistent with the stance of calibrated tightening of monetary policy in consonance with the objective of achieving the medium-term target for consumer price index (CPI) inflation of 4 per cent within a band of +/- 2 per cent, while supporting growth. The main considerations underlying the decision are set out in the statement below.
Since the last MPC meeting in August 2018, global economic activity has remained resilient in spite of ongoing trade tensions, but is becoming uneven and the outlook is clouded by several uncertainties. Among advanced economies (AEs), the United States (US) economy appeared to have sustained pace in Q3:2018 as reflected in strong retail sales and robust industrial activity. In the Euro area, economic activity remained subdued due to overall weak economic sentiment, weighed down mainly by political uncertainty. The Japanese economy has so far maintained the momentum of the previous quarter, buoyed by recovering industrial production and strong business optimism.
The underlying pattern in the retail trade in August 2018, as suggested by the three-month on three-month measure remains one of growth for the fourth consecutive month, increasing by 0.5% in value terms and by 0.3% in volume terms.
Month on month both value and volume of retail trade rose by 0.7% in August 2018.
Compared with August 2017, both value and volume were estimated to have increased respectively by 2.2% and 1.4%.
The retail trade index for large scale distribution was up 2.4% while small scale distribution was up 1.3% when compared with the same period a year earlier. Online sales continued to grow year-on-year at 8.6%.
-
House prices in the latest quarter (July-September) were 1.8% higher than in the preceding three months (April-June), the third consecutive rise on this measure
-
House prices in the three months to September were 2.5% higher than in the same three months a year earlier
-
The annual growth rate slowed from the 3.7% recorded in August
-
On a monthly basis, house prices fell by 1.4% in September, the second consecutive fall for this measure
Russell Galley, Managing Director, Halifax, said: "With the annual rate of house price growth easing to 2.5% in September from 3.7% in August and the quarterly rate of growth remaining at 1.8% for the second month, we are seeing a steadying in house price inflation across these more stable measures. "This is set amongst mortgage approvals and completed house sales remaining broadly unchanged, although a gradual pickup in wage growth has helped to support household finances. "The annual rate of growth is near the top of our forecast range of 0-3% for 2018, as a low supply of new homes and existing properties for sale, combined with historically low mortgage rates and a high employment rate, continue to support house prices".
The consumer price index (CPI) increased by 0.1% in September 2018 compared with the previous month, reaching 101.9 points (December 2015 = 100). Inflation was 1.0% compared with the same month of the previous year. These are the results of the Federal Statistical Office (FSO).
The 0.1% increase compared with the previous month can be explained by several factors including rising prices for clothing and fresh vegetables. In contrast, prices for international package holidays and air transport decreased.
EUR/USD
Resistance levels (open interest**, contracts)
$1.1654 (2904)
$1.1615 (3431)
$1.1591 (755)
Price at time of writing this review: $1.1511
Support levels (open interest**, contracts):
$1.1449 (2975)
$1.1400 (2876)
$1.1350 (2829)
Comments:
- Overall open interest on the CALL options and PUT options with the expiration date October, 15 is 95478 contracts (according to data from October, 4) with the maximum number of contracts with strike price $1,1600 (4881);
GBP/USD
Resistance levels (open interest**, contracts)
$1.3202 (2939)
$1.3113 (2552)
$1.3074 (1716)
Price at time of writing this review: $1.3043
Support levels (open interest**, contracts):
$1.2992 (1957)
$1.2947 (2002)
$1.2899 (2461)
Comments:
- Overall open interest on the CALL options with the expiration date October, 15 is 28897 contracts, with the maximum number of contracts with strike price $1,3200 (2939);
- Overall open interest on the PUT options with the expiration date October, 15 is 39860 contracts, with the maximum number of contracts with strike price $1,2900 (2461);
- The ratio of PUT/CALL was 1.38 versus 1.38 from the previous trading day according to data from October, 4.
* - The Chicago Mercantile Exchange bulletin (CME) is used for the calculation.
** - Open interest takes into account the total number of option contracts that are open at the moment.
The Australian Industry Group/Housing Performance of Construction Index declined by 2.5 points to 49.3 points (seasonally adjusted) in September.
This fall in the Australian PCI to a level below the critical 50-points threshold (that separates expansion from contraction) signalled the first contraction in overall construction industry conditions in 20 months.
The activity sub-index expanded modestly in September after moving into mild negative territory (i.e. below 50 points) in August. However, the new orders sub-index contracted amid weaker demand conditions across all four industry sub-sectors. This was associated with a further decline in employment which recorded its sharpest fall in 21 months
The average of household spending in Japan was up 2.8 percent on year in Augusty- coming in at 292,481 yen, according to rttnews
That beat expectations for an increase of 0.1 percent, which would have been unchanged from July.
The average of monthly income per household stood at 510,437 yen, up an annual 3.6 percent.
Among the individual components of the survey, spending was up for housing, furniture, clothing, medical care, transportation and education. Spending was down for fuel and recreation.
Australian retail turnover rose 0.3 per cent in August 2018, seasonally adjusted, according to the latest Australian Bureau of Statistics (ABS) Retail Trade figures.
This follows a relatively unchanged estimate (0.0 per cent) in July 2018.
"There were rises in five of the six industries," said Ben James, Director of Quarterly Economy Wide Surveys. "Cafes, restaurants and takeaway food services (0.7 per cent) led the rises. Rises were also seen in Clothing, footwear and personal accessory retailing (0.8 per cent), Other retailing (0.4 per cent), Department stores (0.9 per cent), and Household goods retailing (0.2 per cent). Food retailing was relatively unchanged (0.0 per cent)".
In seasonally adjusted terms, there were rises in New South Wales (0.5%), Victoria (0.2%), South Australia (0.8%), Queensland (0.1%), Tasmania (0.6%), and the Australian Capital Territory (0.2%). Western Australia was relatively unchanged (0.0%), whilst there was a fall in the Northern Territory (-1.3%).
Based on provisional data, the Federal Statistical Office (Destatis) reports that price-adjusted new orders in manufacturing had increased in August 2018 a seasonally and calendar adjusted 2.0% on the previous month. For July 2018, there was a decrease of 0.9% compared with June 2018, thus confirming the provisional result published in the previous month. Price-adjusted new orders without major orders in manufacturing had increased in August 2018 a seasonally and calendar adjusted 3.3% on the previous month.
Domestic orders decreased by 2.9% and foreign orders increased by 5.8% in August 2018 on the previous month. New orders from the euro area were down 2.2%, new orders from other countries increased 11.1% compared to July 2018.
In August 2018 the manufacturers of intermediate goods saw new orders fall by 0.1% compared with July 2018. The manufacturers of capital goods showed increases of 3.4% on the previous month. For consumer goods, an increase in new orders of 2.1% was recorded.
In August 2018 the index of producer prices for industrial products rose by 3.1% compared with the corresponding month of the preceding year. In July the annual rate of change all over had been 2.9%, as reported by the Federal Statistical Office.
Compared with the preceding month July the overall index rose by 0.3% in August 2018 (+0.2% in July 2018 and +0.4% in June 2018).
In August 2018 the price indices of all main industrial groups increased compared with August 2017: Energy prices were up 7.3%, though the development of prices of the different energy carriers diverged. Prices of petroleum products were up 17.9%, whereas prices of electricity increased by 7.9% and prices of natural gas (distribution) rose by 4.9%. Prices of intermediate goods were up 2.9%. Prices of durable consumer goods rose by 1.8% and of capital goods by 1.4%, whereas prices of non-durable consumer goods slightly increased by 0.1%.
-
Italy Hikes 2018 Fiscal Deficit Target To 1.8 Pct Of GDP From 1.6 Pct


© 2000-2024. All rights reserved.
This site is managed by Teletrade D.J. LLC 2351 LLC 2022 (Euro House, Richmond Hill Road, Kingstown, VC0100, St. Vincent and the Grenadines).
The information on this website is for informational purposes only and does not constitute any investment advice.
The company does not serve or provide services to customers who are residents of the US, Canada, Iran, The Democratic People's Republic of Korea, Yemen and FATF blacklisted countries.
Making transactions on financial markets with marginal financial instruments opens up wide possibilities and allows investors who are willing to take risks to earn high profits, carrying a potentially high risk of losses at the same time. Therefore you should responsibly approach the issue of choosing the appropriate investment strategy, taking the available resources into account, before starting trading.
Use of the information: full or partial use of materials from this website must always be referenced to TeleTrade as the source of information. Use of the materials on the Internet must be accompanied by a hyperlink to teletrade.org. Automatic import of materials and information from this website is prohibited.
Please contact our PR department if you have any questions or need assistance at pr@teletrade.global.
transfers