- Analytics
- News and Tools
- Market News
CFD Markets News and Forecasts — 05-04-2018
| raw materials | closing price | % change |
| Oil | 63.73 | +0.57% |
| Gold | 1,329.90 | -0.77% |
| index | closing price | change items | % change |
| Nikkei | +325.87 | +325.87 | +1.53% |
| TOPIX | +18.48 | 1724.61 | +1.08% |
| Hang Seng | | | |
| CSI 300 | | | |
| Euro Stoxx 50 | +89.60 | 3429.95 | +2.68% |
| FTSE 100 | +165.49 | 7199.50 | +2.35% |
| DAX | +347.29 | 12305.19 | +2.90% |
| CAC 40 | +134.87 | 5276.67 | +2.62% |
| DJIA | +240.92 | 24505.22 | +0.99% |
| S&P 500 | +18.15 | 2662.84 | +0.69% |
| NASDAQ | +34.44 | 7076.55 | +0.49% |
| S&P/TSX | +191.68 | 15356.05 | +1.26% |
| Pare | Closed | % change |
| EUR/USD | $1,2238 | -0,35% |
| GBP/USD | $1,4001 | -0,59% |
| USD/CHF | Chf0,96321 | +0,28% |
| USD/JPY | Y107,41 | +0,61% |
| EUR/JPY | Y131,45 | +0,26% |
| GBP/JPY | Y150,394 | +0,02% |
| AUD/USD | $0,7684 | -0,42% |
| NZD/USD | $0,7271 | -0,53% |
| USD/CAD | C$1,27501 | -0,16% |
| Time | Region | Event | Period | Previous | Forecast |
| 01:30 | Japan | Household spending Y/Y | February | 1.9% | 0.3% |
| 02:00 | Japan | Labor Cash Earnings, YoY | February | 0.7% | 0.5% |
| 07:00 | Japan | Leading Economic Index | February | 105.6 | |
| 07:00 | Japan | Coincident Index | February | 114.9 | |
| 08:00 | Germany | Industrial Production s.a. (MoM) | February | -0.1% | 0.3% |
| 08:45 | France | Trade Balance, bln | February | -5.6 | -5.15 |
| 09:00 | Switzerland | Foreign Currency Reserves | March | 732.76 | |
| 14:30 | Canada | Employment | March | 15.4 | 20 |
| 14:30 | Canada | Unemployment rate | March | 5.8% | 5.8% |
| 14:30 | USA | Manufacturing Payrolls | March | 31 | 20 |
| 14:30 | USA | Government Payrolls | March | 26 | |
| 14:30 | USA | Average workweek | March | 34.5 | 34.5 |
| 14:30 | USA | Private Nonfarm Payrolls | March | 287 | 190 |
| 14:30 | USA | Labor Force Participation Rate | March | 63% | |
| 14:30 | USA | Average hourly earnings | March | 0.1% | 0.2% |
| 14:30 | USA | Unemployment Rate | March | 4.1% | 4% |
| 14:30 | USA | Nonfarm Payrolls | March | 313 | 190 |
| 16:00 | USA | Ivey Purchasing Managers Index | March | 59.6 | 60.2 |
| 17:15 | United Kingdom | BOE Gov Mark Carney Speaks | | | |
| 19:00 | USA | Baker Hughes Oil Rig Count | April | 798 | |
| 19:30 | USA | Fed Chair Powell Speaks | | | |
| 21:00 | USA | Consumer Credit | February | 13.91 | 15 |
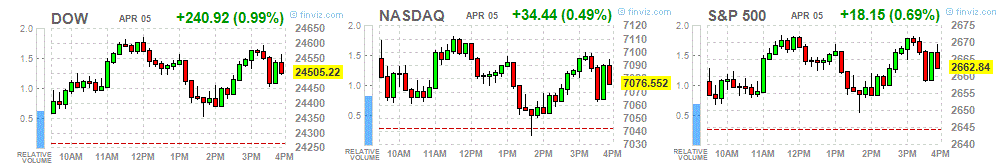
The major US stock indices grew moderately, as concerns about the trade war between the US and China weakened.
In addition, market participants won back statistics on the United States. As it became known, the number of Americans applying for new unemployment benefits rose last week, but remained close to the minimum for several decades, offering new evidence of the strength of the labor market. Initial claims for unemployment benefits increased by 24,000 to 242,000, seasonally adjusted for the week to March 31, the Ministry of Labor said. Economists were expecting 225,000 new applications. The four-week moving average of primary hits, a more stable measure, increased by 3,000 to 228,250. Meanwhile, the number of repeated applications fell by 64,000 to 1,808,000 in the week to March 24, the lowest level since December 1973, when the rate was 1 805 000.
A separate report from the Ministry of Trade showed that the US trade deficit in February rose 1.6% to almost a 10-year high, underscoring the seemingly almost impossible task of the Trump administration to drastically reduce the gap that the president promised. The deficit of the US trade balance rose in February to $ 57.6 billion from $ 56.7 billion in the previous month. Economists predicted a gap of $ 56.9 billion. This is the biggest deficit since October 2008. Just a year ago, at the beginning of the first year of Trump's presidency, the deficit was 24% less at $ 45.9 billion. The reason for the expansion of the deficit was a record increase in imports and exports. Imports rose by 1.7% to $ 262 billion, aided by a significant increase in imports of crude oil and pharmaceuticals. The cost of oil imports reached its highest level in three years, although the number of imported barrels fell to a 3-year low, reflecting higher oil prices. Exports climbed 1.7%, as the US sent more cars and planes.
Most components of the DOW index finished trading in positive territory (27 out of 30). The leader of growth was the shares of The Boeing Company (BA, + 2.86%). Outsider were shares Pfizer Inc. (PFE, -0.99%).
All sectors of the S & P index recorded an increase. The commodities sector grew most (+ 2.0%).
At closing:
Dow 24,505.01 +240.71 +0.99%
S&P 500 2,662.82 +18.13 +0.69%
Nasdaq 100 7,076.55 +34.44 +0.49%
Canada's merchandise trade deficit totalled $2.7 billion in February, widening from a $1.9 billion deficit in January. Imports rose 1.9%, mainly due to higher imports of energy products. Exports increased 0.4%, primarily on higher exports of passenger cars and light trucks.
In real (or in volume) terms, imports rose 1.9% and exports were up 0.6%.
Following a 4.3% decline in January, total imports were up 1.9% in February to $48.6 billion, with increases in 8 of 11 sections. Higher imports of energy products and of motor vehicles and parts were partially offset by lower imports of gold. Year over year, total imports increased 3.5%.
The U.S. Census Bureau and the U.S. Bureau of Economic Analysis announced today that the goods and services deficit was $57.6 billion in February, up $0.9 billion from $56.7 billion in January, revised.
February exports were $204.4 billion, $3.5 billion more than January exports. February imports were $262.0 billion, $4.4 billion more than January imports.
The February increase in the goods and services deficit reflected an increase in the goods deficit of $0.3 billion to $77.0 billion and a decrease in the services surplus of $0.6 billion to $19.4 billion.
Year-to-date, the goods and services deficit increased $21.1 billion, or 22.7 percent, from the same period in 2017. Exports increased $22.4 billion or 5.9 percent. Imports increased $43.6 billion or 9.1 percent.
In the week ending March 31, the advance figure for seasonally adjusted initial claims was 242,000, an increase of 24,000 from the previous week's revised level. The previous week's level was revised up by 3,000 from 215,000 to 218,000. The 4-week moving average was 228,250, an increase of 3,000 from the previous week's revised average. The previous week's average was revised up by 750 from 224,500 to 225,250.
U.S. stock-index futures rose on Thursday, continuing yesterday's dynamics, as concerns about a possible trade war between the United States and China eased.
Global Stocks:
| Index/commodity | Last | Today's Change, points | Today's Change, % |
| Nikkei | 21,645.42 | +325.87 | +1.53% |
| Hang Seng | - | - | - |
| Shanghai | - | - | - |
| S&P/ASX | 5,788.80 | +27.40 | +0.48% |
| FTSE | 7,150.40 | +116.39 | +1.65% |
| CAC | 5,245.64 | +103.84 | +2.02% |
| DAX | 12,234.38 | +276.48 | +2.31% |
| Crude | $63.24 | | -0.21% |
| Gold | $1,328.70 | | -0.86% |
(company / ticker / price / change ($/%) / volume)
| 3M Co | MMM | 219 | 1.44(0.66%) | 139574 |
| ALCOA INC. | AA | 47.5 | 0.58(1.24%) | 4600 |
| ALTRIA GROUP INC. | MO | 63.73 | 0.38(0.60%) | 950 |
| Amazon.com Inc., NASDAQ | AMZN | 1,432.19 | 21.62(1.53%) | 123470 |
| American Express Co | AXP | 94.83 | 1.60(1.72%) | 5462 |
| Apple Inc. | AAPL | 172.97 | 1.36(0.79%) | 192350 |
| AT&T Inc | T | 36 | 0.12(0.33%) | 18843 |
| Barrick Gold Corporation, NYSE | ABX | 12.47 | -0.05(-0.40%) | 7873 |
| Boeing Co | BA | 330.1 | 2.66(0.81%) | 26917 |
| Caterpillar Inc | CAT | 146.8 | 1.62(1.12%) | 4147 |
| Chevron Corp | CVX | 114.87 | 0.39(0.34%) | 383741 |
| Cisco Systems Inc | CSCO | 41.55 | 0.35(0.85%) | 3611 |
| Citigroup Inc., NYSE | C | 70.29 | 0.98(1.41%) | 48805 |
| Deere & Company, NYSE | DE | 149.94 | 1.37(0.92%) | 793 |
| Exxon Mobil Corp | XOM | 75.05 | 0.18(0.24%) | 956062 |
| Facebook, Inc. | FB | 160.75 | 5.65(3.64%) | 698330 |
| FedEx Corporation, NYSE | FDX | 239 | 0.24(0.10%) | 3099 |
| Ford Motor Co. | F | 11.34 | 0.01(0.09%) | 28334 |
| Freeport-McMoRan Copper & Gold Inc., NYSE | FCX | 17.58 | 0.24(1.38%) | 31970 |
| General Electric Co | GE | 13.33 | 0.05(0.38%) | 73887 |
| General Motors Company, NYSE | GM | 38.18 | 0.15(0.39%) | 1048448 |
| Goldman Sachs | GS | 254.34 | 1.72(0.68%) | 5466 |
| Google Inc. | GOOG | 1,039.00 | 13.86(1.35%) | 36077 |
| Home Depot Inc | HD | 178.34 | 0.90(0.51%) | 4699 |
| Intel Corp | INTC | 49.86 | -0.13(-0.26%) | 162916 |
| International Business Machines Co... | IBM | 154.8 | 0.68(0.44%) | 3945 |
| International Paper Company | IP | 53.37 | 0.20(0.38%) | 490 |
| Johnson & Johnson | JNJ | 131 | 0.59(0.45%) | 262639 |
| JPMorgan Chase and Co | JPM | 111.7 | 1.27(1.15%) | 21452 |
| McDonald's Corp | MCD | 162.4 | 0.67(0.41%) | 114411 |
| Merck & Co Inc | MRK | 55.1 | 0.56(1.03%) | 12506 |
| Microsoft Corp | MSFT | 92.76 | 0.43(0.47%) | 81193 |
| Nike | NKE | 68.82 | 0.40(0.58%) | 6754 |
| Pfizer Inc | PFE | 36 | -0.13(-0.36%) | 40805 |
| Procter & Gamble Co | PG | 79.46 | 0.41(0.52%) | 2365 |
| Starbucks Corporation, NASDAQ | SBUX | 59 | 0.17(0.29%) | 3413 |
| Tesla Motors, Inc., NASDAQ | TSLA | 288.5 | 1.56(0.54%) | 98230 |
| The Coca-Cola Co | KO | 44.25 | 0.01(0.02%) | 3164 |
| Twitter, Inc., NYSE | TWTR | 28.75 | 0.50(1.77%) | 1297239 |
| UnitedHealth Group Inc | UNH | 229.75 | 0.96(0.42%) | 1053 |
| Verizon Communications Inc | VZ | 48.08 | 0.15(0.31%) | 3299 |
| Visa | V | 121 | 1.19(0.99%) | 11910 |
| Wal-Mart Stores Inc | WMT | 87.69 | 0.47(0.54%) | 3802 |
| Walt Disney Co | DIS | 101.44 | 0.49(0.49%) | 2096 |
| Yandex N.V., NASDAQ | YNDX | 40 | 0.34(0.86%) | 125 |
American Express (AXP) initiated with a Buy at Citigroup; target $110
Intel (INTC) downgraded to Hold from Buy at Stifel
Pfizer (PFE) downgraded to Equal Weight from Overweight at Barclays
Citigroup (C) upgraded to Buy from Neutral at UBS
Merck (MRK) upgraded to Overweight from Equal Weight at Barclays
In February 2018, compared with January 2018, industrial producer prices rose by 0.1% in the euro area (EA19) and remained stable in the EU28, according to estimates from Eurostat, the statistical office of the European Union. In January 2018, prices increased by 0.4% in both zones. In February 2018, compared with February 2017, industrial producer prices rose by 1.6% in the euro area and by 1.8% in the EU28.
In February 2018 compared with January 2018, the seasonally adjusted volume of retail trade increased by 0.1% in the euro area (EA19) and by 0.2% in the EU28, according to estimates from Eurostat, the statistical office of the European Union. In January, the retail trade volume fell by 0.3% in the euro area and remained unchanged in the EU28. In February 2018 compared with February 2017, the calendar adjusted retail sales index increased by 1.8% in the euro area and by 2.0% in the EU28.
The seasonally adjusted IHS Markit/CIPS UK Services PMI Business Activity Index dropped from 54.5 in February to 51.7 in March, to signal the weakest service sector performance since July 2016. Anecdotal evidence suggested that usually bad weather had disrupted business operations and contributed to subdued consumer spending in March. There were also reports that heightened economic uncertainty continued to act as a brake on growth during the latest survey period.
March saw eurozone economic activity expand at the weakest pace since the start of 2017, as rates of increase moderated in both the manufacturing and service sectors. The slowing signalled by the latest PMI data reflected a combination of a mild deceleration in new order growth, bad weather in some northern regions and supply-chain constraints resulting from the recent growth spurt.
The final IHS Markit Eurozone PMI Composite Output Index posted 55.2 in March, down from 57.1 in February and below the earlier flash estimate of 55.3.
The seasonally adjusted final IHS Markit Germany Services PMI Business Activity Index fell for the second straight month in March to 53.9, down from 55.3 in February and its lowest reading since last August. Nevertheless, thanks to a strong showing in the opening month of the year, when the headline PMI peaked at a near seven-year high, average growth in the first quarter was the greatest since Q3 2014.
Commenting on the final PMI® survey data, Phil Smith, Principal Economist at IHS Markit said: "The pace of growth in Germany's private sector cooled at the end of the first quarter, with the services PMI retreating further from January's recent peak to signal a loss of momentum in line with that seen in manufacturing. "Given the especially strong start to the year, the slowdown comes as no great surprise and the performance over the first quarter overall was still one of the best seen over the past seven years".
Business activity growth in the French service sector continued at the end of the third quarter, but eased for the second time in as many months amid a slower rise in new orders. Weaker client demand led to a softer round of job creation, while business confidence dipped to a five-month low. Contrary to these trends, backlogs of unfinished work accumulated at a sharper pace.
The headline seasonally adjusted Business Activity Index posted 56.9 in March. Down from February's reading of 57.4, the latest index reading highlighted the weakest rate of expansion in seven months, but one that remained markedly higher than the long-run series average.
The consumer price index (CPI) rose by 0.4% in March 2018 compared with the previous month, reaching 101.5 points (December 2015=100). In comparison with the same month of the previous year, inflation stood at 0.8%. These figures were compiled by the Federal Statistical Office (FSO).
Various factors contributed to the 0.4% rise compared with the previous month, such as an increase in the price of international package holidays, air transport and hotel accommodation. However, prices fell for medicines and fuel.
EUR/USD
Resistance levels (open interest**, contracts)
$1.2410 (4991)
$1.2378 (2564)
$1.2349 (911)
Price at time of writing this review: $1.2262
Support levels (open interest**, contracts):
$1.2198 (4476)
$1.2149 (6528)
$1.2095 (3320)
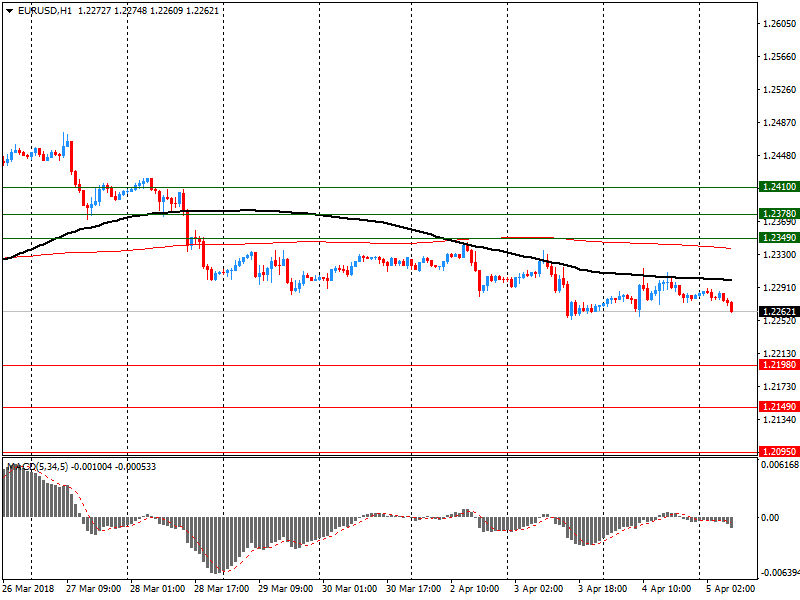
Comments:
- Overall open interest on the CALL options and PUT options with the expiration date April, 6 is 110852 contracts (according to data from April, 4) with the maximum number of contracts with strike price $1,2150 (6528);
GBP/USD
Resistance levels (open interest**, contracts)
$1.4210 (2847)
$1.4147 (1870)
$1.4121 (2698)
Price at time of writing this review: $1.4055
Support levels (open interest**, contracts):
$1.3995 (1273)
$1.3948 (1266)
$1.3899 (3260)
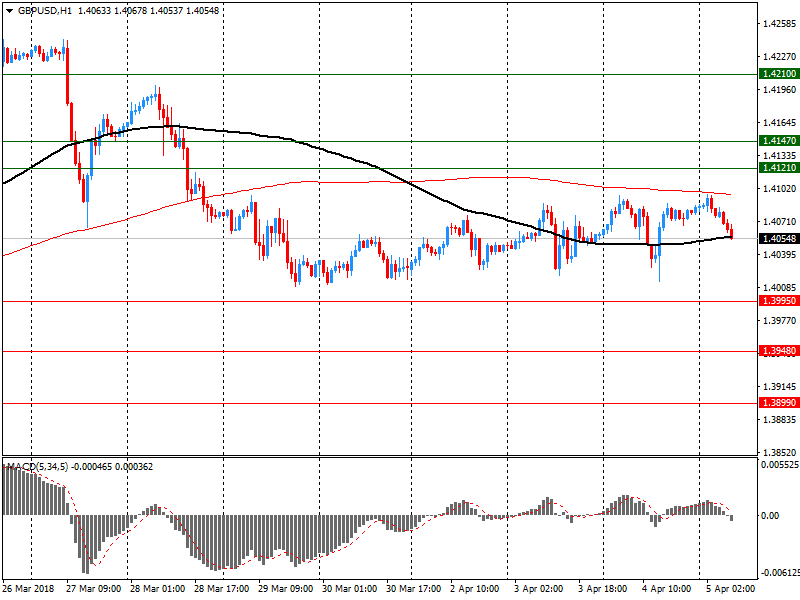
Comments:
- Overall open interest on the CALL options with the expiration date April, 6 is 30118 contracts, with the maximum number of contracts with strike price $1,4200 (2847);
- Overall open interest on the PUT options with the expiration date April, 6 is 34896 contracts, with the maximum number of contracts with strike price $1,3800 (3570);
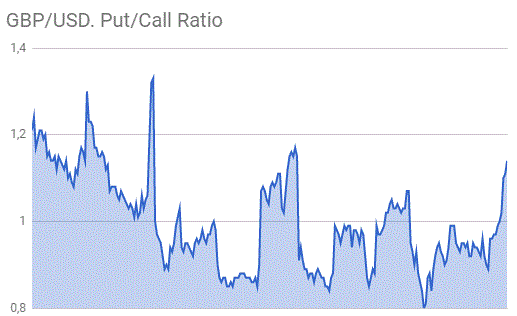
- The ratio of PUT/CALL was 1.15 versus 1.14 from the previous trading day according to data from April, 4
* - The Chicago Mercantile Exchange bulletin (CME) is used for the calculation.
** - Open interest takes into account the total number of option contracts that are open at the moment.
-
In trend terms, the balance on goods and services was a surplus of $262m in February 2018, an increase of $62m on the surplus in January 2018.
-
In seasonally adjusted terms, the balance on goods and services was a surplus of $825m in February 2018, a decrease of $127m on the surplus in January 2018.
-
In seasonally adjusted terms, goods and services credits rose $2m to $34,229m. Rural goods rose $552m (17%). Non-monetary gold fell $505m (23%) and non-rural goods fell $90m. Net exports of goods under merchanting remained steady at $7m. Services credits rose $45m (1%).
-
Canadian NAFTA negotiators open to U.S. ideas on agreeing a deal, but do not see how can complete remaining chapters in next 2 weeks
Based on provisional data, the Federal Statistical Office (Destatis) reports that price-adjusted new orders in manufacturing had increased in February 2018 a seasonally and calendar adjusted 0.3% on the previous month. For January 2018, revision of the preliminary outcome resulted in a decrease of 3.5% compared with December 2017 (primary -3.9%). Price-adjusted new orders without major orders in manufacturing had decreased in February 2018 a seasonally and calendar adjusted -0.7% on the previous month.
Domestic orders decreased by 1.4% and foreign orders increased by 1.4% in February 2018 on the previous month. New orders from the euro area were up 4.5%, new orders from other countries decreased 0.6% compared to January 2018.


© 2000-2024. All rights reserved.
This site is managed by Teletrade D.J. LLC 2351 LLC 2022 (Euro House, Richmond Hill Road, Kingstown, VC0100, St. Vincent and the Grenadines).
The information on this website is for informational purposes only and does not constitute any investment advice.
The company does not serve or provide services to customers who are residents of the US, Canada, Iran, The Democratic People's Republic of Korea, Yemen and FATF blacklisted countries.
Making transactions on financial markets with marginal financial instruments opens up wide possibilities and allows investors who are willing to take risks to earn high profits, carrying a potentially high risk of losses at the same time. Therefore you should responsibly approach the issue of choosing the appropriate investment strategy, taking the available resources into account, before starting trading.
Use of the information: full or partial use of materials from this website must always be referenced to TeleTrade as the source of information. Use of the materials on the Internet must be accompanied by a hyperlink to teletrade.org. Automatic import of materials and information from this website is prohibited.
Please contact our PR department if you have any questions or need assistance at pr@teletrade.global.
transfers