- Analytics
- News and Tools
- Market News
CFD Markets News and Forecasts — 02-11-2018
New orders for manufactured durable goods in September increased $2.0 billion or 0.8 percent to $262.1 billion, the U.S. Census Bureau announced today. This increase, up three of the last four months, followed a 4.6 percent August increase. Excluding transportation, new orders increased 0.1 percent. Excluding defense, new orders decreased 0.6 percent. Transportation equipment, also up three of the last four months, led the increase, $1.8 billion or 1.9 percent to $97.4 billion.
Shipments of manufactured durable goods in September, up four of the last five months, increased $3.3 billion or 1.3 percent to $256.8 billion. This followed a 0.9 percent August increase. Transportation equipment, up three of the last four months, led the increase, $2.9 billion or 3.3 percent to $89.4 billion.
Before the bell: S&P futures +0.50%, NASDAQ futures -0.35%
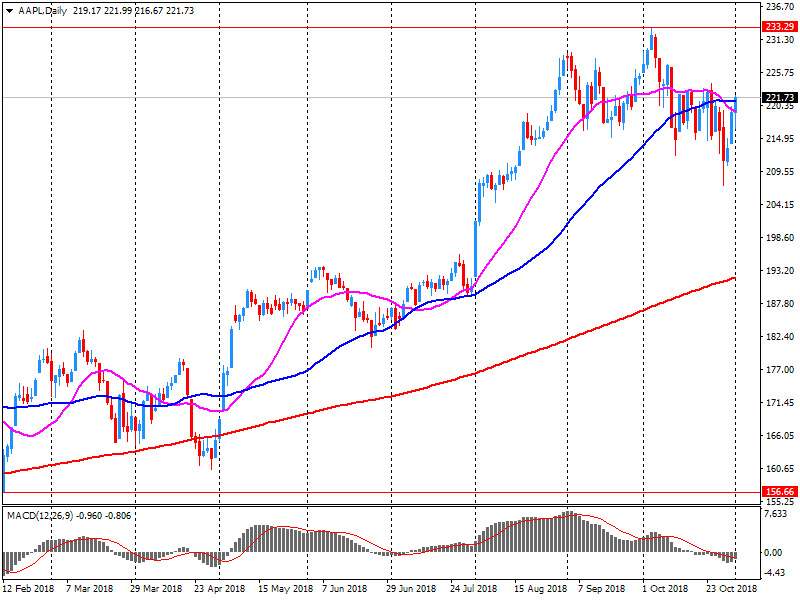
U.S. stock-index futures traded mixed on Friday, as investors digested strong employment data and disappointing Apple’ (AAPL) iPhone shipments.
Global Stocks:
Index/commodity | Last | Today's Change, points | Today's Change, % |
Nikkei | 22,243.66 | +556.01 | +2.56% |
Hang Seng | 26,486.35 | +1,070.35 | +4.21% |
Shanghai | 2,676.48 | +70.24 | +2.70% |
S&P/ASX | 5,849.20 | +8.40 | +0.14% |
FTSE | 7,165.58 | +50.92 | +0.72% |
CAC | 5,152.28 | +66.50 | +1.31% |
DAX | 11,649.75 | +181.21 | +1.58% |
Crude | $63.35 | -0.53% | |
Gold | $1,233.10 | -0.44% |
(company / ticker / price / change ($/%) / volume)
3M Co | MMM | 194.5 | 2.28(1.19%) | 5842 |
ALCOA INC. | AA | 37.5 | 0.72(1.96%) | 11270 |
ALTRIA GROUP INC. | MO | 63.44 | -0.23(-0.36%) | 1201 |
Amazon.com Inc., NASDAQ | AMZN | 1,675.00 | 9.47(0.57%) | 154759 |
American Express Co | AXP | 104.83 | 0.79(0.76%) | 1371 |
AMERICAN INTERNATIONAL GROUP | AIG | 43.9 | 0.78(1.81%) | 300 |
Apple Inc. | AAPL | 208.03 | -14.19(-6.39%) | 2474950 |
AT&T Inc | T | 30.6 | 0.11(0.36%) | 58364 |
Barrick Gold Corporation, NYSE | ABX | 13.3 | -0.04(-0.30%) | 59821 |
Boeing Co | BA | 369.75 | 6.68(1.84%) | 63619 |
Caterpillar Inc | CAT | 127.03 | 2.33(1.87%) | 61871 |
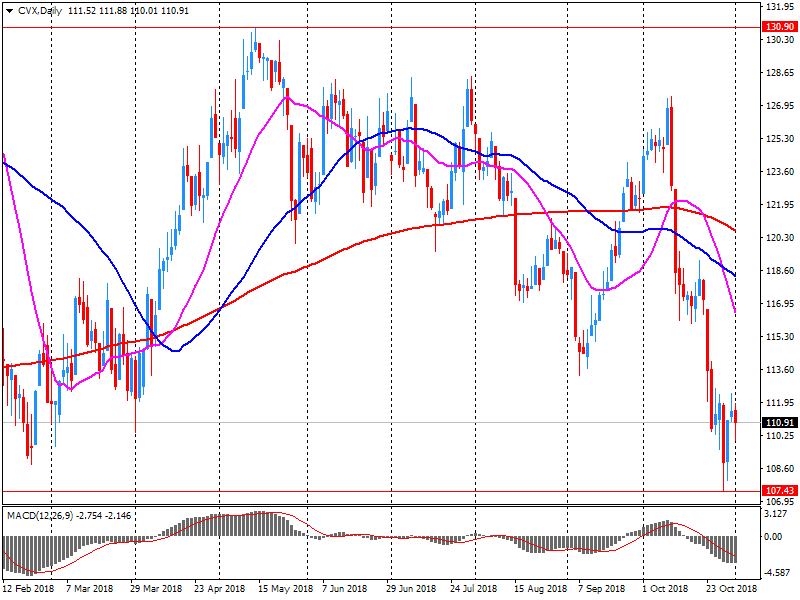
Chevron Corp | CVX | 113.95 | 2.78(2.50%) | 51947 |
Cisco Systems Inc | CSCO | 45.75 | 0.10(0.22%) | 61063 |
Citigroup Inc., NYSE | C | 66.16 | 0.78(1.19%) | 40746 |
Deere & Company, NYSE | DE | 142.25 | 1.60(1.14%) | 2359 |
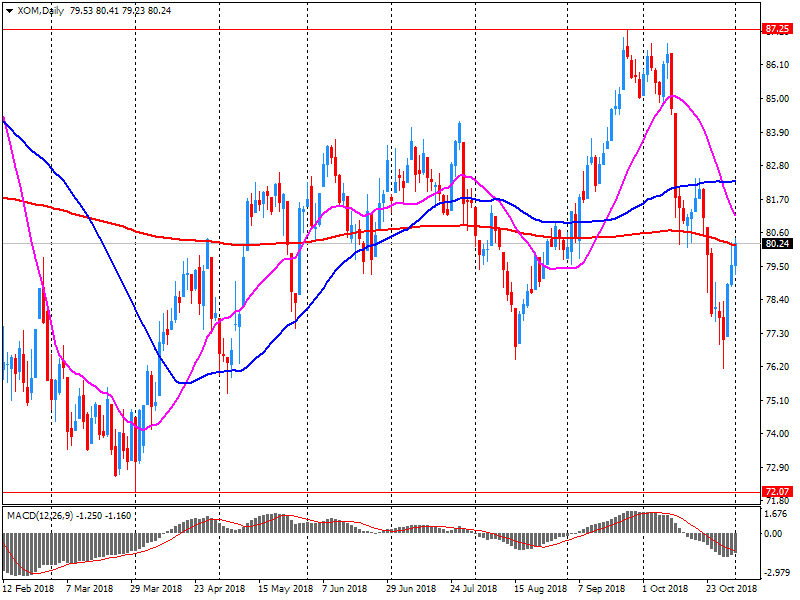
Exxon Mobil Corp | XOM | 82.45 | 1.78(2.21%) | 154010 |
Facebook, Inc. | FB | 152.45 | 0.70(0.46%) | 206114 |
FedEx Corporation, NYSE | FDX | 225.7 | 1.66(0.74%) | 1591 |
Ford Motor Co. | F | 9.36 | 0.07(0.75%) | 85045 |
Freeport-McMoRan Copper & Gold Inc., NYSE | FCX | 12.52 | 0.24(1.95%) | 90989 |
General Electric Co | GE | 9.68 | 0.10(1.04%) | 691203 |
General Motors Company, NYSE | GM | 36.79 | 0.32(0.88%) | 41691 |
Goldman Sachs | GS | 229.8 | 2.83(1.25%) | 8013 |
Google Inc. | GOOG | 1,076.02 | 6.02(0.56%) | 13666 |
Hewlett-Packard Co. | HPQ | 24.67 | 0.18(0.74%) | 990 |
Home Depot Inc | HD | 181.5 | 1.04(0.58%) | 10594 |
HONEYWELL INTERNATIONAL INC. | HON | 145.5 | 1.05(0.73%) | 1372 |
Intel Corp | INTC | 48.48 | 0.26(0.54%) | 52700 |
International Business Machines Co... | IBM | 117.45 | 0.62(0.53%) | 32726 |
Johnson & Johnson | JNJ | 141.7 | 0.88(0.62%) | 7648 |
JPMorgan Chase and Co | JPM | 110 | 1.02(0.94%) | 33104 |
McDonald's Corp | MCD | 176.31 | 1.43(0.82%) | 6598 |
Merck & Co Inc | MRK | 74.05 | 0.93(1.27%) | 6321 |
Microsoft Corp | MSFT | 106.8 | 0.88(0.83%) | 178622 |
Nike | NKE | 77.49 | 0.70(0.91%) | 19548 |
Pfizer Inc | PFE | 43.9 | 0.23(0.53%) | 5578 |
Procter & Gamble Co | PG | 89.55 | -0.04(-0.04%) | 160430 |
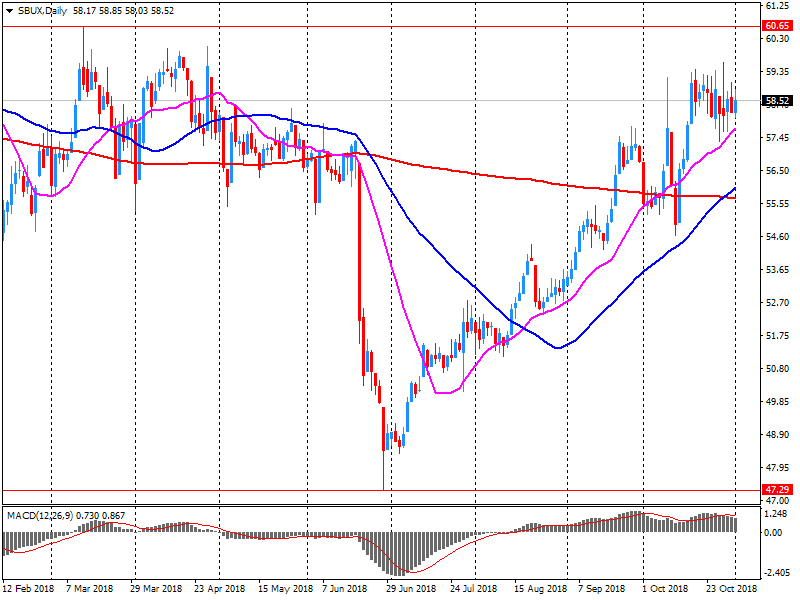
Starbucks Corporation, NASDAQ | SBUX | 63.25 | 4.62(7.88%) | 169170 |
Tesla Motors, Inc., NASDAQ | TSLA | 345.74 | 1.46(0.42%) | 105577 |
The Coca-Cola Co | KO | 47.88 | 0.14(0.29%) | 8311 |
Travelers Companies Inc | TRV | 125.41 | 0.21(0.17%) | 7598 |
Twitter, Inc., NYSE | TWTR | 34.8 | 0.18(0.52%) | 66223 |
United Technologies Corp | UTX | 129.22 | 1.64(1.29%) | 9930 |
UnitedHealth Group Inc | UNH | 264 | 3.07(1.18%) | 9044 |
Verizon Communications Inc | VZ | 56.38 | 0.33(0.59%) | 11259 |
Visa | V | 141.34 | 0.51(0.36%) | 25877 |
Wal-Mart Stores Inc | WMT | 101.31 | 0.73(0.73%) | 6576 |
Walt Disney Co | DIS | 117 | 0.90(0.78%) | 7431 |
Yandex N.V., NASDAQ | YNDX | 30.82 | 0.08(0.26%) | 7650 |
Starbucks (SBUX) target raised to 68 from 64 at BofA/Merrill
Starbucks (SBUX) target raised to 70 from 61 at Oppenheimer
Starbucks (SBUX) target raised to 66 from 62 at Telsey
Chevron (CVX) reported Q3 FY 2018 earnings of $2.11 per share (versus $1.03 in Q3 FY 2017), beating analysts’ consensus estimate of $2.06.
The company’s quarterly revenues amounted to $43.987 bln (+21.5% y/y), missing analysts’ consensus estimate of $47.171 bln.
CVX rose to $113.25 (+1.87%) in pre-market trading.
The U.S. Census Bureau and the U.S. Bureau of Economic Analysis announced today that the goods and services deficit was $54.0 billion in September, up $0.7 billion from $53.3 billion in August, revised.
September exports were $212.6 billion, $3.1 billion more than August exports. September imports were $266.6 billion, $3.8 billion more than August imports.
The September increase in the goods and services deficit reflected an increase in the goods deficit of $0.6 billion to $77.2 billion and a decrease in the services surplus of $0.1 billion to $23.2 billion.
Year-to-date, the goods and services deficit increased $40.7 billion, or 10.1 percent, from the same period in 2017. Exports increased $143.8 billion or 8.2 percent. Imports increased $184.5 billion or 8.6 percent.
Imports fell 0.4%, while exports edged down 0.2%.
Owing to a large upward revision to imports for the August reference month, the trade balance originally reported as a $526 million trade surplus last month is now showing a $551 million deficit. Most of this revision was due to the import of three high value ships, which were reported after the publication of August data. Although late documentation of high-value transactions is common for trade data, the aggregate value these ships represent is infrequently received in late transactions.
Employment was little changed in October. The unemployment rate decreased 0.1 percentage points to 5.8% as fewer people searched for work. Since November 2017, the unemployment rate has ranged from 5.8% to 6.0%.
In the 12 months to October, the number of employed people grew by 206,000 or 1.1%, with the bulk of the gains in full-time work (+173,000). Over the same period, total hours worked rose by 0.7%.
Employment rose slightly in Saskatchewan, while there was little change in all other provinces.
More people were employed in business, building and other support services; wholesale and retail trade; and health care and social assistance. In contrast, there were fewer workers in "other services;" finance, insurance, real estate, rental and leasing; and natural resources.
There were fewer public sector employees in October, while there was little change in the number of private sector employees and the self-employed.
In October, employment increased for men in the core working ages of 25 to 54, and women aged 55 and over. On the other hand, there were fewer employed youths aged 15 to 24.
Total nonfarm payroll employment rose by 250,000 in October, and the unemployment rate was unchanged at 3.7 percent, the U.S. Bureau of Labor Statistics reported today. Job gains occurred in health care, in manufacturing, in construction, and in transportation and warehousing.
The unemployment rate remained at 3.7 percent in October, and the number of unemployed persons was little changed at 6.1 million. Over the year, the unemployment rate and the number of unemployed persons declined by 0.4 percentage point and 449,000, respectively.
The labor force participation rate increased by 0.2 percentage point to 62.9 percent in
October but has shown little change over the year. The employment-population ratio edged up by 0.2 percentage point to 60.6 percent in October and has increased by 0.4 percentage point over the year.
In October, average hourly earnings for all employees on private nonfarm payrolls rose by 5 cents to $27.30. Over the year, average hourly earnings have increased by 83 cents, or 3.1 percent. Average hourly earnings of private-sector production and nonsupervisory employees increased by 7 cents to $22.89 in October
Exxon Mobil (XOM) reported Q3 FY 2018 earnings of $1.46 per share (versus $0.93 in Q3 FY 2017), beating analysts’ consensus estimate of $1.22.
The company’s quarterly revenues amounted to $76.605 bln (+25.4% y/y), beating analysts’ consensus estimate of $72.909 bln.
XOM rose to $82.25 (+1.96%) in pre-market trading.
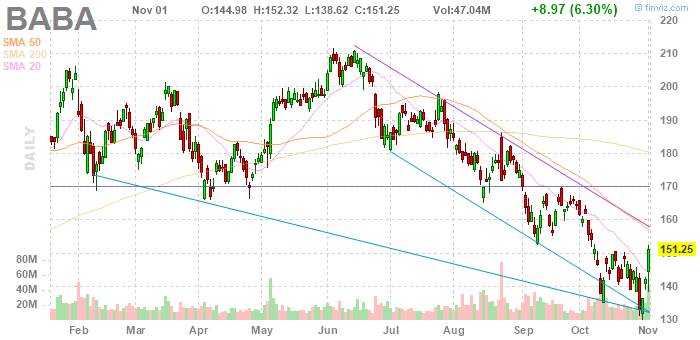
Alibaba (BABA) reported Q2 FY 2019 earnings of $1.11 per share (versus $1.29 in Q2 FY 2018), beating analysts’ consensus estimate of $1.10.
The company’s quarterly revenues amounted to $12.398 bln (+49.6% y/y), generally in line with analysts’ consensus estimate of $12.506 bln.
BABA rose to $159.30 (+5.32%) in pre-market trading.
Starbucks (SBUX) reported Q4 FY 2018 earnings of $0.62 per share (versus $0.55 in Q4 FY 2017), beating analysts’ consensus estimate of $0.60.
The company’s quarterly revenues amounted to $6.304 bln (+10.6% y/y), generally in-line analysts’ consensus estimate of $6.277 bln.
The company also issued in-line guidance for FY 2019, projecting EPS of $2.61-2.66 (versus analysts’ consensus estimate of $2.63) and revenues of +5-7% y/y (or $26-26.45 bln versus analysts’ consensus estimate of $26.16 bln).
SBUX rose to $63.55 (+8.39%) in pre-market trading.
Apple (AAPL) reported Q4 FY 2018 earnings of $2.91 per share (versus $2.07 in Q4 FY 2017), beating analysts’ consensus estimate of $2.78.
The company’s quarterly revenues amounted to $62.900 bln (+19.6% y/y), beating analysts’ consensus estimate of $61.549 bln.
Its iPhone shipments were flat at 46.9 mln versus analysts’ consensus estimate of 48.0 mln.
The company also issues guidance for Q1 FY 2019, projecting revenues of $89-93 bln (versus analysts’ consensus estimate of $92.88 bln) and gross margin at 38.0-8.5% (versus analysts’ consensus estimate of 38.6%).
Apple announced that starting with the December quarter, it would no longer be providing unit-sales data on iPhone, iPad and Mac.
AAPL fell to 209.91 (-5.54%) in pre-market trading.
The overall rate of expansion improved slightly since September and was the second-strongest in 16 months. This mainly reflected a rebound in civil engineering activity, however, as both residential and commercial activity increased more slowly. Less positively, new projects rose only modestly and firms were the least optimistic regarding growth prospects in nearly six years.
At 53.2 in October, up from 52.1 in September, the seasonally adjusted IHS Markit/CIPS UK Construction Total Activity Index posted its second-highest level in 16 months.
Falling for a third month in succession and remaining well down on the record highs seen around the turn of the year, the IHS Markit Eurozone Manufacturing PMI declined to a level of 52.0 in October. That compared to 53.2 in September and was broadly unchanged on the earlier flash reading of 52.1. Market groups data showed that the slowdown in growth was broad-based. Intermediate goods producers fared worst recording concurrent falls in output, new orders and exports. Consumer goods showed some resilience, registering solid rises in both output and new work.
The headline IHS Markit/BME Germany Manufacturing PMI – a single-figure snapshot of the performance of the manufacturing economy – fell for the third month running in October, from 53.7 in September to a 29-month low of 52.2. The Index remained above the 50.0 no-change mark thanks in part to increases in output and employment, though growth slowed on both fronts.
Phil Smith, Principal Economist at IHS Markit, which compiles the Germany Manufacturing PMI survey, commented: "A second consecutive monthly decline in export orders poured more cold water on the manufacturing sector in October, with PMI data indicating the worst overall growth performance for almost two-and-a-half years. "Output barely rose compared with the month before, and the odds appear to be in favour of production falling in coming months rather than regaining momentum. New orders were down for the first time in four years in October and backlogs fell again. But perhaps most telling is the view of manufacturers that output levels are expected to be lower 12 months from now”.
At 51.2 in October, down from 52.5 in September, the seasonally adjusted IHS Markit France Manufacturing PMI pointed to a weaker improvement in operating conditions. Notably, this represented only a modest improvement in business conditions that was the weakest in 25 months.
Eliot Kerr, Economist at IHS Markit, which compiles the France Manufacturing PMI survey, said: "For the first time since mid-2016, French manufacturing output contracted in October. There was also weaker new business growth as new export orders contracted for the third time in four months. Survey respondents frequently mentioned a subdued automotive sector in explaining October's weaknesses. "For French manufacturers, profit margins may be squeezed as output prices rose more slowly than input prices in October. The sharp input cost inflation was attributed to higher rates for oil, steel and aluminium."
Manufacturing conditions in Italy worsened in October, as a sharp reduction in new orders led to a further decline in output. In addition to falling total new work, export sales slipped into negative territory. On the price front, input prices rose at a sharp pace, but charges increased at a slower rate. The headline IHS Markit Italy Manufacturing Purchasing Managers’ Index (PMI) registered 49.2 during October to signal a slight deterioration in overall business conditions. Down from 50.0 in September, the index was below the critical 50.0 mark for the first time since August 2016 and at its lowest overall level for 46 months.
As capacity came under renewed pressure, manufacturers added to their workforce numbers, albeit at a modest rate as business confidence regarding the future slumped to its lowest level since mid-2013. Meanwhile, latest data showed that rising prices for energy, foodstuffs and metals contributed to another round of noticeable input cost inflation.
Turnover in the retail sector fell by 2.3% in nominal terms in September 2018 compared with the previous year. This is the sharpest decline since December 2016. Seasonally adjusted, nominal turnover fell by 1.6% compared with the previous month. These are provisional findings from the Federal Statistical Office (FSO).
Real turnover in the retail sector also adjusted for sales days and holidays fell by 2.7% in September 2018 compared with the previous year. Real growth takes inflation into consideration. Compared with the previous month, real, seasonally adjusted retail trade turnover registered a decline of 1.6%.
EUR/USD
Resistance levels (open interest**, contracts)
$1.1572 (2860)
$1.1537 (2340)
$1.1487 (1942)
Price at time of writing this review: $1.1436
Support levels (open interest**, contracts):
$1.1388 (4882)
$1.1360 (3720)
$1.1325 (3296)
Comments:
- Overall open interest on the CALL options and PUT options with the expiration date November, 19 is 90551 contracts (according to data from November, 1) with the maximum number of contracts with strike price $1,1450 (4882);
GBP/USD
Resistance levels (open interest**, contracts)
$1.3226 (2310)
$1.3155 (1258)
$1.3104 (1030)
Price at time of writing this review: $1.3028
Support levels (open interest**, contracts):
$1.2964 (2426)
$1.2937 (3343)
$1.2905 (1325)
Comments:
- Overall open interest on the CALL options with the expiration date November, 19 is 26702 contracts, with the maximum number of contracts with strike price $1,3500 (3165);
- Overall open interest on the PUT options with the expiration date November, 19 is 34270 contracts, with the maximum number of contracts with strike price $1,3000 (3343);
- The ratio of PUT/CALL was 1.28 versus 1.25 from the previous trading day according to data from November, 1
* - The Chicago Mercantile Exchange bulletin (CME) is used for the calculation.
** - Open interest takes into account the total number of option contracts that are open at the moment.
As reported by the Federal Statistical Office (Destatis), the index of import prices increased by 4.4% in September 2018 compared with the corresponding month of the preceding year. In August and in July 2018 the annual rates of change were +4.8%, each. From August 2018 to September 2018 the index rose by 0.4%.
The index of import prices, excluding crude oil and mineral oil products, increased by 2.3% compared with the level of a year earlier.
The index of export prices increased by 1.9% in September 2018 compared with the corresponding month of the preceding year. In August and in July 2018 the annual rates of change were +2.1% and +1.7%, respectively. From August 2018 to September 2018 the export price index did not change.
China's Xi wants to make a fair trade deal, 'we have to make a right deal'
Australian retail turnover rose 0.2 per cent in September 2018, seasonally adjusted, according to the latest Australian Bureau of Statistics (ABS) Retail Trade figures.
This follows a 0.3 per cent rise in August 2018.
"Food retailing (0.4 per cent) led the rises," said Ben James, Director of Quarterly Economy Wide Surveys. "There was also a rise in cafés, restaurants and takeaways, which rose 0.5 per cent."
The rises were offset by a fall in clothing, footwear and personal accessories (-1.2 per cent), while three industries were relatively unchanged: Other retailing (0.0 per cent), household goods (0.0 per cent), and department stores (0.0 per cent).
In seasonally adjusted terms, there were rises in Victoria (0.7 per cent), Queensland (0.4 per cent), South Australia (0.4 per cent), and Tasmania (0.7 per cent). There were falls in New South Wales (-0.4 per cent) and the Northern Territory (-1.0 per cent), while Western Australia and the Australian Capital Territory were relatively unchanged (0.0 per cent) in September 2018.
Final demand (excl. Exports):
Rose 0.8% in the september quarter 2018.
Mainly due to rises in the prices received for heavy and civil engineering construction (+1.0%), petroleum refining and petroleum fuel manufacturing (+5.2%) and computer and electronic equipment manufacturing (+2.7%).
Partly offset by falls in the prices received for cleaning compound and toiletry preparation manufacturing (-3.1%).
Rose 2.1% through the year to the september quarter 2018.
Intermediate demand:
Rose 1.2% in the september quarter 2018.
Mainly due to rises in the prices received for sheep, beef cattle and grain farming; and dairy cattle farming (+8.8%), petroleum refining and petroleum fuel manufacturing (+6.8%) and electricity supply; gas supply; and water supply, sewerage and drainage services (+1.8%).
Partly offset by falls in the prices received for sugar and confectionery manufacturing (-2.7%), basic non-ferrous metal manufacturing (-1.8%) and real estate services (-0.5%).
Rose 4.7% through the year to the september quarter 2018.
Raw materials | Closing price | % change |
Oil | $63.60 | -5.90% |
Gold | $1,234.40 | -0.11% |


© 2000-2024. All rights reserved.
This site is managed by Teletrade D.J. LLC 2351 LLC 2022 (Euro House, Richmond Hill Road, Kingstown, VC0100, St. Vincent and the Grenadines).
The information on this website is for informational purposes only and does not constitute any investment advice.
The company does not serve or provide services to customers who are residents of the US, Canada, Iran, The Democratic People's Republic of Korea, Yemen and FATF blacklisted countries.
Making transactions on financial markets with marginal financial instruments opens up wide possibilities and allows investors who are willing to take risks to earn high profits, carrying a potentially high risk of losses at the same time. Therefore you should responsibly approach the issue of choosing the appropriate investment strategy, taking the available resources into account, before starting trading.
Use of the information: full or partial use of materials from this website must always be referenced to TeleTrade as the source of information. Use of the materials on the Internet must be accompanied by a hyperlink to teletrade.org. Automatic import of materials and information from this website is prohibited.
Please contact our PR department if you have any questions or need assistance at pr@teletrade.global.
transfers