- Analytics
- News and Tools
- Market News
CFD Markets News and Forecasts — 01-05-2018
| raw materials | closing price | % change |
| Oil | 67.50 | -1.56% |
| Gold | 1,304.60 | -1.11% |
| index | closing price | change items | % change |
| Nikkei | +40.16 | 22508.03 | +0.18% |
| TOPIX | -3.05 | 1774.18 | -0.17% |
| Euro Stoxx 50 | -0.26 | 3536.26 | -0.01% |
| FTSE 100 | +11.06 | 7520.36 | +0.15% |
| DJIA | -64.10 | 24099.05 | -0.27% |
| S&P 500 | +6.75 | 2654.80 | +0.25% |
| NASDAQ | +64.44 | 7130.70 | +0.91% |
| S&P/TSX | +11.05 | 15618.93 | +0.07% |
| Pare | Closed | % change |
| EUR/USD | $1,1992 | -0,71% |
| GBP/USD | $1,3612 | -1,14% |
| USD/CHF | Chf0,99634 | +0,59% |
| USD/JPY | Y109,84 | +0,53% |
| EUR/JPY | Y131,76 | -0,18% |
| GBP/JPY | Y149,439 | -0,67% |
| AUD/USD | $0,7488 | -0,56% |
| NZD/USD | $0,7006 | -0,40% |
| USD/CAD | C$1,28459 | +0,07% |
| Time | Region | Event | Period | Previous | Forecast |
| 01:45 | New Zealand | Employment Change, q/q | I quarter | 0.5% | 0.4% |
| 01:45 | New Zealand | Unemployment Rate | I quarter | 4.5% | 4.5% |
| 04:45 | China | Markit/Caixin Manufacturing PMI | April | 51.0 | 50.9 |
| 08:00 | Japan | Consumer Confidence | April | 44.3 | 44.6 |
| 08:45 | Switzerland | SECO Consumer Climate | II sq. M | 5 | 6 |
| 10:15 | Switzerland | Retail Sales (MoM) | March | 0.3% | |
| 10:15 | Switzerland | Retail Sales Y/Y | March | -0.2% | 0.3% |
| 10:30 | Switzerland | Manufacturing PMI | April | 60.3 | 60.0 |
| 10:50 | France | Manufacturing PMI | April | 53.7 | 53.4 |
| 10:55 | Germany | Manufacturing PMI | April | 58.2 | 58.1 |
| 11:00 | Eurozone | Manufacturing PMI | April | 56.6 | 56.0 |
| 11:30 | United Kingdom | PMI Construction | April | 47 | 50.5 |
| 12:00 | Eurozone | Unemployment Rate | March | 8.5% | 8.5% |
| 12:00 | Eurozone | GDP (YoY) | I quarter | 2.7% | 2.5% |
| 12:00 | Eurozone | GDP (QoQ) | I quarter | 0.6% | 0.4% |
| 15:15 | USA | ADP Employment Report | April | 241 | 200 |
| 17:30 | USA | Crude Oil Inventories | April | 2.17 | 1.267 |
| 19:00 | Germany | German Buba President Weidmann Speaks | | | |
| 21:00 | USA | Fed Interest Rate Decision | | 1.75% | 1.75% |
| 21:00 | USA | FOMC Statement | | | |
Major US stock indexes finished trading mostly in positive territory, as a significant increase in shares of the conglomerate sector was compensated by the drop in quotations of the sector of industrial goods and the base materials sector.
In addition, the results of the survey indicated a sharp improvement in business activity in the US manufacturing sector. The last PMI value was the highest since September 2014, supported by stronger expansions and new orders. In addition, the new business has risen at the strongest pace for more than three and a half years. Meanwhile, the inflation rates of purchasing and selling prices have accelerated to the highest levels since mid-2011. The seasonally adjusted final purchasing managers index (PMI) in the US industry from IHS Markit rose to 56.5 in April, compared to 55.6 in March, and indicated the strongest growth in manufacturing activity in three and a half years. The rate of improvement was also significantly higher than the long-term average.
At the same time, the report from the Institute for Supply Management (ISM) showed that in April, activity in the US manufacturing sector decreased more than forecasted. The PMI index for the manufacturing sector fell to 57.3 points against 59.3 points in March. Analysts had expected the figure to drop to 58.3.
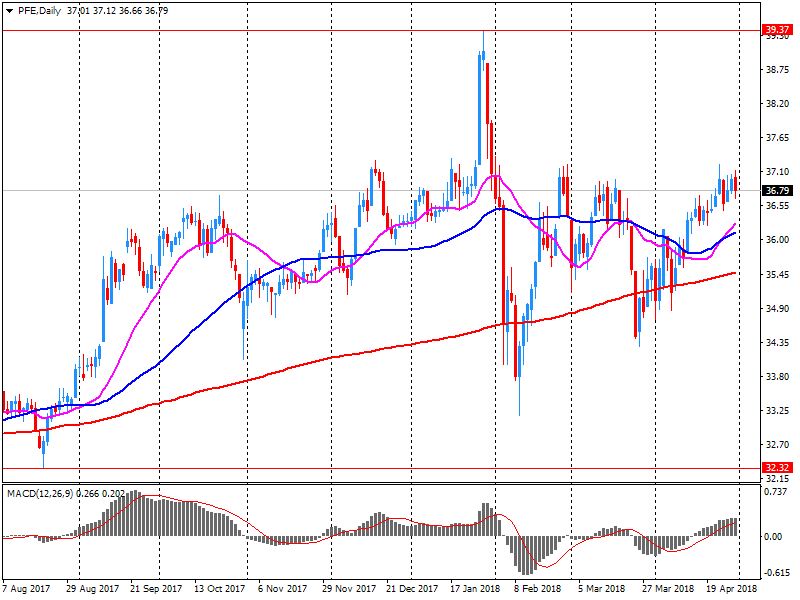
Most of the components of DOW finished trading in the red (22 of 30). The outsider was Pfizer (PFE, -3.56%). The leader of growth was shares of Intel Corporation (INTC, + 3.41%).
Most sectors of the S & P recorded a rise. The conglomerate sector grew most (+ 1.8%). The sector of industrial goods showed the greatest decrease (-0.7%).
At closing:
Dow 24,099.05 -64.10 -0.27%
S&P 500 2,654.80 +6.75 +0.25%
Nasdaq 100 7,130.70 +64.44 +0.91%
U.S. stock-index futures were flat on Tuesday, as investors remained cautious ahead of tonight's earnings release from Apple (AAPL; +0.4%) and tomorrow's announcement of the outcomes of the Federal Open Market Committee's May meeting.
Global Stocks:
| Index/commodity | Last | Today's Change, points | Today's Change, % |
| Nikkei | 22,508.03 | +40.16 | +0.18% |
| Hang Seng | - | - | - |
| Shanghai | - | - | - |
| S&P/ASX | 6,015.20 | +32.50 | +0.54% |
| FTSE | 7,543.97 | +34.67 | +0.46% |
| CAC | - | - | - |
| DAX | - | - | - |
| Crude | $67.84 | | -1.06% |
| Gold | $1,310.10 | | -0.69% |
(company / ticker / price / change ($/%) / volume)
| 3M Co | MMM | 194.01 | -0.38(-0.20%) | 1336 |
| ALTRIA GROUP INC. | MO | 56.1 | -0.01(-0.02%) | 7217 |
| Amazon.com Inc., NASDAQ | AMZN | 1,571.00 | 4.87(0.31%) | 19611 |
| Apple Inc. | AAPL | 166.53 | 1.27(0.77%) | 220382 |
| AT&T Inc | T | 32.77 | 0.07(0.21%) | 114301 |
| Barrick Gold Corporation, NYSE | ABX | 13.32 | -0.15(-1.11%) | 6552 |
| Boeing Co | BA | 333 | -0.56(-0.17%) | 7057 |
| Caterpillar Inc | CAT | 143.96 | -0.40(-0.28%) | 2281 |
| Chevron Corp | CVX | 124.75 | -0.36(-0.29%) | 560 |
| Cisco Systems Inc | CSCO | 44.13 | -0.16(-0.36%) | 4163 |
| Citigroup Inc., NYSE | C | 68.44 | 0.17(0.25%) | 8980 |
| Exxon Mobil Corp | XOM | 77.35 | -0.40(-0.51%) | 5945 |
| Facebook, Inc. | FB | 172.49 | 0.49(0.28%) | 54934 |
| Ford Motor Co. | F | 11.26 | 0.02(0.18%) | 2427 |
| Freeport-McMoRan Copper & Gold Inc., NYSE | FCX | 15.2 | -0.01(-0.07%) | 1175 |
| General Electric Co | GE | 14.08 | 0.01(0.07%) | 33221 |
| Goldman Sachs | GS | 238.6 | 0.27(0.11%) | 769 |
| Google Inc. | GOOG | 1,020.00 | 2.67(0.26%) | 6460 |
| Home Depot Inc | HD | 184.5 | -0.30(-0.16%) | 887 |
| Intel Corp | INTC | 51.69 | 0.07(0.14%) | 21634 |
| International Business Machines Co... | IBM | 144.9 | -0.06(-0.04%) | 11446 |
| Johnson & Johnson | JNJ | 127 | 0.51(0.40%) | 1353 |
| JPMorgan Chase and Co | JPM | 108.51 | -0.27(-0.25%) | 1905 |
| McDonald's Corp | MCD | 166.95 | -0.49(-0.29%) | 11125 |
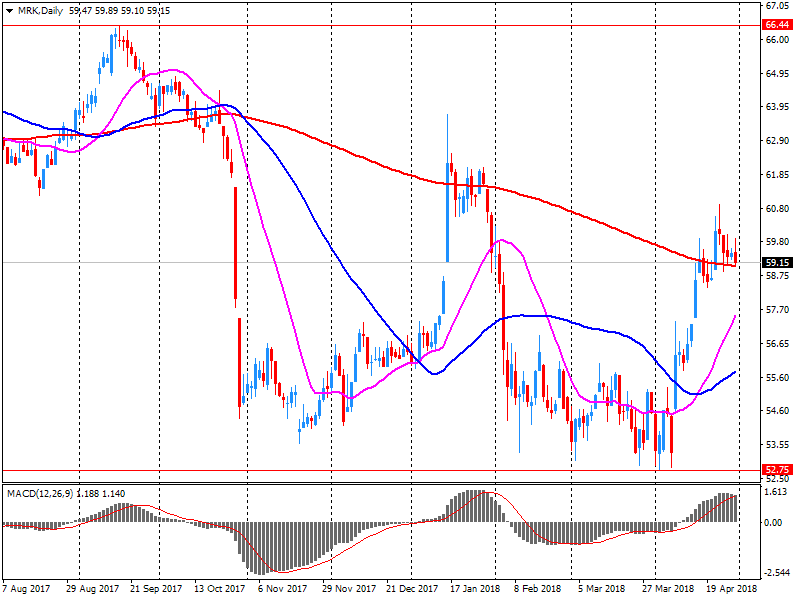
| Merck & Co Inc | MRK | 58.25 | -0.62(-1.05%) | 14723 |
| Microsoft Corp | MSFT | 93.51 | -0.01(-0.01%) | 21143 |
| Pfizer Inc | PFE | 36.1 | -0.51(-1.39%) | 46016 |
| Procter & Gamble Co | PG | 72.23 | -0.11(-0.15%) | 4408 |
| Starbucks Corporation, NASDAQ | SBUX | 57.5 | -0.07(-0.12%) | 493 |
| Tesla Motors, Inc., NASDAQ | TSLA | 294.25 | 0.35(0.12%) | 11551 |
| The Coca-Cola Co | KO | 43.3 | 0.09(0.21%) | 4854 |
| Twitter, Inc., NYSE | TWTR | 30.45 | 0.14(0.46%) | 175035 |
| United Technologies Corp | UTX | 120.01 | -0.14(-0.12%) | 444 |
| Verizon Communications Inc | VZ | 49.5 | 0.15(0.30%) | 7065 |
| Visa | V | 126.35 | -0.54(-0.42%) | 124 |
| Wal-Mart Stores Inc | WMT | 88.07 | -0.39(-0.44%) | 2834 |
| Walt Disney Co | DIS | 100.1 | -0.23(-0.23%) | 2164 |
Apple (AAPL) initiated with Buy at DA Davidson; target $220
McDonald's (MCD) target raised to $168 from $165 at Stifel
Pfizer (PFE) reported Q1 FY 2018 earnings of $0.77 per share (versus $0.69 in Q1 FY 2017), beating analysts' consensus estimate of $0.74.
The company's quarterly revenues amounted to $12.906 bln (+1.0% y/y), missing analysts' consensus estimate of $13.138 bln.
The company also reaffirmed its guidance for FY 2018, projecting EPS of $2.90-3.00 (versus analysts' consensus estimate of $2.95) at revenues of $53.5-55.5 bln (versus analysts' consensus estimate of $54.45 bln).
PFE fell to $35.98 (-1.72%) in pre-market trading.
Merck (MRK) reported Q1 FY 2018 earnings of $1.05 per share (versus $0.88 in Q1 FY 2017), beating analysts' consensus estimate of $1.00.
The company's quarterly revenues amounted to $10.037 bln (+6.4% y/y), generally in-line with analysts' consensus estimate of $10.088 bln.
The company also raised guidance for FY 2018, projecting EPS of $4.16-4.28 (compared to its prior forecast of $4.08-4.23 and analysts' consensus estimate of $4.19) and revenue of $41.8-43.0 bln (compared to its prior forecast of $41.2-42.7 bln and analysts' consensus estimate of $41.86 bln).
MRK rose to $58.90 (+0.05%) in pre-market trading.
Rates of expansion eased for output, new orders and employment, in part reflecting a weakening in the pace of expansion of new work from abroad. On the price front, input cost and output charge inflation moderated and, although still elevated, are below the highs seen at the turn of the year.
The seasonally adjusted IHS Markit/CIPS Purchasing Managers' Index fell to a 17- month low of 53.9 in April, down from 54.9 in March. The PMI has signalled expansion in each of the past 21 months.
EUR/USD
Resistance levels (open interest**, contracts)
$1.2214 (796)
$1.2179 (2138)
$1.2155 (736)
Price at time of writing this review: $1.2058
Support levels (open interest**, contracts):
$1.1992 (3138)
$1.1946 (1846)
$1.1898 (1183)
Comments:
- Overall open interest on the CALL options and PUT options with the expiration date May, 4 is 88835 contracts (according to data from April, 30) with the maximum number of contracts with strike price $1,2650 (4216);
GBP/USD
Resistance levels (open interest**, contracts)
$1.4003 (735)
$1.3956 (1061)
$1.3912 (485)
Price at time of writing this review: $1.3749
Support levels (open interest**, contracts):
$1.3676 (2010)
$1.3637 (876)
$1.3594 (632)
Comments:
- Overall open interest on the CALL options with the expiration date May, 4 is 23028 contracts, with the maximum number of contracts with strike price $1,4400 (3253);
- Overall open interest on the PUT options with the expiration date May, 4 is 25995 contracts, with the maximum number of contracts with strike price $1,3750 (2283);
- The ratio of PUT/CALL was 1.13 versus 1.15 from the previous trading day according to data from April, 30
* - The Chicago Mercantile Exchange bulletin (CME) is used for the calculation.
** - Open interest takes into account the total number of option contracts that are open at the moment.
Japan's manufacturing sector expanded at a quickened pace during April amid improved growth rates in output and new orders. With robust demand exerting pressure on the production line, firms enhanced operating capacities by raising employment. Nonetheless, greater staff levels did not prevent backlogs of work from increasing. On the price front, inflation rates for both input costs and output charges softened.
The headline Nikkei Japan Manufacturing Purchasing Managers' Index (PMI) posted 53.8 in April, up from 53.1 in March to signal a solid improvement in operating conditions for Japanese manufacturers
-
Housing markets have slowed in sydney, melbourne
-
A$ remains in range of past couple of years
-
Rising a$ would lead to slower economic pick up
-
Central forecast for australian economy to grow faster than a year ago
-
Progress on unemployment and inflation expected to be gradual
-
Sees GDP growth to average a bit above 3 pct in 2018, 2019
-
Expects gradual pick up in inflation as economy strengthens
-
Inflation likely to remain low for some time
-
Steady policy consistent with growth, inflation targets


© 2000-2024. All rights reserved.
This site is managed by Teletrade D.J. LLC 2351 LLC 2022 (Euro House, Richmond Hill Road, Kingstown, VC0100, St. Vincent and the Grenadines).
The information on this website is for informational purposes only and does not constitute any investment advice.
The company does not serve or provide services to customers who are residents of the US, Canada, Iran, The Democratic People's Republic of Korea, Yemen and FATF blacklisted countries.
Making transactions on financial markets with marginal financial instruments opens up wide possibilities and allows investors who are willing to take risks to earn high profits, carrying a potentially high risk of losses at the same time. Therefore you should responsibly approach the issue of choosing the appropriate investment strategy, taking the available resources into account, before starting trading.
Use of the information: full or partial use of materials from this website must always be referenced to TeleTrade as the source of information. Use of the materials on the Internet must be accompanied by a hyperlink to teletrade.org. Automatic import of materials and information from this website is prohibited.
Please contact our PR department if you have any questions or need assistance at pr@teletrade.global.
transfers