- Analytics
- News and Tools
- Market News
CFD Markets News and Forecasts — 01-02-2019
A report from the Institute for Supply Management (ISM) showed the U.S. manufacturing sector expanded in January at a faster pace than in December.
The ISM's index of manufacturing activity came in at 56.6 percent last month, up 2.3 percentage points from the December reading of 54.3 percent, exceeding economists' forecast for a 54.2 percent reading. A reading above 50 percent indicates expansion, while a reading below 50 percent indicates contraction.
The monthly gain by the headline index was primarily attributable to faster increases in the new orders index (+6.9 percentage points m-o-m to 58.2 percent in January) the production index (+6.4 percentage points m-o-m to 60.5 percent) and the inventories index (+1.6 percentage points m-o-m to 52.8 percent) Meanwhile, employment index registered a slight decrease (-0.5 percentage point m-o-m to 55.5 percent).
Timothy R. Fiore, Chair of the ISM Manufacturing Business Survey Committee said, “The past relationship between the PMI and the overall economy indicates that the PMI for January (56.6 percent) corresponds to a 4-percent increase in real gross domestic product (GDP) on an annualized basis.”
The final reading for the January Reuters/Michigan index of consumer sentiment came in at 91.2 compared to a preliminary reading of 90.7 and the December final reading of 98.3. Economists had forecast the index to be revised upwardly to 90.8.
The report noted the consumer sentiment remained at month-end at its lowest level since Trump was elected. The end of the shutdown caused only a modest boost in the index.
According to the report, the index of the current economic conditions fell to 108.8 from December's final reading of 116.1.
Meanwhile, the index of consumer expectations decreased to 79.9 from December’s final reading of 87.0.
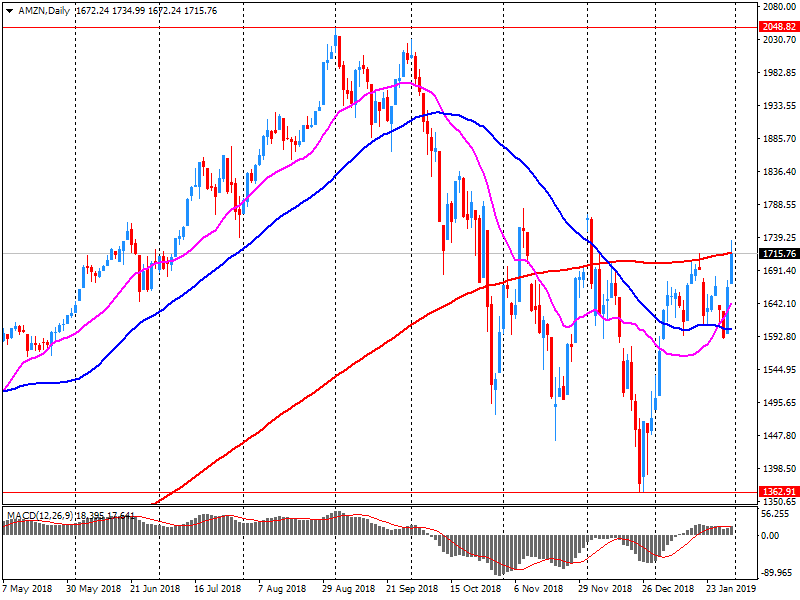
U.S. stock-index were mixed on Friday, as investors digested stronger-than-expected U.S. job growth for January, disappointing outlook from Amazon (AMZN) and the latest raft of earnings reports.
Global Stocks:
Index/commodity | Last | Today's Change, points | Today's Change, % |
Nikkei | 20,788.39 | +14.90 | +0.07% |
Hang Seng | 27,930.74 | -11.73 | -0.04% |
Shanghai | 2,618.23 | +33.66 | +1.30% |
S&P/ASX | 5,862.80 | -1.90 | -0.03% |
FTSE | 6,999.78 | +30.93 | +0.44% |
CAC | 4,999.96 | +7.24 | +0.15% |
DAX | 11,177.54 | +4.44 | +0.04% |
Crude | $54.01 | +0.41% | |
Gold | $1,327.20 | +0.15% |
(company / ticker / price / change ($/%) / volume)
3M Co | MMM | 201.5 | 1.20(0.60%) | 1243 |
ALCOA INC. | AA | 29.6 | -0.08(-0.27%) | 200 |
ALTRIA GROUP INC. | MO | 49.5 | 0.15(0.30%) | 7924 |
Amazon.com Inc., NASDAQ | AMZN | 1,646.50 | -72.23(-4.20%) | 294075 |
American Express Co | AXP | 102.95 | 0.25(0.24%) | 5172 |
Apple Inc. | AAPL | 167.01 | 0.57(0.34%) | 171651 |
AT&T Inc | T | 29.95 | -0.11(-0.37%) | 64447 |
Boeing Co | BA | 386.83 | 1.21(0.31%) | 14741 |
Caterpillar Inc | CAT | 133.57 | 0.41(0.31%) | 4073 |
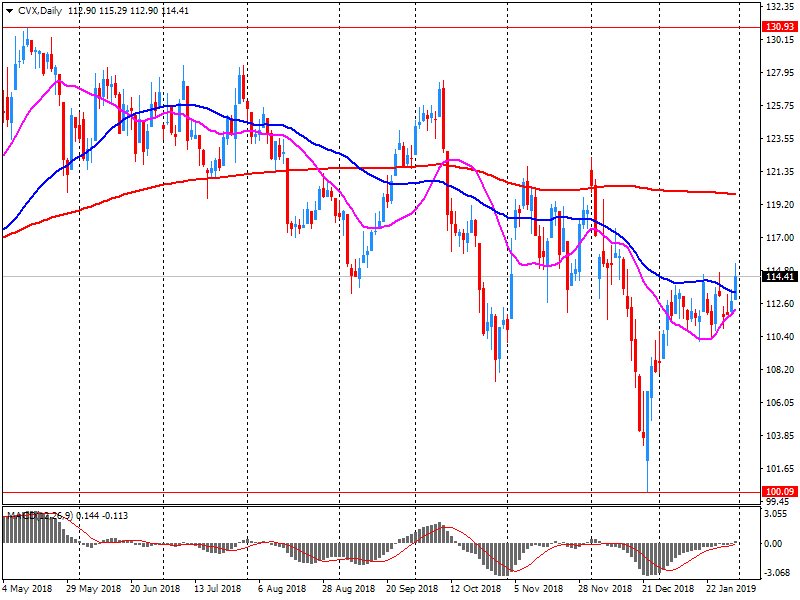
Chevron Corp | CVX | 116.95 | 2.30(2.01%) | 59663 |
Cisco Systems Inc | CSCO | 47.52 | 0.23(0.49%) | 10724 |
Citigroup Inc., NYSE | C | 64.17 | 0.16(0.25%) | 23823 |
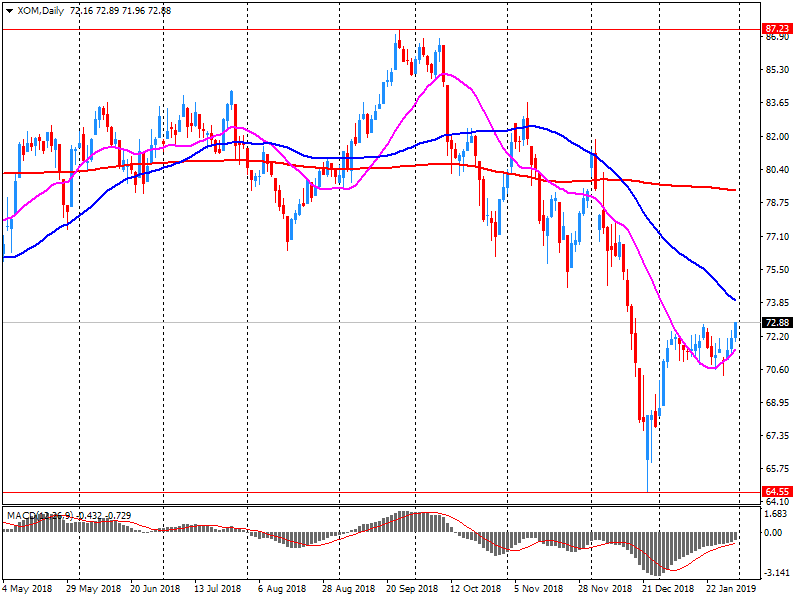
Exxon Mobil Corp | XOM | 74.9 | 1.62(2.21%) | 528910 |
Facebook, Inc. | FB | 166.93 | 0.24(0.14%) | 210318 |
FedEx Corporation, NYSE | FDX | 178.25 | 0.68(0.38%) | 1279 |
Freeport-McMoRan Copper & Gold Inc., NYSE | FCX | 11.46 | -0.18(-1.55%) | 5528 |
General Electric Co | GE | 10.09 | -0.07(-0.69%) | 958190 |
Goldman Sachs | GS | 198.5 | 0.49(0.25%) | 14827 |
Google Inc. | GOOG | 1,108.23 | -8.14(-0.73%) | 4327 |
Hewlett-Packard Co. | HPQ | 22.05 | 0.02(0.09%) | 10339 |
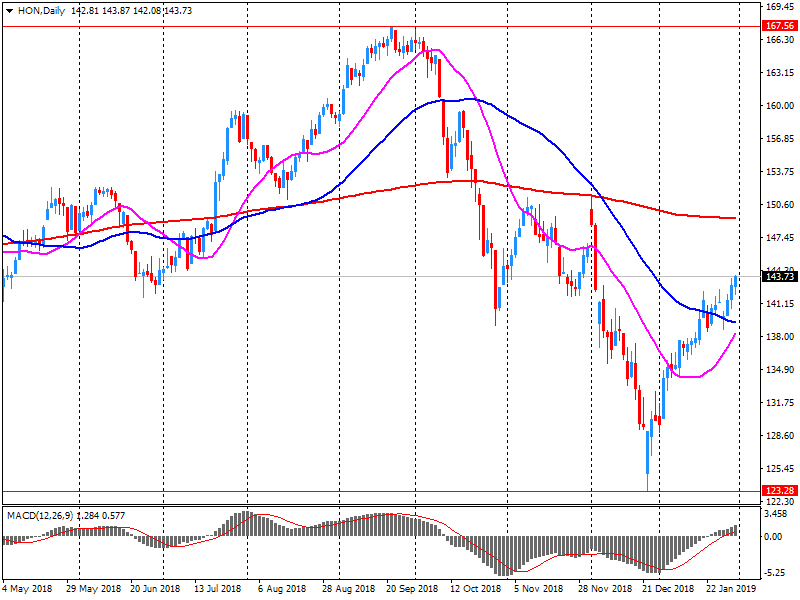
HONEYWELL INTERNATIONAL INC. | HON | 147.1 | 3.47(2.42%) | 21601 |
Intel Corp | INTC | 47.15 | 0.03(0.06%) | 24469 |
International Business Machines Co... | IBM | 134.74 | 0.32(0.24%) | 4271 |
Johnson & Johnson | JNJ | 134.36 | 1.28(0.96%) | 13730 |
JPMorgan Chase and Co | JPM | 103.9 | 0.40(0.39%) | 10010 |
McDonald's Corp | MCD | 179.65 | 0.87(0.49%) | 5153 |
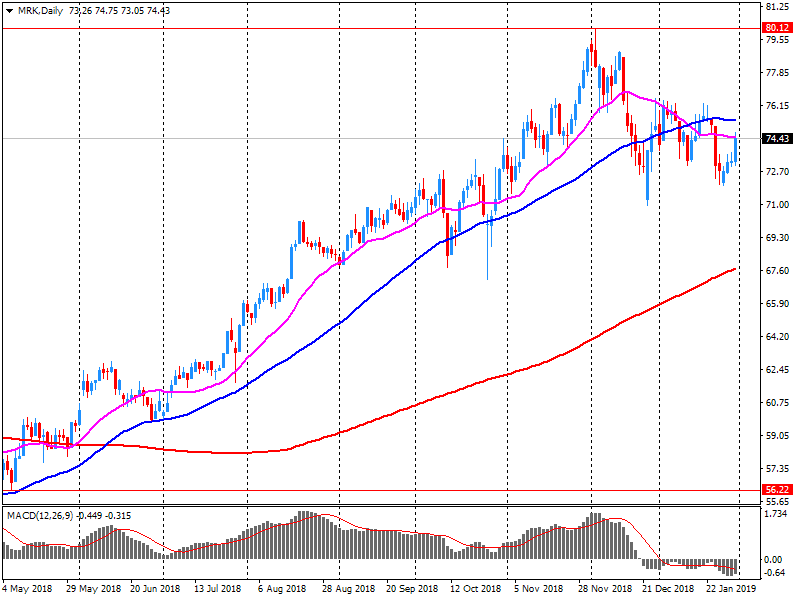
Merck & Co Inc | MRK | 76.04 | 1.61(2.16%) | 33519 |
Microsoft Corp | MSFT | 104.58 | 0.15(0.14%) | 58881 |
Nike | NKE | 82.05 | 0.17(0.21%) | 3885 |
Pfizer Inc | PFE | 42.55 | 0.10(0.24%) | 9225 |
Procter & Gamble Co | PG | 96.8 | 0.33(0.34%) | 1252 |
Starbucks Corporation, NASDAQ | SBUX | 68.89 | 0.75(1.10%) | 8219 |
Tesla Motors, Inc., NASDAQ | TSLA | 305.4 | -1.62(-0.53%) | 33941 |
The Coca-Cola Co | KO | 48.5 | 0.37(0.77%) | 6931 |
Twitter, Inc., NYSE | TWTR | 33.6 | 0.04(0.12%) | 69218 |
United Technologies Corp | UTX | 119.11 | 1.04(0.88%) | 6248 |
UnitedHealth Group Inc | UNH | 266 | -4.20(-1.55%) | 2851 |
Verizon Communications Inc | VZ | 55.18 | 0.12(0.22%) | 3085 |
Visa | V | 135.05 | 0.04(0.03%) | 11139 |
Wal-Mart Stores Inc | WMT | 96.25 | 0.42(0.44%) | 7845 |
Walt Disney Co | DIS | 111.58 | 0.06(0.05%) | 12678 |
Yandex N.V., NASDAQ | YNDX | 33.2 | -0.38(-1.13%) | 46429 |
Chevron (CVX) reported Q4 FY 2018 earnings of $1.95 per share (versus $1.64 in Q4 FY 2017), beating analysts’ consensus estimate of $1.89.
The company’s quarterly revenues amounted to $42.352 bln (+12.6% y/y), beating analysts’ consensus estimate of $41.464 bln.
CVX rose to $116.30 (+1.44%) in pre-market trading.
Goldman Sachs (GS) downgraded to Sell from Hold at Societe Generale
General Electric (GE) downgraded to Hold from Buy at Vertical Research
DowDuPont (DWDP) downgraded to Neutral from Overweight at JP Morgan; target $53
The U.S. Labor Department announced that nonfarm payrolls increased by 304,000 in January after a downwardly revised 222,000 gain in the prior month (originally an increase of 312,000).
According to the report, employment rose in grew in several industries, including leisure and hospitality (+74,000 jobs), construction (+52,000), health care (42,000), and transportation and warehousing (27,000). There were no discernible impacts of the partial federal government shutdown on the estimates of employment, hours, and earnings from the establishment survey, the report added.
At the same time, the unemployment rate rose by 0.1 percentage point to 4.0 percent in January, which was the highest jobless rate since June 2018.
Economists had forecast 165,000 new jobs and the jobless rate to stay at 3.9 percent.
The labor force participation rate rose to 63.2 percent in January from 63.1 percent in December, while hourly earnings for private-sector workers edged up 0.1 percent m-o-m (3 cents) to $27.56, following an unrevised 0.4 percent m-o-m gain in December. Economists had forecast a 0.3 percent m-o-m advance in the average hourly earnings. Over the year, average hourly earnings have increased by 85 cents or 3.2 percent.
The average workweek was unchanged at34.5 hours in January, matching economist’s’ forecast.
Exxon Mobil (XOM) reported Q4 FY 2018 earnings of $1.41 per share (versus $0.88 in Q4 FY 2017), beating analysts’ consensus estimate of $1.09.
The company’s quarterly revenues amounted to $71.895 bln (+8.1% y/y), missing analysts’ consensus estimate of $78.871 bln.
XOM rose to $75.80 (+3.44%) in pre-market trading.
Merck (MRK) reported Q4 FY 2018 earnings of $1.04 per share (versus $0.98 in Q4 FY 2017), beating analysts’ consensus estimate of $1.03.
The company’s quarterly revenues amounted to $10.988 bln (+5.4% y/y), generally in line with analysts’ consensus estimate of $10.929 bln.
The company also issued in-line guidance for FY 2019, projecting EPS of $4.57-4.72 (versus analysts’ consensus estimate of $4.70) and revenues of $43.2-44.7 bln (versus analysts’ consensus estimate of $44.42 bln).
MRK rose to $75.45 (+1.37%) in pre-market trading.
Honeywell (HON) reported Q4 FY 2018 earnings of $1.91 per share (versus $1.85 in Q4 FY 2017), beating analysts’ consensus estimate of $1.89.
The company’s quarterly revenues amounted to $9.729 bln (-10.3% y/y), generally in line with analysts’ consensus estimate of $9.722 bln.
The company also issued downside guidance for FY 2019, projecting revenues of $36.0-36.9 bln versus analysts’ consensus estimate of $37.12 bln.
HON rose to $145.72 (+1.46%) in pre-market trading.
Amazon (AMZN) reported Q4 FY 2018 earnings of $6.04 per share (versus $2.19 in Q4 FY 2017), beating analysts’ consensus estimate of $5.51.
The company’s quarterly revenues amounted to $72.383 bln (+19.7% y/y), generally in line with analysts’ consensus estimate of $71.946 bln.
The company also issued downside guidance for Q1 FY 2019, projecting revenues of $56-60 bln (versus analysts’ consensus estimate of $61.04 bln) and operating income of $2.3-3.3 bln (versus analysts’ consensus estimate of $3.0 bln).
AMZN fell to $1,646.00 (-4.23%) in pre-market trading.
Euro zone inflation slips
The Eurostat reported it flash estimate revealed Euro area annual inflation rose 1.4 percent in January 2019, decelerating from 1.6 percent in December 2018. The reading was in line with the economists’ expectation.
Looking at the main components of euro area inflation, energy had the highest annual rate in January (+2.6 percent y-o-y), followed by food, alcohol & tobacco (+1.8 percent y-o-y), services (+1.6 percent y-o-y) and non-energy industrial goods (+0.3 percent y-o-y).
Meanwhile, the core indicator, which excludes volatile energy and unprocessed food prices, increased to 1.2 percent in January, above economists’ forecast of an unchanged 1.1 percent reading.
A narrower measure that excludes energy, food, alcohol and tobacco rose to 1.1 percent, also above economists’ expectation of an unchanged 1.0 percent reading.
The headline seasonally adjusted IHS Markit/CIPS Purchasing Managers’ Index (PMI) fell to a three-month low of 52.8 in January from 54.2 in December The reading was the second-weakest since July 2016 and was below economists forecast of 53.5.
According to the report, the trend in production volumes was the weakest registered during the past two-and-a-half years and new order inflows recorded a marked slowdown in the rate of expansion. Employment fell for only the second time in the past two-and-a-half years Meanwhile, inventories of finished goods rose at the third-fastest rate in the survey history, bested only by those seen in May and December of 2018. On the price front, inflation of input prices eased to a 32-month low, despite higher raw material costs, suppliers raising their prices and the exchange rate. Average selling prices also increased at a slower pace.
Final data released by IHS Markit showed that manufacturing operating conditions in the Eurozone improved at the slowest rate for over four years in January.
The IHS Markit Eurozone Manufacturing PMI came in at 50.5 last month, down from 51.4 in December, unchanged from the flash estimate. That was the lowest reading since November 2014.
Volumes of new orders placed with Eurozone manufacturers recorded the sharpest contraction since April 2013 as domestic and international demand deteriorated further. In addition, backlogs of work fell for a fifth successive month and output growth was the weakest registered in the current 67-month run of expansion. Stocks of finished goods meanwhile increased in January for a fourth month in succession and to the greatest degree since the survey began over 20 years ago. Job creation was the softest since September 2016. On the price front, average input costs continued to increase during January, but at a noticeably slower rate with inflation dropping to its lowest level for nearly two-and-a-half years. Downward price pressure came from a reduction in the cost of oil-related goods plus signs of easing capacity constraints.
Nation-wise, Germany entered contraction territory for the first time in over four years whilst the downturn in Italy gathered pace. Despite recording relatively subdued readings, France and Spain bucked the trend across the region by recording firmer PMI numbers. All other nations recorded slower growth, with respective headline indices for the Netherlands, Austria and Ireland the weakest in around two-and-a-half years.
Final data released by IHS Markit and BME revealed that conditions across Germany's manufacturing sector worsened at the start of the year. The headline IHS Markit/BME Germany Manufacturing PMI fell to 49.7 in January from 51.5 in December, sliding below the 50.0 'no-change' mark for the first the first time in more than four years.
According to the report, the notable drop in the headline PMI since December was led by a deepening downturn in new orders, which contracted to the greatest extent in over six years. Part of the reason for lower order books was a drop in demand from international markets, with surveyed firms reporting decreases in sales to the US, UK, Italy, Turkey and Asia. Job creation also eased and was close to November's near two-year low, but remained elevated compared to the long-run average. There was also a sharp slowdown in the rate of purchase price inflation in January to the lowest since October 2016 due to recent falls in the price of oil and steel. Factory gate charge inflation meanwhile eased only slightly and was strong overall.
Final data released by IHS Markit revealed that operating conditions in France’s manufacturing sector improved modestly in January. The headline IHS Markit France Manufacturing Purchasing Managers' Index (PMI) came in at 51.2 last month, compared to a preliminary reading of 51.2 and a final reading of 49.7 in December 2018. That matched economists’ forecasts. A reading above 50 signals an expansion in activity, while a reading below this level signals a contraction.
However, the underlying data pointed to further contractions in key indicators such as output and new orders, though the rates of their declines were only fractional overall. At the same time, input price inflation eased to the softest in eight months. Optimism towards the business outlook reached a six-month high and employment recorded the fastest growth since September.
The survey released by the Schweizerischer Verband für Materialwirtschaft und Einkauf and Credit Suisse revealed the Swiss manufacturing sector continued to expand in January, albeit at a slower pace than in December 2018.
Switzerland’s SVME manufacturing PMI came in at 54.3 in January on a seasonally adjusted basis, down from the previous month's reading of 57.5. That was the lowest reading since August 2016.
Economists’ had predicted the reading to fall to 55.8.
The 50 mark divides contraction and expansion.
The Federal Statistical Office (FSO) reported retail sales in Switzerland decreased 0.3 percent y-o-y in December of 2018, following a revised 0.6 percent y-o-y decline in the previous month (originally a drop of 0.5 percent y-o-y). Economists had forecast a 0.1 percent advance.
Adjusted for sales days and holidays, the retail sector excluding service stations recorded a stagnation in nominal turnover in December 2018 compared with December 2017 (in real terms -0.2 percent). Retail sales of food, drinks and tobacco registered an increase in nominal turnover of 2.7 percent (in real terms +1.4 percent), whereas the non-food sector registered a nominal negative of 2.2 percent (in real terms -1.8 percent).
Excluding service stations, the retail sector showed a seasonally adjusted decline in nominal turnover of 0.6 percent compared with the previous month (in real terms -0.6 percent). Retail sales of food, drinks and tobacco registered a nominal minus of 1.4 percent (in real terms -1.2 percent). The non-food sector showed a minus of 0.5 percent (in real terms -0.5 percent).
State Secretariat for Economic Affairs SECO reported the consumer sentiment index increased to -4 points in the first quarter of 2019 from -6 points in the fourth quarter of 2018, remaining above its long-term average (-9 points). A score above zero indicates optimism, while a score below zero shows pessimism.
The SECO noted the sentiment has remained stable overall, with signs of a recovery and of a slowdown broadly balanced.
According to its survey undertaken in January 2019, consumers were feeling confident about the labor market, with the sub-index on anticipated unemployment falling significantly to 32 points. In addition, consumers’ assessment of job security has come in above average. The assessment of the households’ own budget situation also improved, helped by both the encouraging labor market prospects and the recent decline in inflation. However, the assessment of the economy in general deteriorated. Consumers felt that the economy had developed significantly worse over the past twelve months, mirroring the sharp decline in GDP growth.
Markit/Caixin’s survey revealed that overall operating conditions in the Chinese manufacturing sector continued softening in January.
The Caixin/Markit manufacturing purchasing managers' index (PMI) came in at 48.3 last month on a seasonally adjusted basis, down from the previous month's reading of 49.7. The latest PMI reading was the lowest since February 2016.
Economists’ had predicted the reading to fall to 49.5. The 50 mark divides contraction and expansion.
According to the survey, the output sub-index declined, highlighting the drag effect of softer demand on production. Meanwhile, the employment sub-index continued to rise moderately despite staying in negative territory as business confidence recorded a slight improvement. On the price front, both gauges for input costs and output charges dropped only slightly.
Final data released by IHS Markit revealed that activity growth in Japan’s manufacturing sector continued to expand in January, albeit at a slower pace.
The Nikkei Japan Manufacturing purchasing manager's index (PMI) came in at 50.3 last month, compared to a preliminary reading of 50.0 and a final reading of 52.6 in December 2018. That was the lowest reading since August 2016. Economists had expected the reading to remain unrevised at 50.0.
A reading above 50 signals an expansion in activity, while a reading below this level signals a contraction.
According to the report, the PMI was pulled down by coincident declines in both output and new orders for the first time in two-and-a-half years. Job creation in Japan’s manufacturing sector was nonetheless sustained during January as firms sought reinforcements to support growth. Business confidence fell for the eighth straight month.
On the price front, higher transportation, energy and material costs contributed to another monthly rise in purchasing prices. However, the rate of inflation was the slowest since December 2017. Nonetheless, output charges were raised to a stronger degree.
The Australian Bureau of Statistics (ABS) reported the final demand producer price index rose 0.5 percent q-o-q in the fourth quarter of 2018, following an unrevised 0.8 percent q-o-q increase in the prior quarter.
According to the report, the gain was mainly driven by rises in the prices received for heavy and civil engineering construction (+1.0 percent q-o-q), building construction (+0.4 percent q-o-q) and accommodation (+3.8 percent q-o-q), which, however, were partly offset by declines in the prices received for petroleum refining and petroleum fuel manufacturing (-10.6 percent q-o-q) and bakery product manufacturing (-2.7 percent q-o-q).
Intermediate demand producer prices advanced 0.4 percent q-o-q in the fourth quarter, while preliminary demand producer prices gained 0.4 percent.
In y-o-y terms, producer prices surged 2 percent in the fourth quarter, decelerating from 2.1 percent in the third quarter.
EUR/USD
Resistance levels (open interest**, contracts)
$1.1568 (3308)
$1.1535 (3288)
$1.1498 (600)
Price at time of writing this review: $1.1439
Support levels (open interest**, contracts):
$1.1424 (3329)
$1.1388 (3689)
$1.1345 (4076)
Comments:
- Overall open interest on the CALL options and PUT options with the expiration date February, 8 is 70130 contracts (according to data from January, 31) with the maximum number of contracts with strike price $1,1700 (4464);
GBP/USD
Resistance levels (open interest**, contracts)
$1.3193 (1569)
$1.3164 (1929)
$1.3146 (1206)
Price at time of writing this review: $1.3103
Support levels (open interest**, contracts):
$1.3048 (431)
$1.3015 (315)
$1.2977 (659)
Comments:
- Overall open interest on the CALL options with the expiration date February, 8 is 24026 contracts, with the maximum number of contracts with strike price $1,3000 (1929);
- Overall open interest on the PUT options with the expiration date February, 8 is 29037 contracts, with the maximum number of contracts with strike price $1,2600 (1930);
- The ratio of PUT/CALL was 1.21 versus 1.20 from the previous trading day according to data from January, 31
* - The Chicago Mercantile Exchange bulletin (CME) is used for the calculation.
** - Open interest takes into account the total number of option contracts that are open at the moment.
| Raw materials | Closed | Change, % |
|---|---|---|
| Brent | 61.1 | -0.84 |
| WTI | 54.06 | -0.44 |
| Silver | 16.04 | 0 |
| Gold | 1321.017 | 0.11 |
| Palladium | 1340.85 | -1.29 |
| Index | Change, points | Closed | Change, % |
|---|---|---|---|
| NIKKEI 225 | 216.95 | 20773.49 | 1.06 |
| Hang Seng | 299.62 | 27942.47 | 1.08 |
| KOSPI | -1.35 | 2204.85 | -0.06 |
| ASX 200 | -22 | 5864.7 | -0.37 |
| FTSE 100 | 27.22 | 6968.85 | 0.39 |
| DAX | -8.56 | 11173.1 | -0.08 |
| Dow Jones | -15.19 | 24999.67 | -0.06 |
| S&P 500 | 23.05 | 2704.1 | 0.86 |
| NASDAQ Composite | 98.66 | 7281.74 | 1.37 |
| Pare | Closed | Change, % |
|---|---|---|
| AUDUSD | 0.72741 | 0.38 |
| EURJPY | 124.603 | -0.44 |
| EURUSD | 1.14466 | -0.28 |
| GBPJPY | 142.703 | -0.17 |
| GBPUSD | 1.31097 | -0.01 |
| NZDUSD | 0.69175 | 0.35 |
| USDCAD | 1.31227 | -0.22 |
| USDCHF | 0.99437 | 0.03 |
| USDJPY | 108.852 | -0.16 |


© 2000-2024. All rights reserved.
This site is managed by Teletrade D.J. LLC 2351 LLC 2022 (Euro House, Richmond Hill Road, Kingstown, VC0100, St. Vincent and the Grenadines).
The information on this website is for informational purposes only and does not constitute any investment advice.
The company does not serve or provide services to customers who are residents of the US, Canada, Iran, The Democratic People's Republic of Korea, Yemen and FATF blacklisted countries.
Making transactions on financial markets with marginal financial instruments opens up wide possibilities and allows investors who are willing to take risks to earn high profits, carrying a potentially high risk of losses at the same time. Therefore you should responsibly approach the issue of choosing the appropriate investment strategy, taking the available resources into account, before starting trading.
Use of the information: full or partial use of materials from this website must always be referenced to TeleTrade as the source of information. Use of the materials on the Internet must be accompanied by a hyperlink to teletrade.org. Automatic import of materials and information from this website is prohibited.
Please contact our PR department if you have any questions or need assistance at pr@teletrade.global.
transfers