- Analytics
- News and Tools
- Market News
Analytics, News, and Forecasts for CFD Markets: currency news — 15-12-2017.
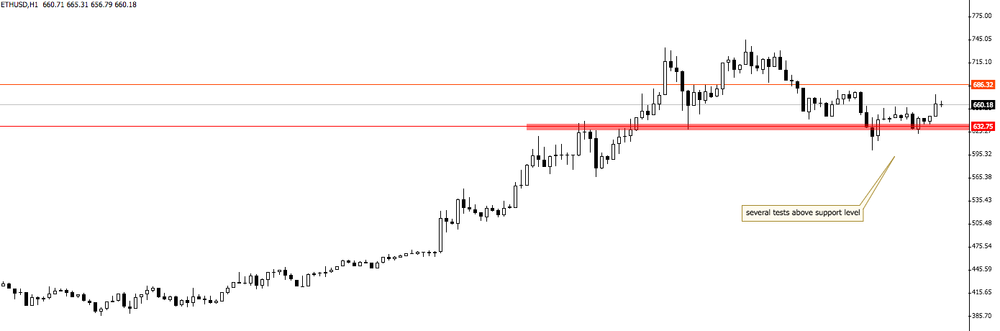
Ethereum has been following a bullish movement for several days.
However, now the price seems that it is in a slightly consolidation zone.
Besides that, it has rejected several times the support level.
Therefore, we can expect a further bullish movement soon.
Industrial production moved up 0.2 percent in November after posting an upwardly revised increase of 1.2 percent in October. Manufacturing production also rose 0.2 percent in November, its third consecutive monthly gain. The output of utilities dropped 1.9 percent. The index for mining increased 2.0 percent, as oil and gas extraction returned to normal levels after being held down in October by Hurricane Nate. Excluding the post-hurricane rebound in oil and gas extraction, total industrial production would have been unchanged in November. Total industrial production was 106.4 percent of its 2012 average in November and was 3.4 percent above its year-earlier level. Capacity utilization for the industrial sector was 77.1 percent in November, a rate that is 2.8 percentage points below its long-run (1972-2016) average.
Manufacturing sales declined 0.4% to $53.5 billion in October, following two consecutive monthly increases.
Sales fell in 8 of 21 industries, representing 56.0% of the manufacturing sector. Sales of motor vehicles and other transportation equipment accounted for most of the decline in October. Excluding these two industries, manufacturing sales increased 0.5%.
In constant dollars, sales decreased 1.5% in October, reflecting a lower volume of goods sold.
Business activity continued to grow at a solid clip in New York State, according to firms responding to the December 2017 Empire State Manufacturing Survey. The headline general business conditions index, at 18.0, remained close to last month's level. The new orders index and the shipments index both showed sustained strong gains, with the former holding steady at 19.5 and the latter edging up to 22.4. Delivery times were slightly longer than last month, and inventory levels were stable. Labor market indicators pointed to a small increase in employment but no change in hours worked. Both input prices and selling prices rose at a somewhat faster pace than last month. Indexes assessing the six-month outlook suggested that firms remained optimistic about future business conditions.
-
More confident now that inflation will be steady
-
It's important for inflation that food prices are less volatile than in 2017
-
Inflation expectations now anchor at 4 pct
-
See oil prices averaging $55 in 2018
-
Ups 2018 gdp growth forecast to around 2 pct from 1.0-1.5 pct
-
Says 50 bps rate cut fits C.Bank gradual monetary easing policy
-
Will cut rates to 6-7 pct over a year or two
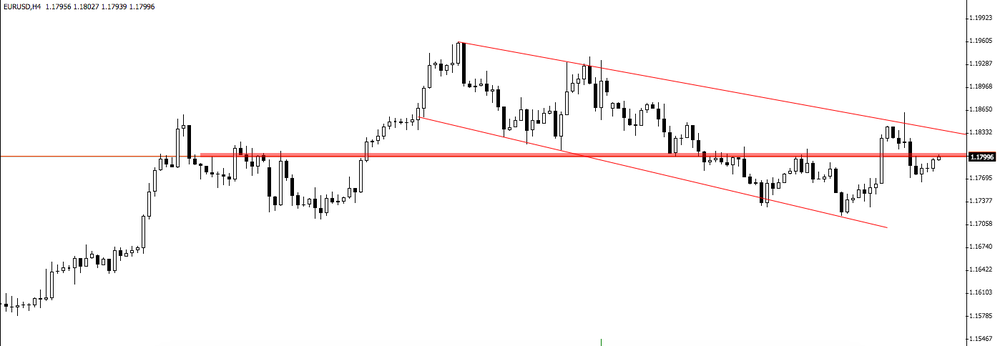
As we can see on the 4-hour time frame chart, the price is recovery its last bearish movement and it might be interesting if the price starts to reject the downside trend line.
The first estimate for euro area (EA19) exports of goods to the rest of the world in October 2017 was €187.9 billion, an increase of 8.8% compared with October 2016 (€172.6 bn). Imports from the rest of the world stood at €168.9 bn, a rise of 10.1% compared with October 2016 (€153.4 bn). As a result, the euro area recorded a €18.9 bn surplus in trade in goods with the rest of the world in October 2017, compared with +€19.2 bn in October 2016. Intra-euro area trade rose to €160.0 bn in October 2017, up by 9.7% compared with October 2016. These data are released by Eurostat, the statistical office of the European Union.
-
Sees inflation at 1.7 pct in 2020
-
Says economic risks include Brexit, Catalonia
-
Average inflation in 2018 at 1.5 pct and 1.4 pct in 2019
-
Unemployment rate at around 11 pct by end-2020
EUR/USD: 1.1700 (2.6 b), 1.1750 (764 m), 1.1800 (2.9 b), 1.1825-30 (911 m), 1.1850 (791 m), 1.1875 (592 m), 1.1900-10 (942 m)
GBP/USD: 1.3300 (929 m), 1.3400 (410 m), 1.3450-52 (399 m)
USD/JPY: 111.60-70 (324 m), 112.00 (1.2 b), 112.25-30 (2.0 b), 112.50 (1.4 b), 112.75 (510 m), 113.00 (790 m) , 113.20-30 (594 m)
USD/CAD: 1.2750 (345 m), 1.2775-80 (605 m), 1.2850 (759 m), 1.2900 (866 m)
AUD/USD: 0.7570-80 (786 m), 0.7700 (342 m), 0.7740-50 (441 m), 0.7800 (1.1 b)
NZD/USD: 0.6900 (335 m), 0.7100 (211 m)
EUR/GBP: 0.8850 (662 m), 0.8900 (596 m), 0.9000 (1.3 b), 0.9050 (1.5 b)
-
Lifts 2019 adjudsted gdp growth forecast to 1.7 pct vs 1.6 pct seen in june
-
Raises 2018 inflation forecast to 1.6 pct vs 1.4 pct, sees 2019 inflation at 1.7 pct vs 1.8 pct
-
Sees inflation in 2020 at 1.9 pct
-
Raises 2018 adjusted gdp growth forecast to 2.5 pct vs 1.7 pct seen in june
EUR/USD
Resistance levels (open interest**, contracts)
$1.1923 (3793)
$1.1904 (2179)
$1.1877 (208)
Price at time of writing this review: $1.1787
Support levels (open interest**, contracts):
$1.1733 (3591)
$1.1691 (4015)
$1.1645 (3556)
Comments:
- Overall open interest on the CALL options and PUT options with the expiration date January, 5 is 92764 contracts (according to data from December, 14) with the maximum number of contracts with strike price $1,1800 (4647);
GBP/USD
Resistance levels (open interest**, contracts)
$1.3579 (4098)
$1.3541 (2106)
$1.3507 (745)
Price at time of writing this review: $1.3444
Support levels (open interest**, contracts):
$1.3394 (1853)
$1.3360 (2189)
$1.3322 (1855)
Comments:
- Overall open interest on the CALL options with the expiration date January, 5 is 30451 contracts, with the maximum number of contracts with strike price $1,3500 (4098);
- Overall open interest on the PUT options with the expiration date January, 5 is 30119 contracts, with the maximum number of contracts with strike price $1,3300 (2518);
- The ratio of PUT/CALL was 0.99 versus 0.98 from the previous trading day according to data from December, 14
* - The Chicago Mercantile Exchange bulletin (CME) is used for the calculation.
** - Open interest takes into account the total number of option contracts that are open at the moment.
The large manufacturers' sentiment index rose to 25 from 22 a quarter ago, according to the quarterly Tankan survey from Bank of Japan, cited by rttnews. This was the highest score since the end of 2006.
At the same time, the large non-manufacturers' sentiment indicator held steady at 23 in the fourth quarter.
However, both big manufactures and non-manufacturers forecast conditions to weaken in the next quarter. The outlook index among manufacturers came in at 19 and that in non-manufacturing at 20.
Large enterprises among all sectors plan to raise their fixed investment in the year through March 2018. Fixed investment is forecast to rise 7.4 percent compared to a 2.1 percent fall for FY 2016.
-
A governor can't stop talking about household debt, by-product of monetary policy, want to make sure we don't underestimate how important that is
-
Very important that we have an independent monetary policy, we are a year or two behind the U.S. in the cycle


© 2000-2024. All rights reserved.
This site is managed by Teletrade D.J. LLC 2351 LLC 2022 (Euro House, Richmond Hill Road, Kingstown, VC0100, St. Vincent and the Grenadines).
The information on this website is for informational purposes only and does not constitute any investment advice.
The company does not serve or provide services to customers who are residents of the US, Canada, Iran, The Democratic People's Republic of Korea, Yemen and FATF blacklisted countries.
Making transactions on financial markets with marginal financial instruments opens up wide possibilities and allows investors who are willing to take risks to earn high profits, carrying a potentially high risk of losses at the same time. Therefore you should responsibly approach the issue of choosing the appropriate investment strategy, taking the available resources into account, before starting trading.
Use of the information: full or partial use of materials from this website must always be referenced to TeleTrade as the source of information. Use of the materials on the Internet must be accompanied by a hyperlink to teletrade.org. Automatic import of materials and information from this website is prohibited.
Please contact our PR department if you have any questions or need assistance at pr@teletrade.global.
transfers