- Analytics
- News and Tools
- Market News
Analytics, News, and Forecasts for CFD Markets: currency news — 11-06-2018.
| Pare | Closed | % change |
| EUR/USD | $1,1782 | +0,10% |
| GBP/USD | $1,3377 | -0,22% |
| USD/CHF | Chf0,98506 | +0,01% |
| USD/JPY | Y110,05 | +0,47% |
| EUR/JPY | Y129,66 | +0,57% |
| GBP/JPY | Y147,22 | +0,25% |
| AUD/USD | $0,7607 | +0,15% |
| NZD/USD | $0,7021 | -0,10% |
| USD/CAD | C$1,29852 | +0,48% |
| Time | Country | Index | Period | Previous value | Forecast |
| 02:50 | Japan | BSI Manufacturing Index | II sq. M | 2.9 | 3.2 |
| 04:30 | Australia | National Australia Bank's Business Confidence | May | 10 | 9 |
| 04:30 | Australia | Home Loans | April | -2.2% | -1.9% |
| 07:30 | Japan | Tertiary Industry Index | April | -0.3% | 0.6% |
| 08:30 | France | Non-Farm Payrolls | I quarter | 0.3% | |
| 11:30 | United Kingdom | Average Earnings, 3m/y | April | 2.6% | 2.6% |
| 11:30 | United Kingdom | Average earnings ex bonuses, 3 m/y | April | 2.9% | 2.9% |
| 11:30 | United Kingdom | Claimant count | May | 31.2 | 11.3 |
| 11:30 | United Kingdom | ILO Unemployment Rate | April | 4.2% | 4.2% |
| 12:00 | Eurozone | ZEW Economic Sentiment | June | 2.4 | 2.1 |
| 12:00 | Germany | ZEW Survey - Economic Sentiment | June | -8.2 | -13 |
| 15:30 | USA | CPI excluding food and energy, m/m | May | 0.1% | 0.2% |
| 15:30 | USA | CPI, m/m | May | 0.2% | 0.2% |
| 15:30 | USA | CPI excluding food and energy, Y/Y | May | 2.1% | 2.2% |
| 15:30 | USA | CPI, Y/Y | May | 2.5% | 2.8% |
| 21:00 | USA | Federal budget | May | 214 | -135.5 |
Amit Kara, Head of UK macroeconomic forecasting, said "We estimate that output expanded by just 0.2 per cent in the three months to May 2018, which is around half the potential growth rate of the economy. Economic growth has slowed materially since the start of this year and it continues to remain weak. One reason for sluggish growth is the disruption caused by severe weather in March, particularly to the construction sector. The latest data also shows a notable slowdown in manufacturing sector output that appears to be driven by both domestic and external conditions. By contrast, the retail sector and the dominant services sector may be recovering".
Construction output continued its recent decline in the three-month on three-month series, falling by 3.4% in April 2018; the biggest fall seen in this series since August 2012.
The three-month on three-month decrease in construction output was driven by falls in both repair and maintenance and new work, which fell 3.0% and 3.7% respectively.
Following three consecutive months of contraction in the month-on-month series at the start of 2018, construction output experienced a slight bounceback in April 2018, increasing by 0.5%.
The total UK trade deficit widened £1.9 billion to £9.7 billion in the three months to April 2018, due mainly to falling exports of both goods and services.
Goods exports fell £3.1 billion, due mainly to falls in exports of machinery, pharmaceuticals and aircraft, while services exports also fell £2.5 billion in the three months to April 2018.
Falling volumes was the main reason for the declines in exports of machinery, pharmaceuticals and aircraft in the three months to April 2018 as price movements were relatively small.
The UK's trade in goods deficit improved £0.6 billion with countries outside of the EU and worsened £1.2 billion with countries inside the EU in the three months to April 2018.
A £9.9 billion improvement to the services trade surplus, due to a rise of 8.3% for services exports, meant the total trade deficit narrowed £6.7 billion in the 12 months to April 2018.
The three-monthly fall to April 2018 in manufacturing of 0.5% is the largest fall since May 2017, due mainly to decreases in electrical equipment (9.4%), and basic metals and metal products (1.8%).
The fall in manufacturing is supported by widespread weakness throughout the sector due to a reduction in the growth rate of both export and domestic turnover.
In the three months to April 2018, the Index of Production increased by 0.3% compared with the three months to January 2018, due primarily to a rise of 3.2% in energy supply; this was supported by a rise in mining and quarrying of 4.3%.
In April 2018, total production was estimated to have decreased by 0.8% compared with March 2018, led by a fall of 1.4% in manufacturing and supported by falls in energy supply (2.0%), and water and waste (1.8%).
Core machine orders in Japan surged a seasonally adjusted 10.1 percent on month in April, according to rttnews.
That topped expectations for a gain of 2.4 percent following the 3.9 percent decline in March.
On a yearly basis, core machine orders jumped 9.,6 percent - again beating forecasts for 3.8 percent following the 2.4 percent decline in the previous month.
The total value of machinery orders received by 280 manufacturers operating in Japan increased by 12.6 percent on month and 9.7 percent on year in April.
Fair Trade is now to be called Fool Trade if it is not Reciprocal. According to a Canada release, they make almost 100 Billion Dollars in Trade with U.S. (guess they were bragging and got caught!). Minimum is 17B. Tax Dairy from us at 270%. Then Justin acts hurt when called out!
EUR/USD
Resistance levels (open interest**, contracts)
$1.1918 (944)
$1.1894 (308)
$1.1868 (18)
Price at time of writing this review: $1.1798
Support levels (open interest**, contracts):
$1.1691 (2995)
$1.1655 (2363)
$1.1616 (1371)
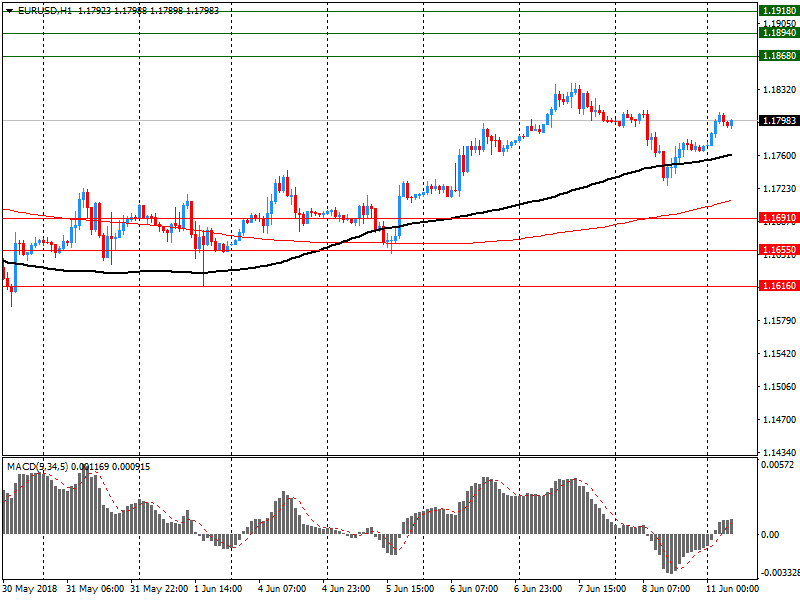
Comments:
- Overall open interest on the CALL options and PUT options with the expiration date July, 9 is 85557 contracts (according to data from June, 8) with the maximum number of contracts with strike price $1,1500 (5439);
GBP/USD
Resistance levels (open interest**, contracts)
$1.3560 (836)
$1.3528 (330)
$1.3493 (125)
Price at time of writing this review: $1.3412
Support levels (open interest**, contracts):
$1.3343 (424)
$1.3314 (1830)
$1.3282 (2005)
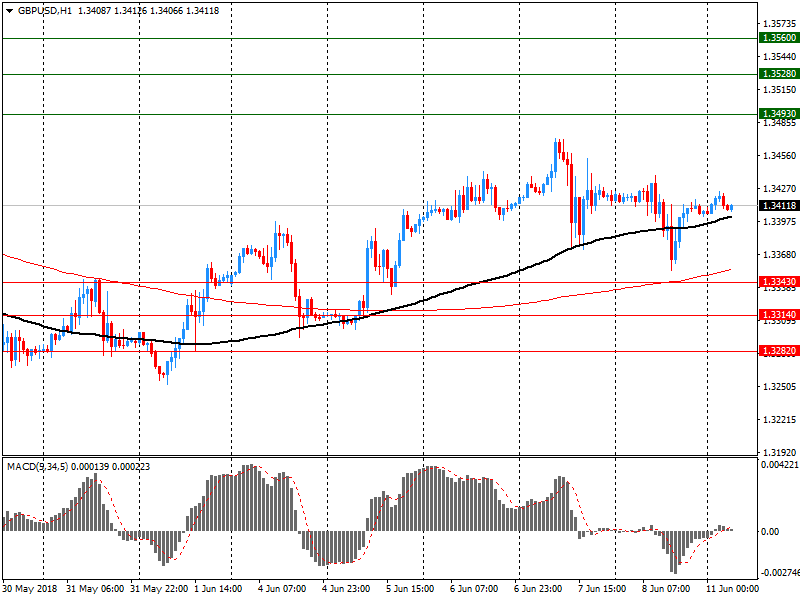
Comments:
- Overall open interest on the CALL options with the expiration date July, 9 is 20180 contracts, with the maximum number of contracts with strike price $1,3800 (2243);
- Overall open interest on the PUT options with the expiration date July, 9 is 21574 contracts, with the maximum number of contracts with strike price $1,3100 (2231);
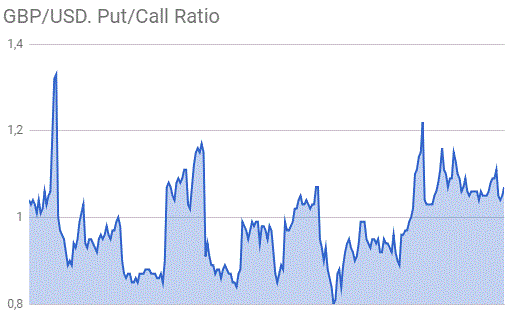
- The ratio of PUT/CALL was 1.07 versus 1.06 from the previous trading day according to data from June, 8.
* - The Chicago Mercantile Exchange bulletin (CME) is used for the calculation.
** - Open interest takes into account the total number of option contracts that are open at the moment.


© 2000-2024. All rights reserved.
This site is managed by Teletrade D.J. LLC 2351 LLC 2022 (Euro House, Richmond Hill Road, Kingstown, VC0100, St. Vincent and the Grenadines).
The information on this website is for informational purposes only and does not constitute any investment advice.
The company does not serve or provide services to customers who are residents of the US, Canada, Iran, The Democratic People's Republic of Korea, Yemen and FATF blacklisted countries.
Making transactions on financial markets with marginal financial instruments opens up wide possibilities and allows investors who are willing to take risks to earn high profits, carrying a potentially high risk of losses at the same time. Therefore you should responsibly approach the issue of choosing the appropriate investment strategy, taking the available resources into account, before starting trading.
Use of the information: full or partial use of materials from this website must always be referenced to TeleTrade as the source of information. Use of the materials on the Internet must be accompanied by a hyperlink to teletrade.org. Automatic import of materials and information from this website is prohibited.
Please contact our PR department if you have any questions or need assistance at pr@teletrade.global.
transfers