- Analytics
- News and Tools
- Market News
Market Trading News and Research from 24 April 2024
- AUD/USD retreats from a peak of 0.6529 following an unexpected surge in Australian inflation figures.
- The US Dollar Index edges higher, influenced by solid US economic indicators and investor caution ahead of key GDP report.
- Despite a strong Q1 inflation report suggesting robust Australian economic activity, expectations for an RBA rate cut linger among analysts.
The Aussie Dollar finished Wednesday’s session with decent gains of 0.15% against the US Dollar, yet it retreated from weekly highs of 0.6529, which it hit after a hotter-than-expected inflation report. Economic data from the United States (US) boosted the Greenback, which, according to the US Dollar Index (DXY), gained 0.13%, up to 105.82. As the Asian session begins, the AUD/USD trades at 0.6495. down 0.02%.
AUD/USD retreats below 0.6500 amid strong US data
Wall Street was mixed on Wednesday after META reported earnings, which were better than expected but weighed on the US equity markets. Investors remain cautious ahead of the release of the US Gross Domestic Product (GDP) report on Thursday, which is expected to show the largest economy in the world grew 2.5% QoQ in the first quarter this year. At the same time, Initial Jobless Claims are expected to increase from 212K to 214K.
Aside from this, past data revealed on Wednesday suggested the US economy remains solid. Mach’s Durable Goods Orders increased 2.6% MoM, up from a 0.7% rise previously and surpassing 2.5% estimates. Core goods, which excluded transportation, increased by 0.2% MoM, an improvement over February's 0.1% increase but falling short of the 0.3% projected.
On Wednesday, during the Asian session, Australia’s Bureau of Statistics (ABS) revealed that inflation for Q1 2024 exceeded estimates by far of 0.6%, increasing QoQ by 1%. Annually based, the Consumer Price Index (CPI) expanded 3.6% YoY, down from 4.1% but above projections of 3.4%.
Traders sent the AUD/USD rallying above 0.6500 as they priced out a rate cut by the Reserve Bank of Australia (RBA) in 2024. Despite this red-hot report, ANZ Bank analysts expect the RBA to cut rates in November.
They added, "We think the RBA will want to see a couple of quarters of lower non-tradables and services inflation to be convinced that overall inflation will not only return to the 2–3% target band but remain there.”
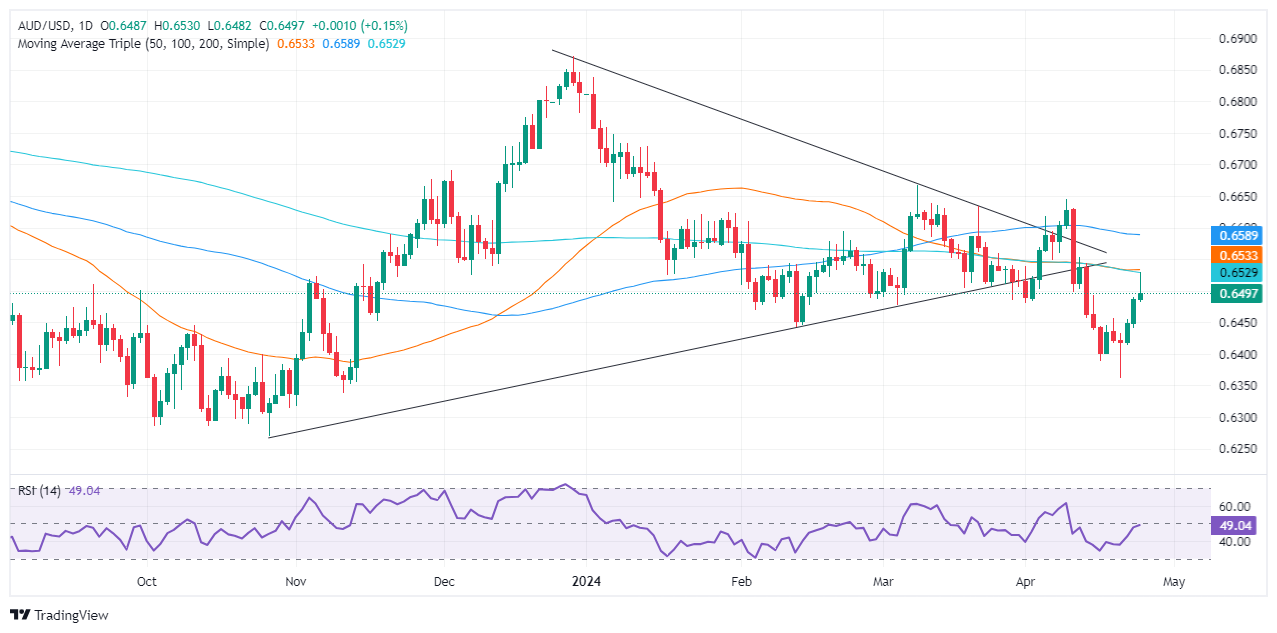
AUD/USD Price Analysis: Technical outlook
Given the fundamental backdrop, the AUD/USD rallied toward the confluence of the 200 and 50-day moving averages (DMAs), though buyers lacked the strength to pierce that strong resistance level at 0.6526/32, retreating sharply back below the 0.6500 mark. That said, if the pair drops below the April 24 low of 0.6483, the AUD/USD could dive toward the February 13 low at 0.6442. Once cleared, up next would be 0.6400.
- US Dollar tips into a fresh 34-year high against Japanese Yen on Wednesday.
- BoJ policy statement is expected as markets await Yen intervention.
- US data sends mixed shocks through markets as Fed watchers look on.
USD/JPY broke into its highest chart territory since June of 1990 on Wednesday, peaking near 155.40 for the first time in 34 years as the Japanese Yen continues to tumble across the broad fx market. According to reporting from Nikkei, the Bank of Japan (BoJ) is expected to discuss “impact of accelerating Yen depreciation”, a clear sign to market participants that BoJ intervention in the fx markets could be impending if the JPY continues to soften.
Key US data is due in the back half of the trading week with US Gross Domestic Product (GDP) and US Personal Consumption Expenditure (PCE) Price Index inflation slated for Thursday and Friday, respectively. US GDP is expected to ease to 2.5% for the annualized first quarter compared to the previous 3.4%. US Core PCE inflation in March is forecast to hold steady in March.
Investors hoping for signs of rate cuts from the US Federal Reserve (Fed) will continue to celebrate downside economic indicators from the US, and will be hoping for slowing GDP growth and easing PCE inflation prints.
The BoJ will be releasing its latest Monetary Policy Statement early Friday, and a press conference from BoJ Governor Kazuo Ueda is expected to follow at an unspecified time. Before the BoJ, Japan’s Tokyo Consumer Price Index (CPI) for the year ended April will print in the early Friday market session. Headline Tokyo YoY CPI is expected to hold steady at 2.6% in April, with Core-core Tokyo CPI inflation (headline inflation less volatile food and energy prices) expected to tick down slightly to 2.7% from 2.9%.
USD/JPY technical outlook
With the pair hitting its highest bids in over three decades, USD/JPY is on pace to close in the green for a fourth consecutive month. The pair is up nearly 6% from the last swing low near 146.50 in March, and USD/JPY has climbed almost 8% since crossing the 200-day Exponential Moving Average (EMA) at the beginning of 2024.
USD/JPY daily chart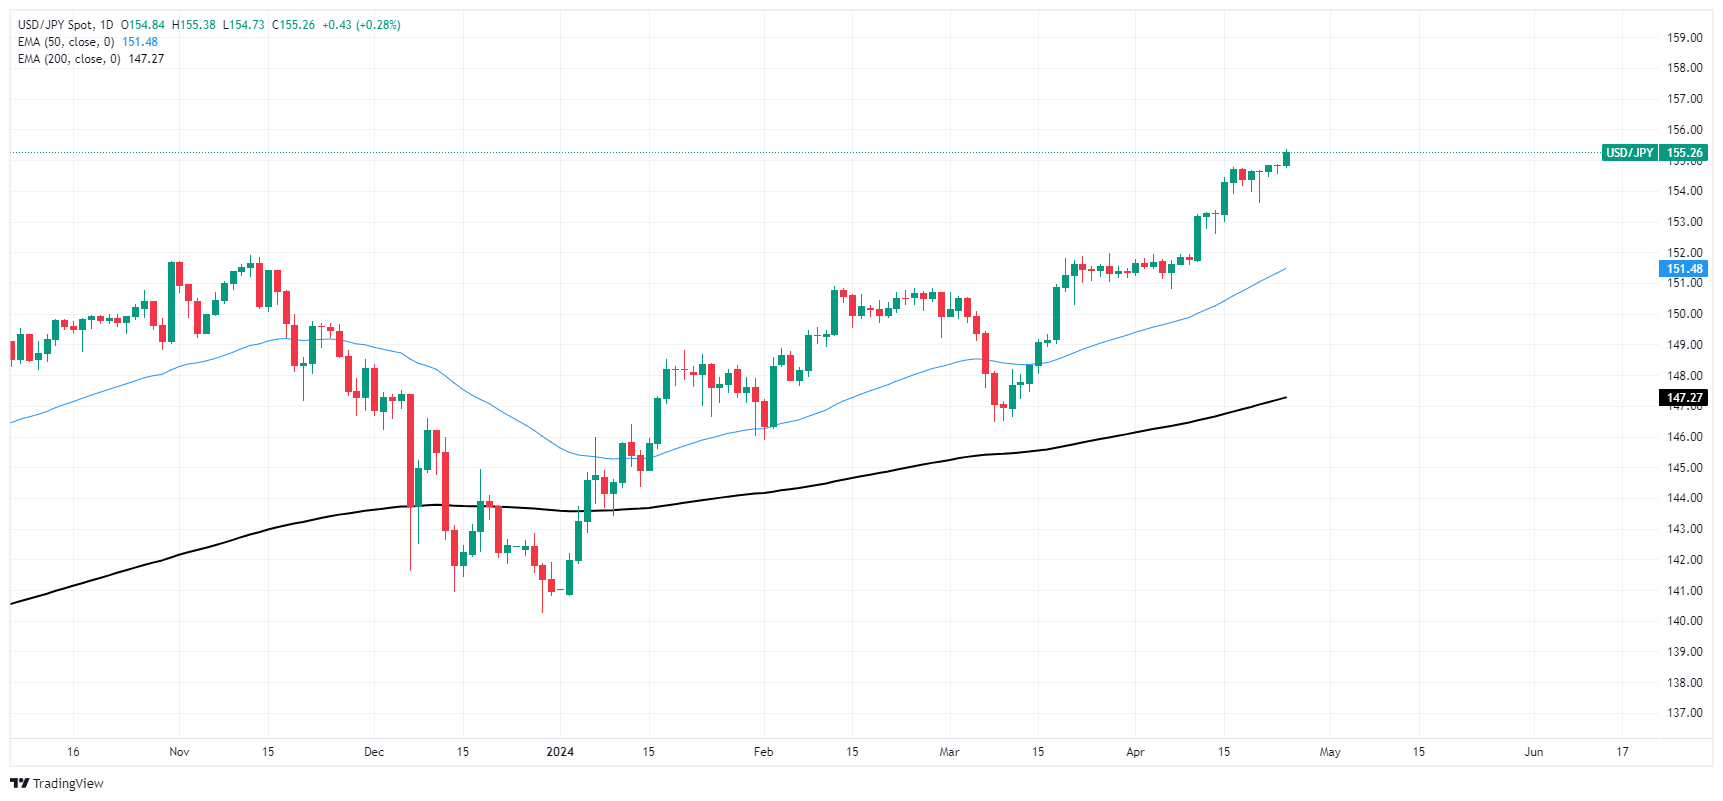
- GBP/USD trades on a weaker note around 1.2460 in Thursday’s early Asian session.
- The US Durable Goods Orders rose 2.6% in March, compared to the 0.7% increase (revised from 1.4%) in February.
- The BoE is expected to wait until next quarter to lower borrowing costs, according to analysts from a Reuters poll.
- The US advanced Q1 GDP growth numbers will be in the spotlight on Thursday.
The GBP/USD pair snaps the two-day winning streak near 1.2460 amid the modest rebound of the US Dollar (USD) on Thursday during the early Asian session. The release of the US Gross Domestic Product (GDP) for the first quarter (Q1) will take center stage on the day. Also, the usual weekly Initial Jobless Claims and Pending Home Sales will be due.
On Wednesday, US Durable Goods Orders improved by 2.6%, or $7.3 billion, to $283.4 billion in March, compared to the 0.7% increase (revised from 1.4%) in February. The increase in overall orders was the biggest since November 2023, according to the US Census Bureau. Meanwhile, Durable Goods Orders ex-transportation increased by 0.2%, while new orders excluding defense rose 2.3% in March. Both figures came in weaker than expected. Nonetheless, these reports did not have a significant impact on the US Dollar Index (DXY).
Several US Federal Reserve (Fed) officials and Fed Chair Jerome Powell emphasized that rate cuts aren’t coming in the coming months as inflation remains stickier than expected. The hawkish comments and the higher-for-longer stance from US Federal Reserve (Fed) officials have boosted the Greenback and created a headwind for the GBP/USD pair.
On the other hand, the markets anticipate that the Bank of England (BoE) will wait until next quarter to lower borrowing costs, according to median forecasts in a Reuters poll. The BoE Governor Andrew Bailey and other BoE officials stated that inflation in the United Kingdom declined in line with the central bank's expectations and the risk of elevated inflation had reduced, paving the way for a rate cut. The speculation is that the UK Central Bank will begin its easing cycle before the US Fed drags the Pound Sterling (GBP) lower and caps the downside of the major pair.
- The Guppy breaks into new chart territory above 193.60, a nine-year high.
- Deflating JPY is rapidly approaching standoff territory with nervous BoJ.
- Japanese inflation figures, BoJ rate call loom ahead on Friday.
The GBP/JPY broke into a fresh nine-year high above 193.60 on Wednesday as the Pound Sterling (GBP) sees recovery bidding and the Japanese Yen (JPY) continues to weaken despite increasingly interventionist rhetoric from the Bank of Japan (BoJ).
According to reporting from Nikkei, the BoJ is set to discuss the “impact of accelerating Yen depreciation”, a clear warning shot that the Japanese central bank could be weighing market operations to bring current Yen moves under heel. The BoJ is slated to deliver its latest Monetary Policy Report and rate call early Friday.
The Pound Sterling is enjoying a reprieve from recent selling pressure after Tuesday’s UK Services Purchasing Managers Index (PMI) recovered significant ground, bounding to 54.9 from the previous 53.1 and vaulting over the forecast downtick to 53.0. The only thing left of note on the economic docket for the UK this week will be Thursday’s GfK Consumer Confidence for April, which is expected to improve, albeit slightly, to -20 from the current -21.
Early Friday will also see the latest print of Japan’s Tokyo Consumer Price Index (CPI) inflation. Tokyo CPI inflation is expected to hold steady at 2.6% for the year ended April, while Core-core Tokyo CPI (headline inflation less volatile food and energy prices) is expected to ease slightly to 2.7% from 2.9% YoY.
GBP/JPY technical outlook
The Guppy broke through a recent technical barrier to squeeze out a fresh nine-year high just above the 193.60 level as the pair continues to price in technical support from the 190.40 region.
GBP/JPY has been trending firmly bullish as the Yen continues to soften. The pair is up around 8% after a bullish bounce from the 200-day Exponential Moving Average near 179.00 at the start of 2024. The 200-day EMA is now breaking through the 185.00 handle as the bullish Guppy runs deeper into bull country.
GBP/JPY hourly chart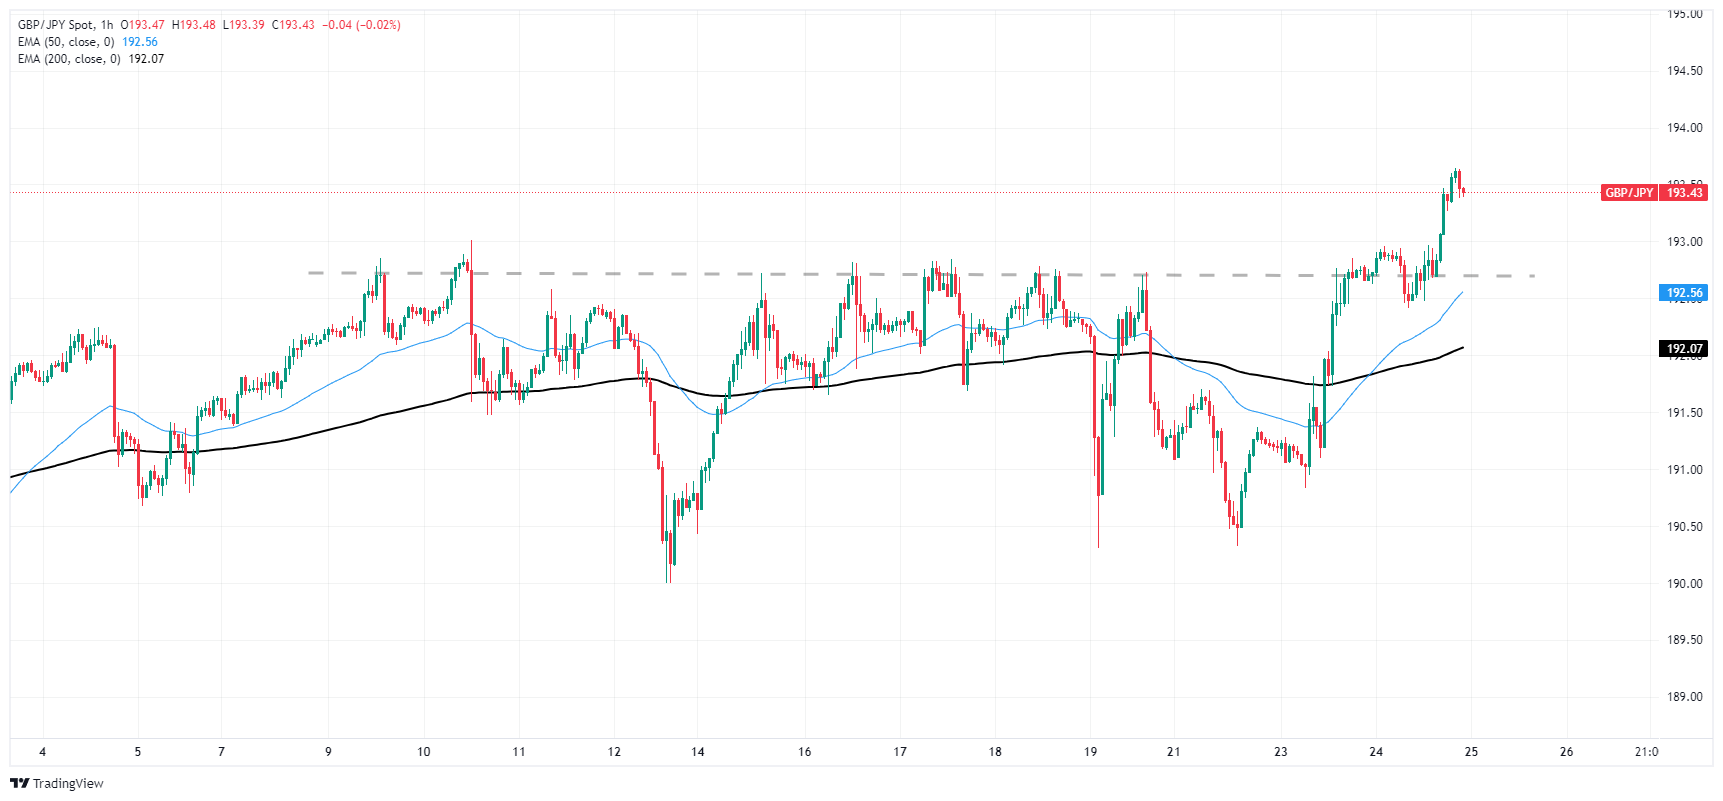
GBP/JPY daily chart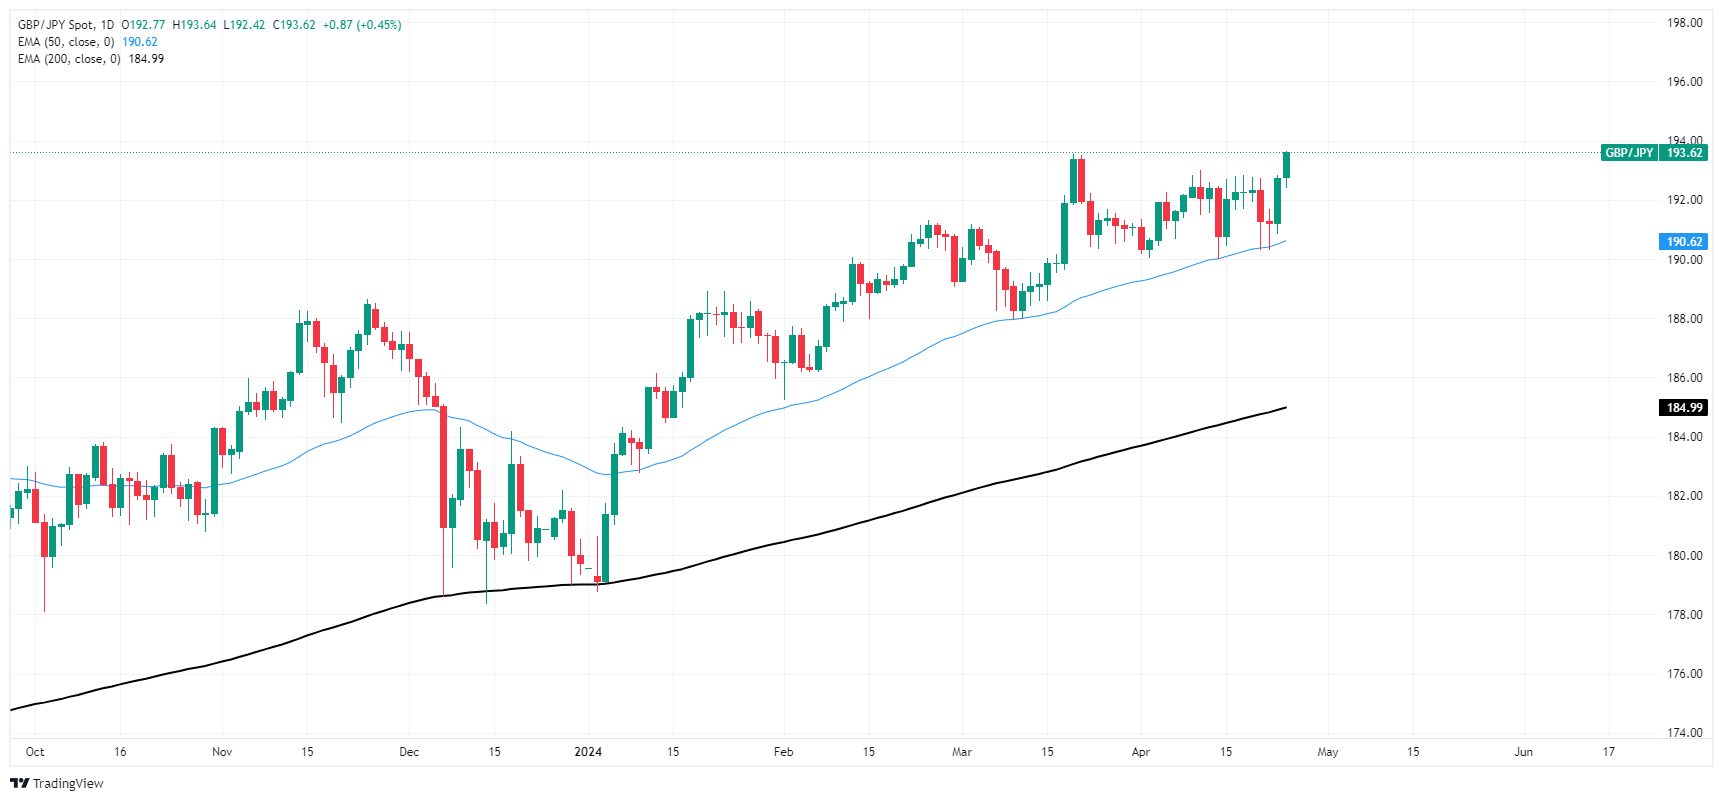
- The daily RSI reveals potential minor correction, indicating latent buying momentum.
- The hourly indicators show fluctuating momentum, indicating a possible pause in the bearish impulse.
- For bulls to make ground, they would need to assert above the 20-day SMAs.
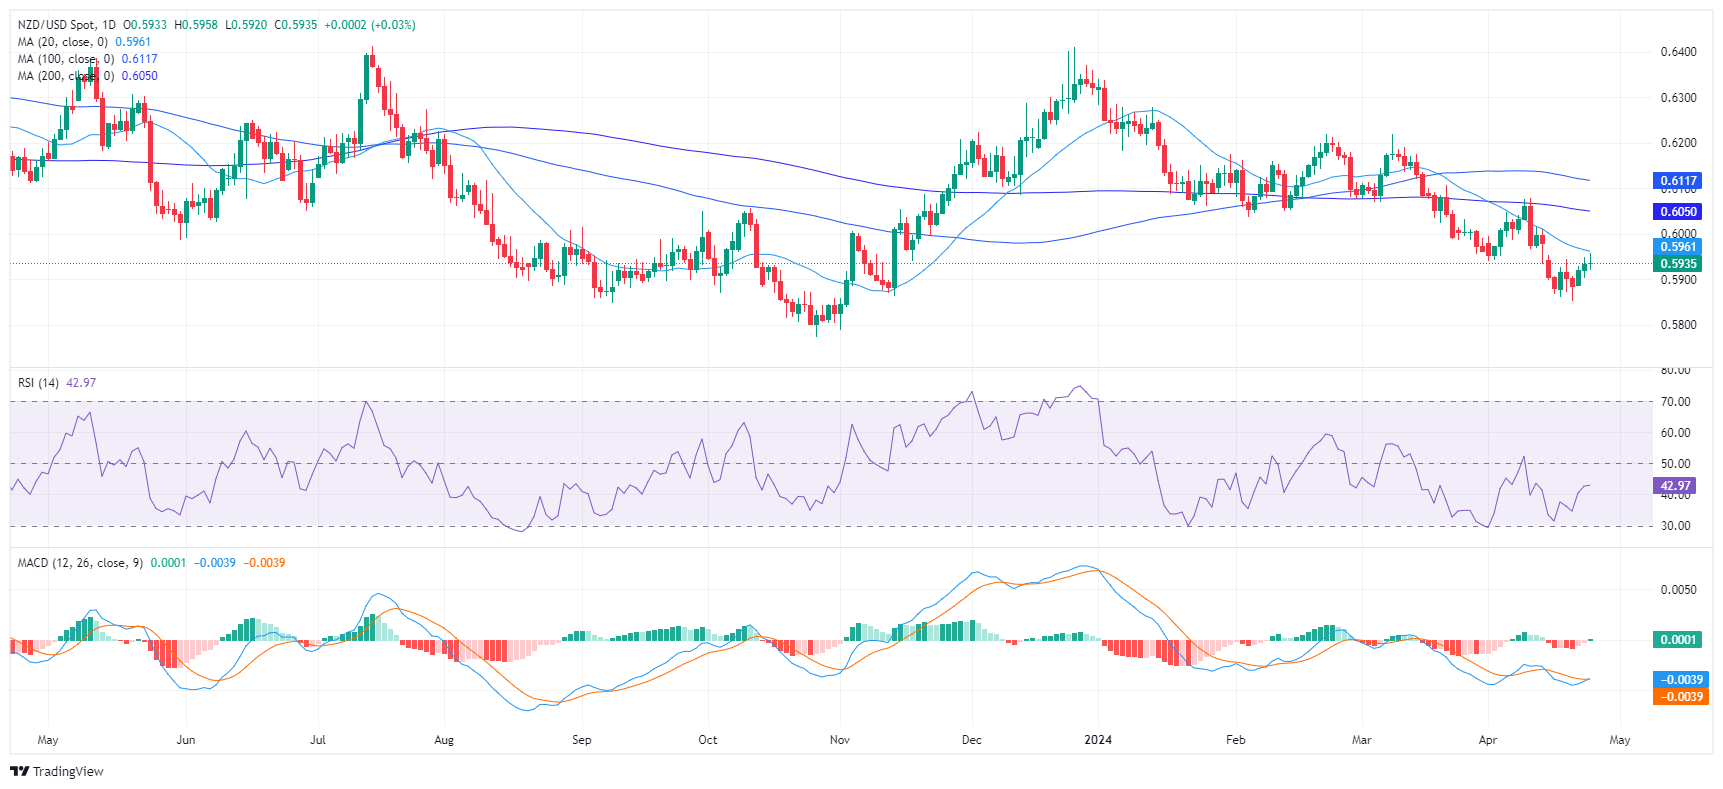
The NZD/USD rose to 0.5937 on Wednesday’s session, presenting subtle gains. Long-term bearish forces maintain overall control of the pair's course. However, there are signals that the bulls may be waking up and as sellers lose traction, it might be the buyer's turn now.
The daily chart Relative Strength Index (RSI) languishes in negative territory. However, an uptick suggests a potential minor correction following many days of depressed readings. The Moving Average Convergence Divergence (MACD) reveals a fresh green bar, signaling that positive momentum is starting to build, albeit the prevailing trend remains bearish.
NZD/USD daily chart
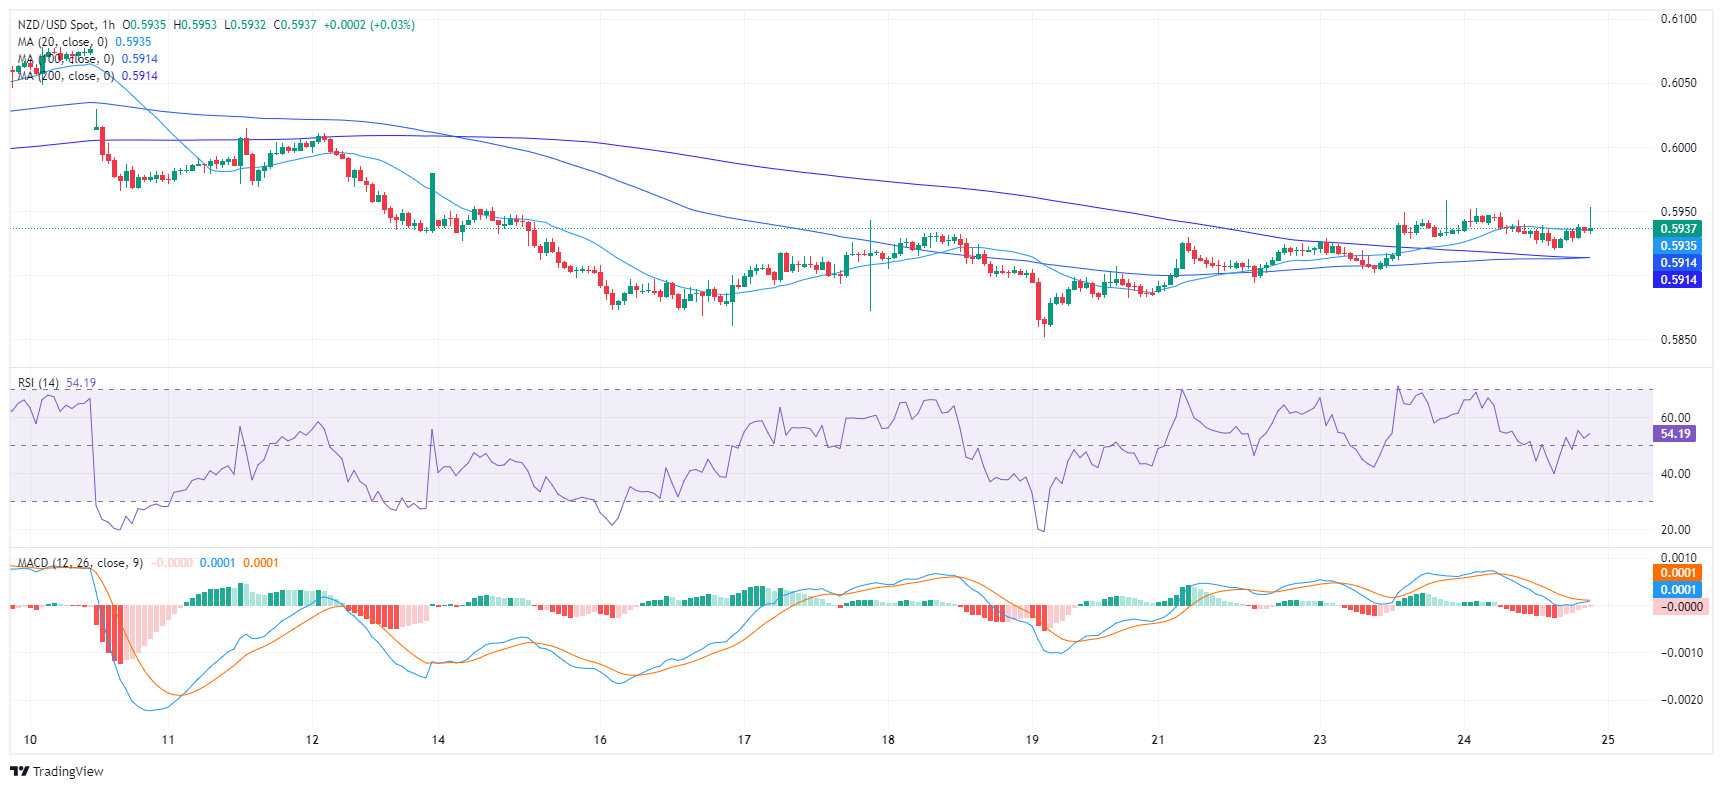
Zooming in, the hourly RSI readings display more fluctuations, swinging between the 40 and 55 marks within Wednesday's timeframe. Furthermore, the hourly MACD shows decreasing red bars, indicating a decline in the pair's downward momentum on this shorter-term chart.
NZD/USD hourly chart
Taking a broader view, the NZD/USD has stayed below its 20, 100, and 200-day Simple Moving Averages (SMAs). This positioning below the SMAs reveals a bearish trend prevailing in short- and long-term frames. Wednesday's rejection of buyers at 0.5960, at the 20-day SMA, reinforces the dominance of sellers in the market and suggests that the downward trend may continue. This situation implies that the current buying momentum isn’t strong enough to be considered a bullish signal. However, the tables would change if the buyers manage to conquer that level in the next sessions.
- EUR/USD maintains a position slightly above 1.0700, with minimal change despite a strong recovery in the US Dollar.
- US Treasury yields increase after significant durable goods data and a major five-year note sale, impacting market sentiment.
- Upcoming US GDP and Core PCE data, along with German consumer confidence figures, are next on the economic calendar.
The Euro is steady against the US Dollar, virtually unchanged after solid data from the United States (US) boosted the Greenback, which recovered from Tuesday's losses. However, the EUR/USD stands below the 1.0700 threshold posting minimal gains of 0.01%.
EUR/USD is flatlined ahead of crucial US GDP and inflation data
The market mood shifted sour as the US Treasury yields edged up after a record $70 billion sale of five-year notes in the US fixed-income market. In the meantime, the US Department of Commerce showed that US Durable Goods Orders increased in March, expanding by 2.6% MoM, up from a 0.7% rise previously and surpassing 2.5% estimates. Core goods, which excluded transportation, increased by 0.2% MoM, an improvement over February's 0.1% increase, but fell short of the 0.3% projected.
Today’s data contrasts with Tuesday’s S&P Global PMI figures in the US. Although business activity has eased somewhat, Goods Orders figures crushed February’s figures, signaling the economy remains strong.
On Thursday, the US Bureau of Economic Analysis (BEA) will reveal the Gross Domestic Product (GDP) for the first quarter of 2024, estimated at 2.5%, down from 3.4% in Q4 2023. At the same time, Initial Jobless Claims are expected to increase from 212K to 214K.
Besides that, EUR/USD traders would be eyeing the release of the Core Personal Consumption Expenditures (PCE) Price Index, the Federal Reserve’s preferred inflation gauge, which is estimated to remain steady at 0.3%. The annual Core PCE rate is expected to ease to 2.6%, down from February's rate of 2.8%, indicating a potential softening of inflation pressure.
Across the pond, traders would be eyeing the release of Germany’s GfK Consumer Confidence for May, projected to improve from -27.4 to -25.9.
EUR/USD Price Analysis: Technical outlook
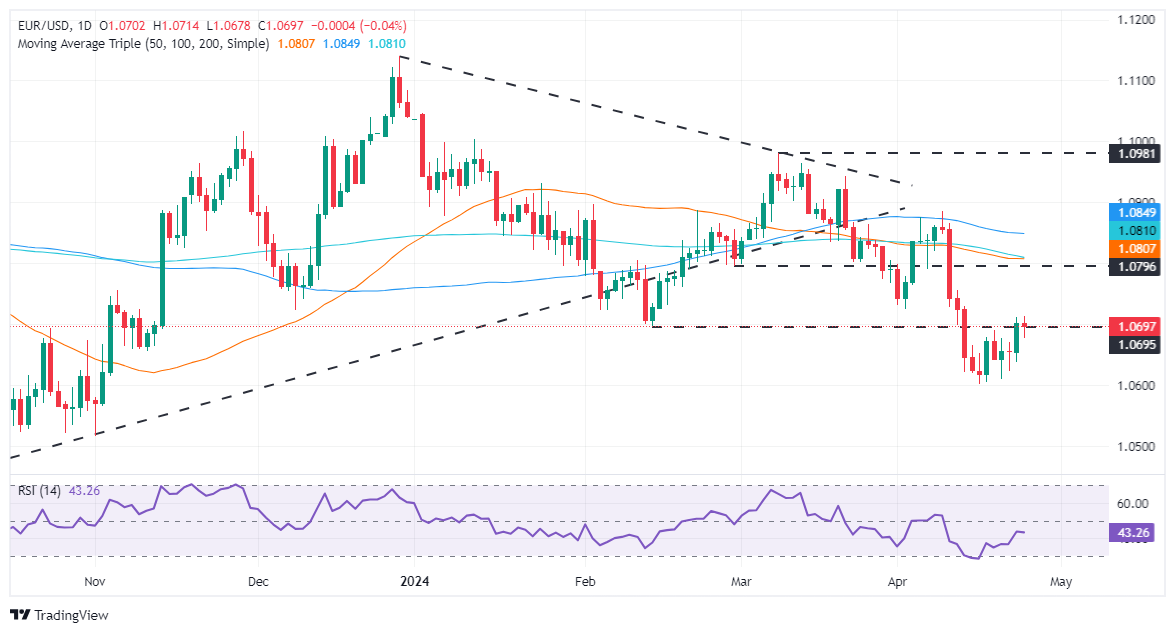
Even though the EUR/USD seems to have bottomed at around 1.0600, buyers' failure to achieve a daily close above 1.0700 could pave the way for a re-test of the year-to-date (YTD) low at 1.0601. In that event, a breach of the latter, will expose a key support level at 1.0448, the October 3, 2023, swing low. On the upside, if buyers keep the spot price above 1.0700, look for a test of the psychological 1.0750 before aiming toward the confluence of the 50 and 200-DMA.
- Crude Oil eases back from risk-on bump, but US inventory declines limit losses.
- WTI remains hampered by $83.00 per barrel technical level.
- API, EIA both report inventory declines.
West Texas Intermediate (WTI) US Crude Oil slipped back slightly on Wednesday, stumbling away from $83.50 per barrel to trade down to $82.50 as broad-market risk appetite from Tuesday evaporates in the mid-week market session. Despite easing buying pressure in barrel markets, Crude Oil declines remain limited after US barrel counts declined on a week-on-week basis.
The Energy Information Administration (EIA) reported a -6.368M barrel decline in US barrel counts for the week ended April 19, missing the forecast uptick of 1.6M and erasing the previous week’s 2.735M buildup. The EIA’s reported decline in Crude Oil stocks adds to the reported inventory decline from the American Petroleum Institute (API) late Tuesday, which showed a -3.23M barrel drawdown for the same period, also missing a forecast 1.8M buildup and eating away at most of the previous week’s increase of 4.09M barrels.
Declining US barrel stocks are helping to balance out broad-market risk aversion flows as commodities take a hit on Wednesday. Volatility is on the rise and investors are turning to Thursday’s upcoming US Gross Domestic Product (GDP) print. Markets desperate for any signs of a US Federal Reserve (Fed) rate cut over the horizon are hoping that the US’ quarterly GDP results for Q1 will ease back to at least 2.5% compared to the previous print of 3.4%.
This week will wrap up with another print of the US Personal Consumption Expenditure (PCE) Price Index inflation metric. Core US PCE MoM in March is expected to hold steady at 0.3%, and rate-cut-hungry market participants are looking for further signs of inflation weakness. At current cut, the Fed is expected to deliver a first rate cut in September, well later than the March rate cut that was expected back in December.
WTI technical outlook
WTI continues to get hung up on the 200-hour Exponential Moving Average (EMA) near $83.00, hampering topside momentum in the near-term as barrel bids continue to look for bullish bounces from the $81.00 region. Intraday barrel bidding remains significantly down from recent highs near $87.00, but further downside momentum will need to break below $80.00 before pushing lower.
Daily candles remain on the high side of the 200-day EMA at $79.11, and despite recent bearish pulldown, Crude Oil remains well up from 2024’s early lows near $70.00 per barrel.
WTI hourly chart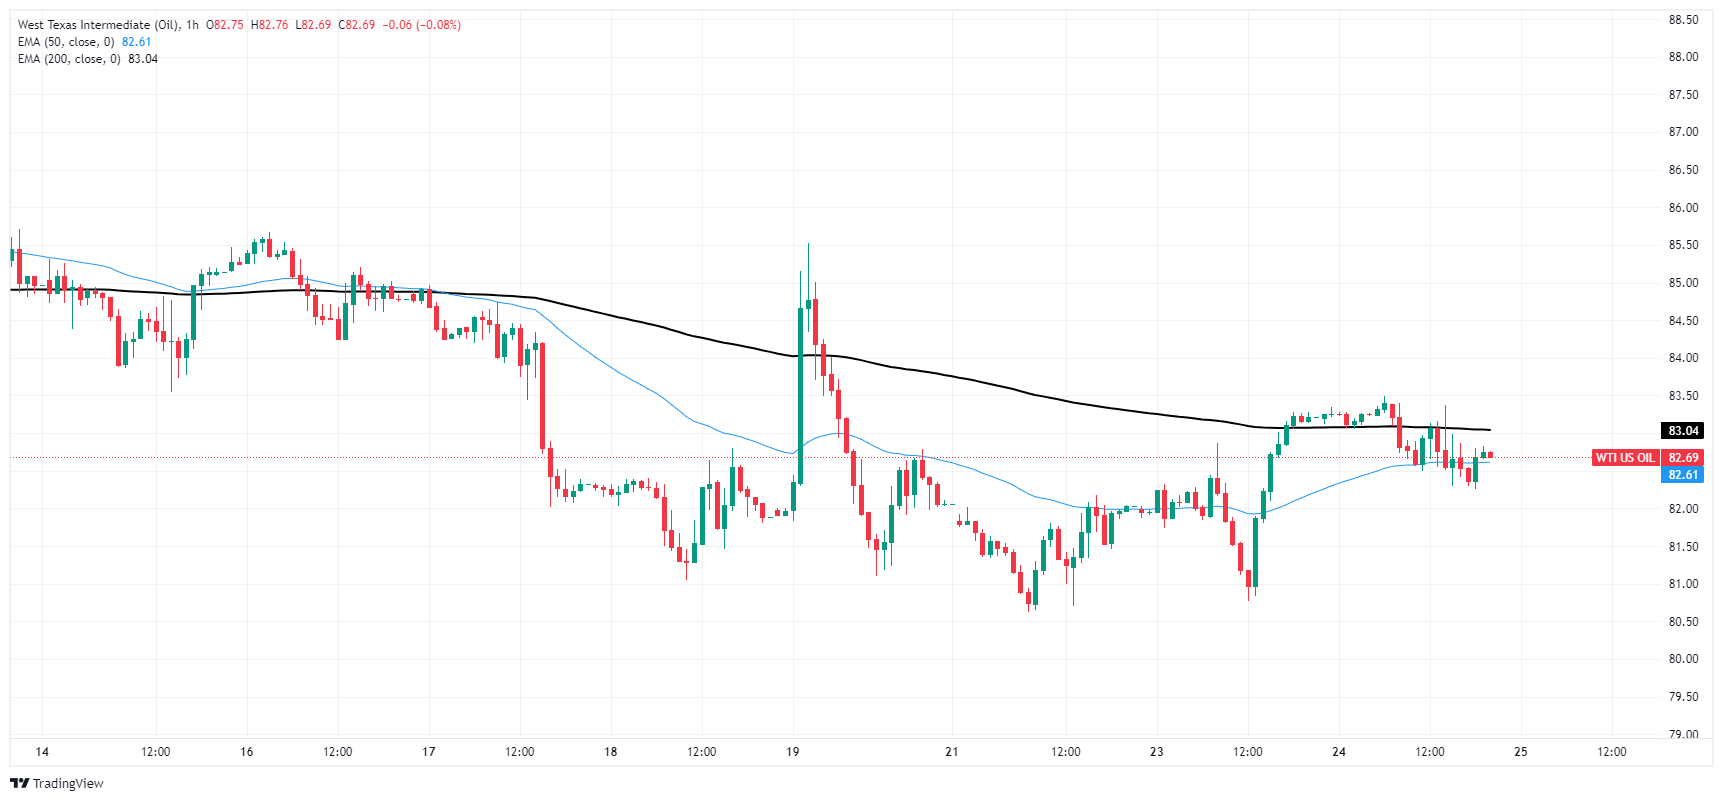
WTI daily chart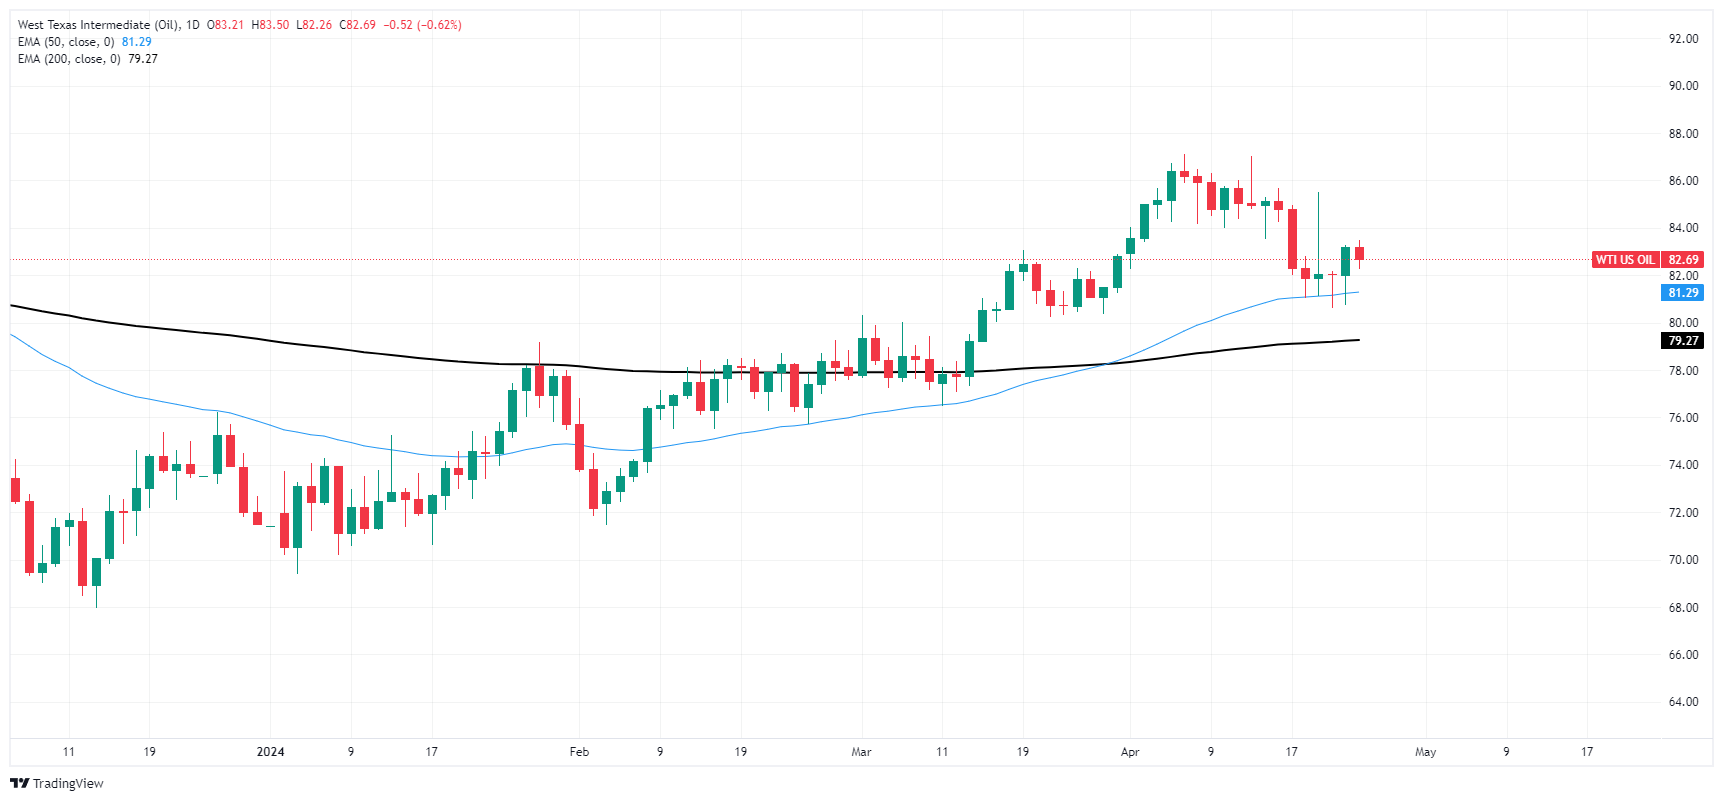
- The daily RSI of the AUD/JPY continues its uphill journey, nearing overbought territory, amplifying buying traction.
- Hourly indicators are also strong, with no signs of bears.
- A healthy correction shouldn't be ruled out.
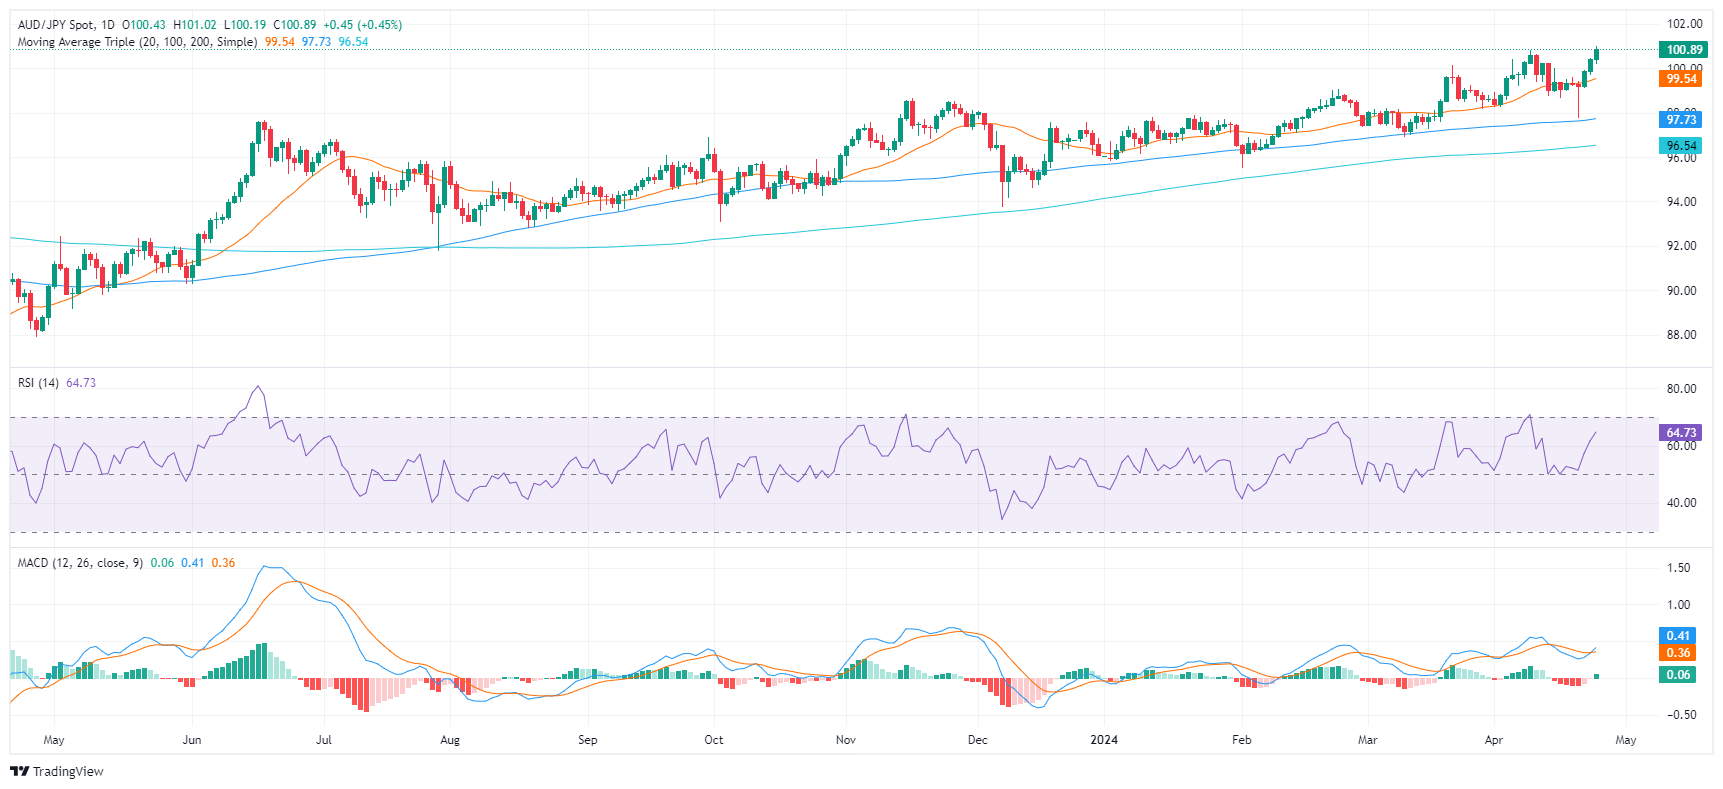
The AUD/JPY market showcases an increasingly bullish trend. The cross stabilized at 100.89 on Wednesday, after rallying to a high at 101.12, its highest since 2014. The general market interest leans towards the buyers as the pair follows an upward trend and surpasses significant levels. However, as the pair gained nearly 1.50% in the last sessions, the cross might be poised for a correction.
On the daily chart, the Relative Strength Index (RSI) of the AUD/JPY pair continues its upward trajectory nearing overbought territory. The Moving Average Convergence Divergence (MACD) also supports the buyers, as it prints a fresh green bar.
AUD/JPY daily chart
Switching the focus to the hourly chart, the hourly Relative Strength Index (RSI) displays a generally increasing trend, pointing toward positive short-term momentum. In addition, the MACD portrays decreasing red bars, denoting the declining momentum of the sellers in the short-term trading hours.
AUD/JPY hourly chart
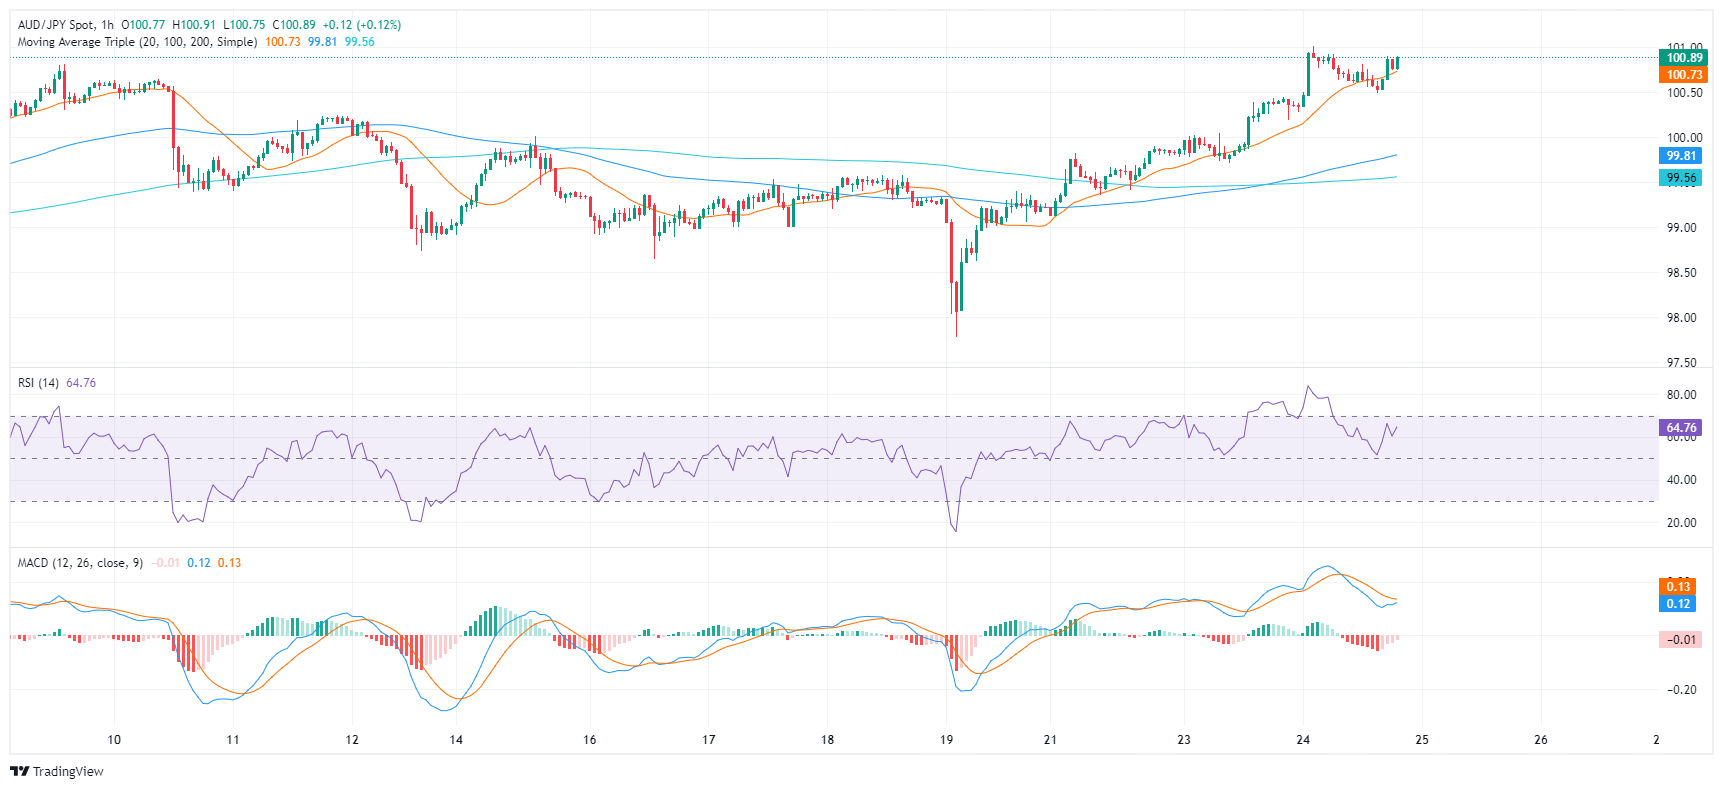
In the broader outlook, the AUD/JPY indicates a bullish trend, given its current position above the 20, 100, and 200-day Simple Moving Average (SMA). SMAs serve as technical indicators for analyzing price trends by smoothing out price fluctuations. The pair's stance above all three SMAs suggests a strong stance from the bull in the short and long-term perspectives. In addition, the pair rallying to multi-year highs suggests that the bulls are clearly in command, but traders shouldn't be ruled out as indicators might run out of steam.
- Gold recovers from recent losses, buoyed by market interest despite a stronger US Dollar and higher US Treasury yields.
- De-escalation of Middle East tensions contributed to increased market stability, denting the appetite for Gold buying.
- US Durable Goods Orders were solid, but expectations for Fed rate cuts shift to later in the year.
Gold recovered some ground on Wednesday after posting back-to-back negative sessions during the beginning of the week as geopolitical risks abated. Better-than-expected economic data from the United States (US), a strong US Dollar, and higher US Treasury yields were not an excuse for golden metal buyers, who stepped in to buy the latest dip.
XAU/USD trades at $2,327 and has gained 0.28%. The Middle East conflict seems to have de-escalated following the fire’s interchange between Iran and Israel. Expectations for a Federal Reserve (Fed) rate cut in June and July vanished as most market participants speculate that the fed funds rate will be lowered for the first time in September 2024.
The US Department of Commerce showed that March’s Durable Goods Orders rose above estimates and February’s numbers, while core sales missed projections but showed an improvement compared to the previous month.
Daily digest market movers: Gold trims its losses amid upbeat Durable Goods Orders report
- US Durable Goods Orders significantly increased in March, expanding by 2.6% MoM, up from a 0.7% rise previously and surpassing 2.5%. When excluding transportation, Durable Goods Orders rose by 0.2% MoM, which was an improvement over February's 0.1% increase but fell short of the 0.3% projected.
- Upcoming Q1 GDP data, core PCE inflation figures will offer additional insights into potential timing of Fed's interest rate reductions. The Fed’s preferred inflation gauge, the core Personal Consumption Expenditures (PCE) Price Index, is estimated to remain steadily at 0.3%. The annual core PCE rate is expected to ease to 2.6%, down from February's rate of 2.8%, indicating potential softening of inflation pressure.
- Tuesday’s softer-than-expected S&P Global PMI report in the US increased odds for July rate cut. Chris Williamson, Chief Business Economist at S&P Global Market Intelligence, wrote: “The US economic upturn lost momentum at the start of the second quarter, with the flash PMI survey respondents reporting below-trend business activity growth in April.” This could help to bring down stubbornly sticky inflation, which remains well above the Fed's 2% core target.
- Data from the Chicago Board of Trade (CBOT) suggests that traders expect the fed funds rate to finish 2024 at 4.98%, up from 4.965% on Tuesday.
- US 10-year Treasury benchmark rate climbs six basis points (bps) at 4.66%.
- US Dollar Index (DXY) is up 0.18% to 105.87.
Technical Analysis: Gold price stays firm near $2,320
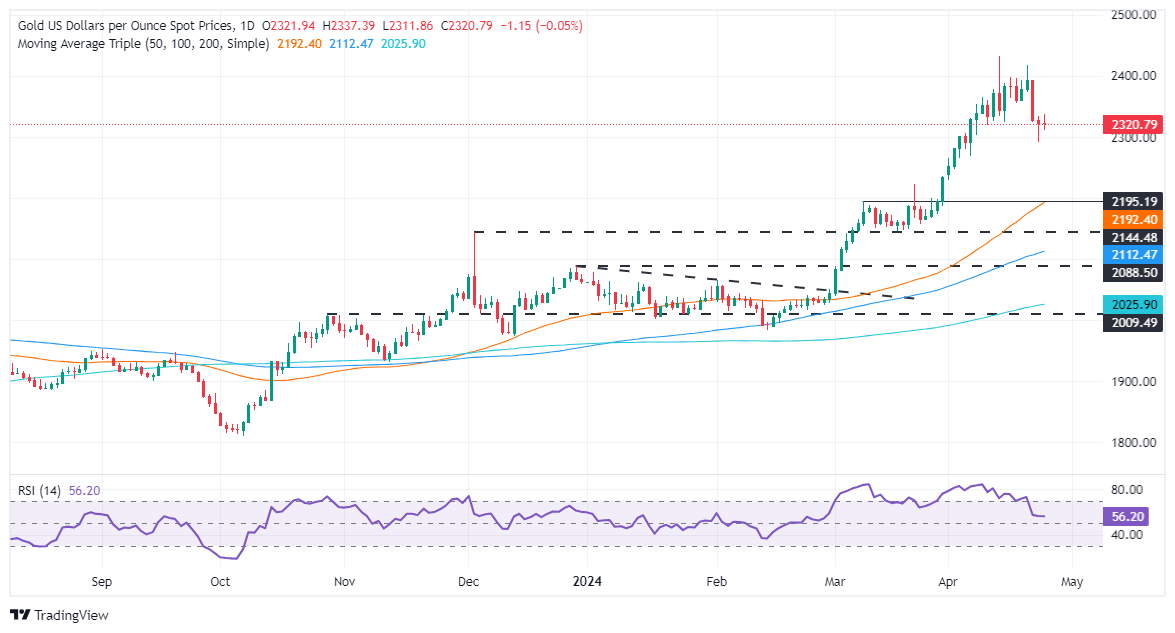
Gold recovered some ground despite forming a “bearish engulfing” chart pattern, which opened the door for a pullback. Although buyers have the upper hand on Wednesday, they are not out of the woods yet. They must push Gold’s spot price above the April 19 low of $2,373, so they can remain hopeful of testing $2,400. Once achieved, the next stop would be Friday’s high of $2,417, followed by the all-time high of $2,431.
On the flip side, if XAU/USD prices dip below the April 15 daily low of $2,324, that would pave the way to test $2,300. A breach of the latter will expose the March 21 high at $2,222.
Gold FAQs
Gold has played a key role in human’s history as it has been widely used as a store of value and medium of exchange. Currently, apart from its shine and usage for jewelry, the precious metal is widely seen as a safe-haven asset, meaning that it is considered a good investment during turbulent times. Gold is also widely seen as a hedge against inflation and against depreciating currencies as it doesn’t rely on any specific issuer or government.
Central banks are the biggest Gold holders. In their aim to support their currencies in turbulent times, central banks tend to diversify their reserves and buy Gold to improve the perceived strength of the economy and the currency. High Gold reserves can be a source of trust for a country’s solvency. Central banks added 1,136 tonnes of Gold worth around $70 billion to their reserves in 2022, according to data from the World Gold Council. This is the highest yearly purchase since records began. Central banks from emerging economies such as China, India and Turkey are quickly increasing their Gold reserves.
Gold has an inverse correlation with the US Dollar and US Treasuries, which are both major reserve and safe-haven assets. When the Dollar depreciates, Gold tends to rise, enabling investors and central banks to diversify their assets in turbulent times. Gold is also inversely correlated with risk assets. A rally in the stock market tends to weaken Gold price, while sell-offs in riskier markets tend to favor the precious metal.
The price can move due to a wide range of factors. Geopolitical instability or fears of a deep recession can quickly make Gold price escalate due to its safe-haven status. As a yield-less asset, Gold tends to rise with lower interest rates, while higher cost of money usually weighs down on the yellow metal. Still, most moves depend on how the US Dollar (USD) behaves as the asset is priced in dollars (XAU/USD). A strong Dollar tends to keep the price of Gold controlled, whereas a weaker Dollar is likely to push Gold prices up.
- Dow Jones falls back below 38,400 and then recovers as risk appetite wobbles.
- US Durable Goods Orders missed forecasts, but still climbed.
- US GDP, PCE inflation are key data highlights for the rest of the week.
The Dow Jones Industrial Average (DJIA) stumbled on Wednesday, falling from recent highs near 38,550.00 as investors ease off of Tuesday’s risk appetite. The index recovered heading into the late American trading session as US data continues to vex financial markets that remain overwhelmingly focused on rate cuts from the US Federal Reserve.
US Durable Goods Orders in March failed to meet modelled forecasts, with Durable Goods Orders Excluding Defense rising 2.3% versus the forecast 2.5%, and Durable Goods Orders Excluding Transportation rising only 0.2% against the forecast 0.3%. Despite missing forecasts, both figures beat their previous prints handily (1.5% revised from 2.2% and 0.1% revised from 0.5%, respectively). Headline Durable Goods Orders rose 2.6% MoM compared to the previous month’s 0.7% (revised from 1.4%).
The uptick in US activity throws a wrench in market hopes for an accelerated path towards rate cuts that were reignited on Tuesday after the US’ Purchasing Managers Index (PMI) figures missed expectations. Markets will now to turn to Thursday’s US Gross Domestic Product (GDP) and Friday’s US Personal Consumption Expenditure (PCE) inflation. US GDP is expected to ease to 2.5% for the annualized first quarter from the previous 3.4%, while Core US PCE Price Index inflation is expected to hold steady at 0.3% MoM in March.
Dow Jones news
The Dow Jones is recovering from an early US session dip, which briefly drove it back below 38,300.00. The major equity index is now churning near 38,500.00. Earnings season is in full swing, with Meta Platforms (META), IBM (IBM), and Chipotle (CMG) all reporting earnings after market close on Wednesday. Corporate earnings are helping to bolster equity valuations, but batter rate-cut hopefuls continue to weigh on investors’ outlook, crimping recent gains.
Close to half of the individual equities that make up the Dow Jones are currently in the red for Wednesday, with the loss leaders including Boeing Co. (BA) and Home Depot Inc. (HD), down 2.75% and 1.76%, respectively at the time of writing. Topside in the DJIA goes to Coca-Cola Co. (KO) and Intel Corp. (INTC), each up around 1.3% on the day.
Dow Jones technical outlook
The Dow Jones set an early high for Wednesday at 38,558.96, with the day’s low etched in at 38,925.14. Overall momentum is still tilting into the bullish side, with the index up 2.35% from the last swing low near 37,500.00.
The Dow Jones is set to break a three-day winning streak as the major index grapples on the softly down side. The DJIA remains hamstung in a tricky midrange between the last major swing high approaching 40,000.00 and the 200-day Exponential Moving Average (EMA) providing major technical support from 36,720.70.
Dow Jones five minute chart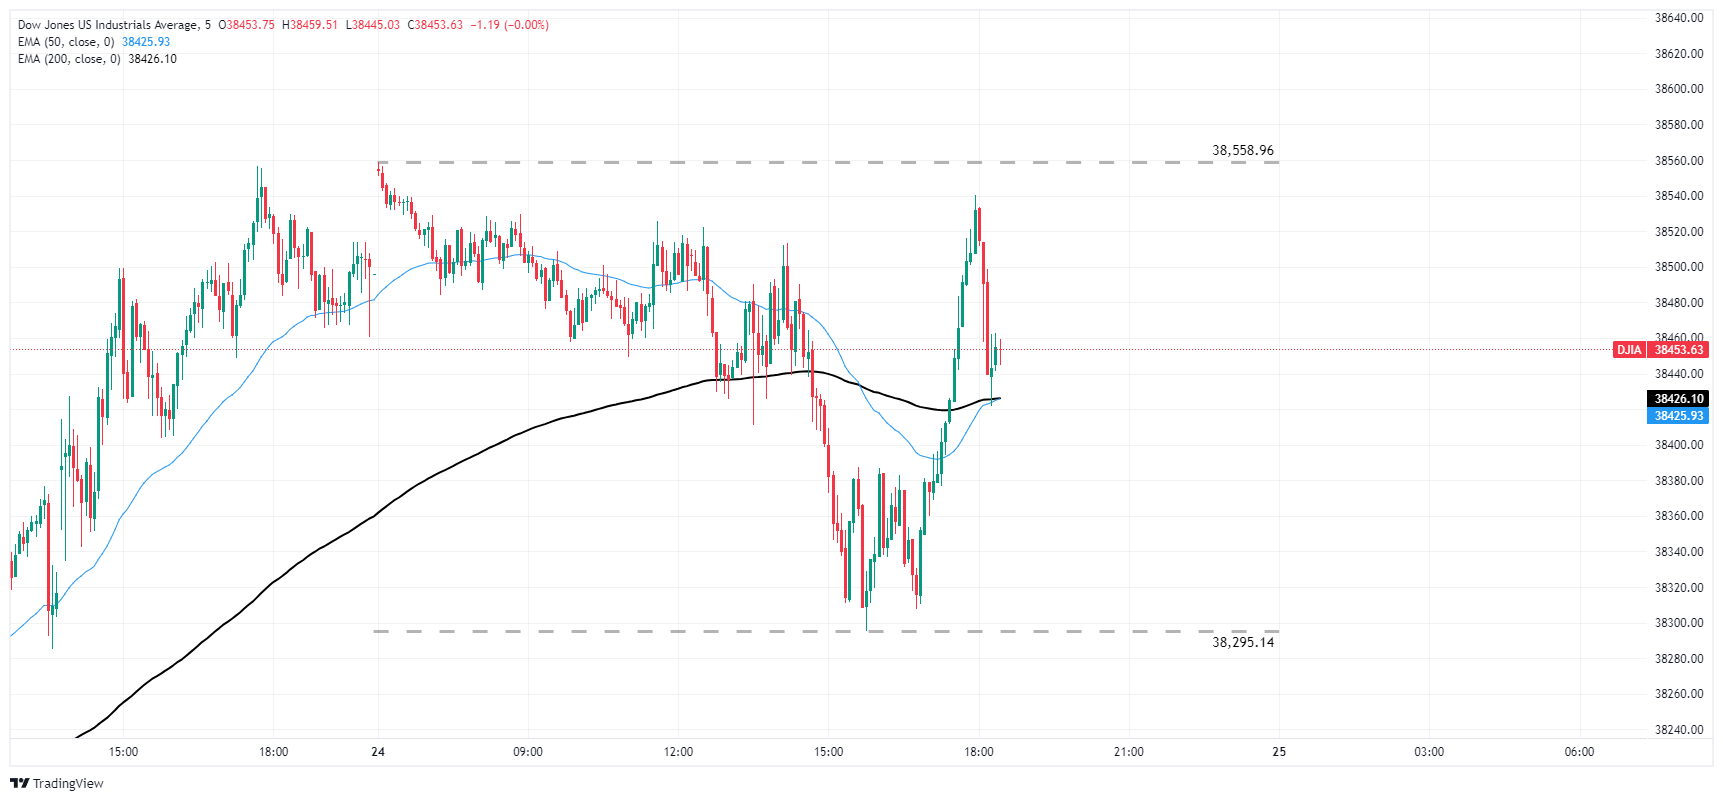
Dow Jones daily chart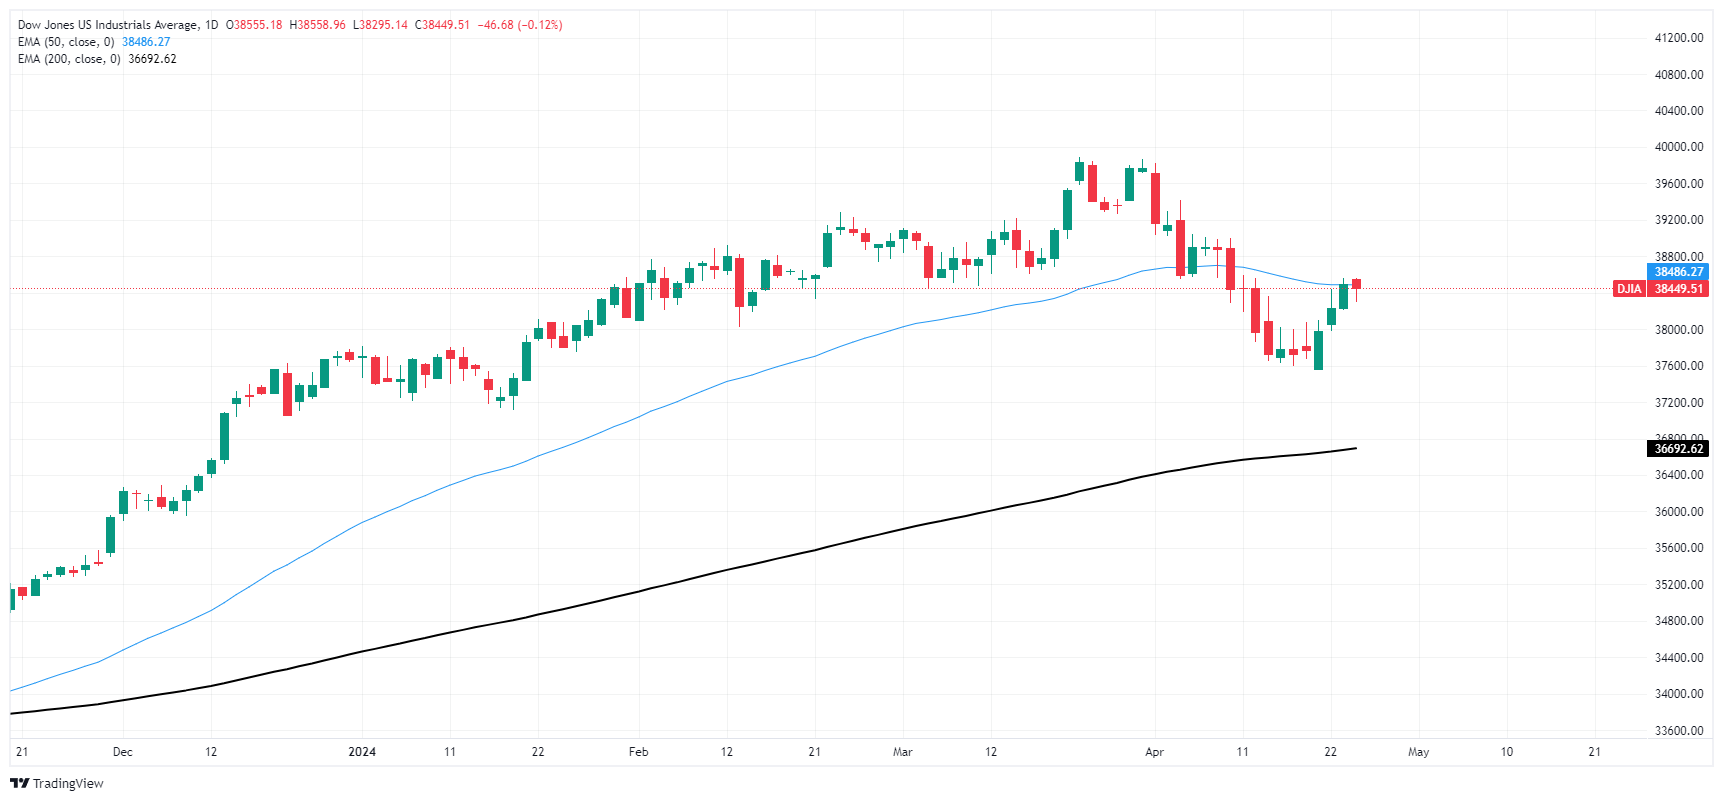
Dow Jones FAQs
The Dow Jones Industrial Average, one of the oldest stock market indices in the world, is compiled of the 30 most traded stocks in the US. The index is price-weighted rather than weighted by capitalization. It is calculated by summing the prices of the constituent stocks and dividing them by a factor, currently 0.152. The index was founded by Charles Dow, who also founded the Wall Street Journal. In later years it has been criticized for not being broadly representative enough because it only tracks 30 conglomerates, unlike broader indices such as the S&P 500.
Many different factors drive the Dow Jones Industrial Average (DJIA). The aggregate performance of the component companies revealed in quarterly company earnings reports is the main one. US and global macroeconomic data also contributes as it impacts on investor sentiment. The level of interest rates, set by the Federal Reserve (Fed), also influences the DJIA as it affects the cost of credit, on which many corporations are heavily reliant. Therefore, inflation can be a major driver as well as other metrics which impact the Fed decisions.
Dow Theory is a method for identifying the primary trend of the stock market developed by Charles Dow. A key step is to compare the direction of the Dow Jones Industrial Average (DJIA) and the Dow Jones Transportation Average (DJTA) and only follow trends where both are moving in the same direction. Volume is a confirmatory criteria. The theory uses elements of peak and trough analysis. Dow’s theory posits three trend phases: accumulation, when smart money starts buying or selling; public participation, when the wider public joins in; and distribution, when the smart money exits.
There are a number of ways to trade the DJIA. One is to use ETFs which allow investors to trade the DJIA as a single security, rather than having to buy shares in all 30 constituent companies. A leading example is the SPDR Dow Jones Industrial Average ETF (DIA). DJIA futures contracts enable traders to speculate on the future value of the index and Options provide the right, but not the obligation, to buy or sell the index at a predetermined price in the future. Mutual funds enable investors to buy a share of a diversified portfolio of DJIA stocks thus providing exposure to the overall index.
- The daily RSI reveals increasing buying momentum, yet nearing overbought conditions hint at a potential technical correction ahead.
- The hourly chart indicates a shift in short-term momentum towards sellers, and indicators consolidate.
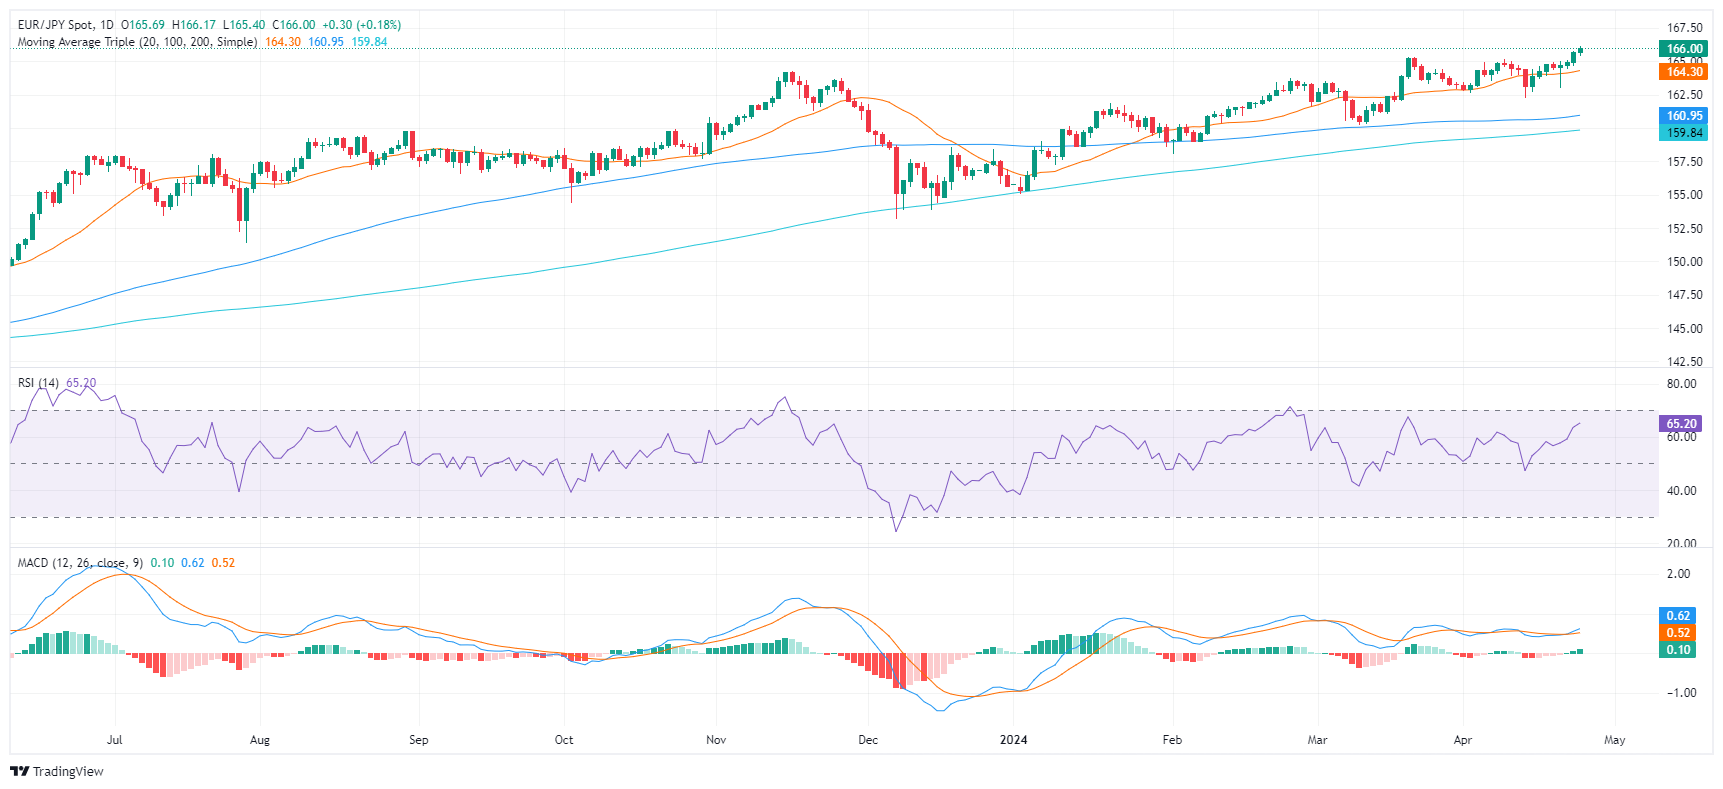
The EUR/JPY stands at 165.68, trading with mild gains still in multi-year highs. Current market trends lean towards bullish momentum, keeping buyers in a favorable position. However, daily indicators are nearing overbought conditions, while the hourly ones have already reached that threshold and seem to be consolidating ahead of the Asian session.
The Relative Strength Index (RSI) on the daily chart reveals a positive trend. It has climbed since mid-April from the mid-40s deep into positive territory with the latest reading at 65. This increase in RSI reveals that buyers have recently dominated the market. However, an approach towards the overbought threshold suggests a potential future market correction looming.
EUR/JPY Daily Chart
On the other hand, the hourly chart shows a slight fluctuation in RSI values, which have swung between 48 and 71 during the session and buyers now seem to be taking a breather. The Moving Average Convergence Divergence (MACD) prints flat green bars, adding arguments to a stagnant momentum.
EUR/JPY Hourly Chart
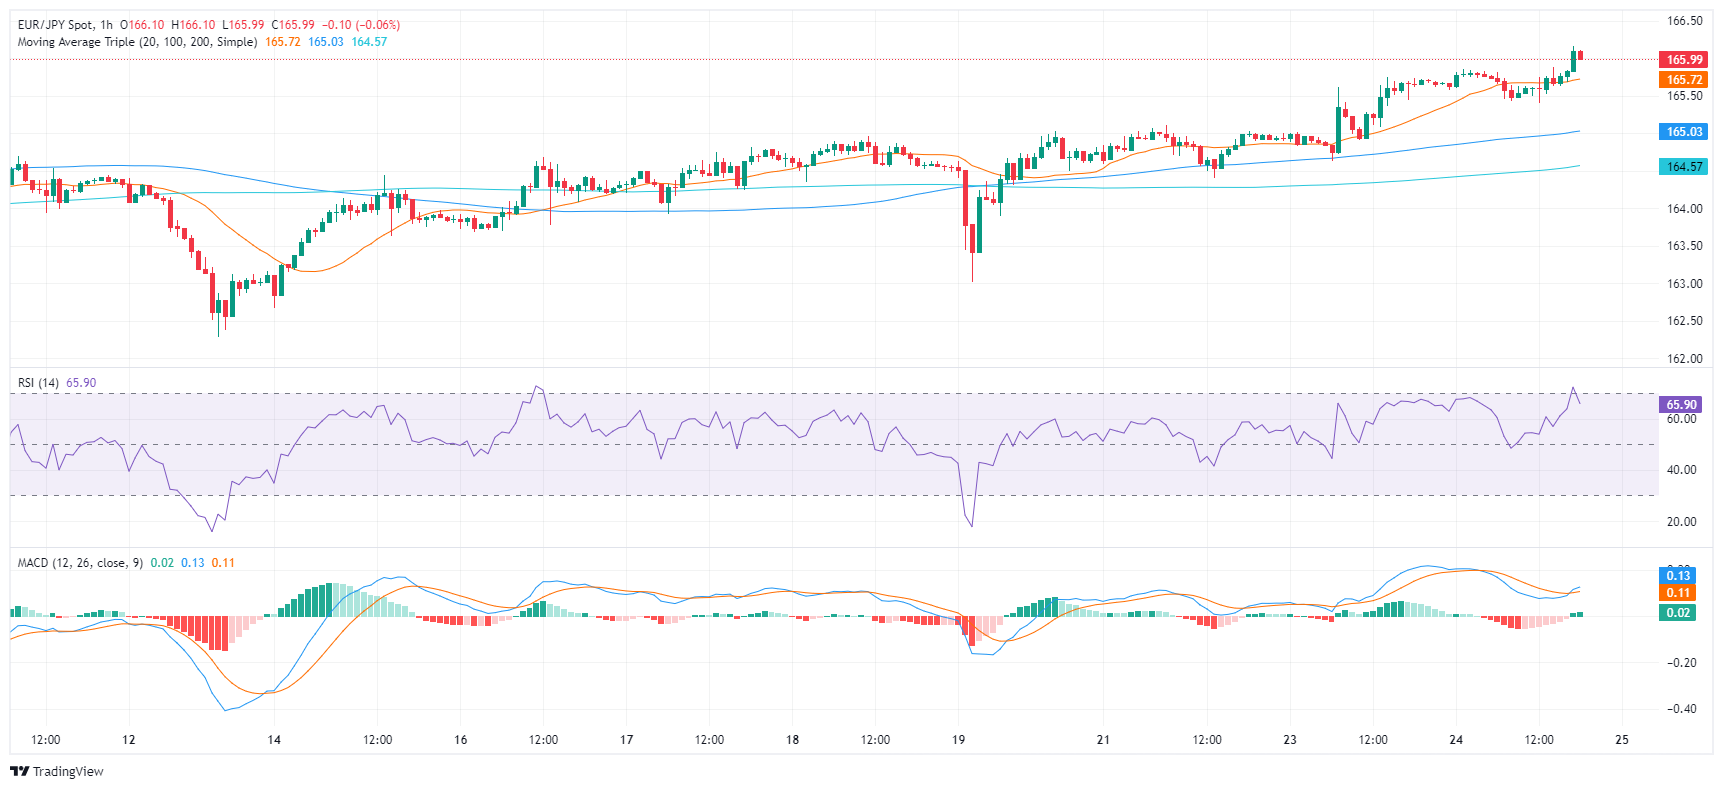
Regarding the overall trend, the EUR/JPY displays a bullish trajectory in the short term while maintaining its position above its 20-day Simple Moving Average (SMA). Turning to a longer time frame, the pair remains above 100- and 200-day SMAs. Such positioning could hint at the potential continuation of bullishness for the EUR/JPY pair.
The Greenback regained composure and kept the recent optimism in the risk complex on check ahead of the publication of US GDP figures and inflation gauged by the PCE later in the week.
Here is what you need to know on Thursday, April 25:
The USD Index (DXY) managed to reclaim some ground lost and approached the 106.00 region helped by rising US yields. On April 25, the advanced Q1 GDP Growth Rate will take centre stage seconded by usual weekly Initial Jobless Claims, and Pending Home sales
EUR/USD traded in a tight range and remained close to the key 1.0700 zone amidst the tepid bounce in the Dollar. Germany’s Consumer Confidence, tracked by GfK, is due on April 25.
GBP/USD ended Thursday’s session barely changed around the 1.2450 zone, or three-day highs. The CBI Distributive Trades is expected on April 25.
USD/JPY broke above the 155.00 barrier to print a new 34-year high amidst unabated intervention fears. The Japanese calendar will include weekly Foreign Bond Investment and the final Coincident Index and Leading Economic Index on April 25.
AUD/USD climbed to multi-session tops north of the 0.6500 barrier, extending the recovery for the third day in a row. There will be no data releases Down Under on April 25.
Prices of WTI left behind three straight sessions of gains on the back of a stronger dollar, demand concerns and despite the larger-than-expected drop of US crude oil stockpiles.
Gold edged a tad higher following two consecutive daily retracements, regaining some balance after Tuesday’s three-week lows. Silver resumed its weekly downtrend and revisited the vicinity of the $27.00 mark per ounce.
- Canadian Dollar recedes across the board on Wednesday.
- Canada Retail Sales broadly miss the mark, hurting Loonie.
- US GDP, PCE inflation to dominate the latter half of the trading week.
The Canadian Dollar (CAD) is broadly softer on Wednesday, paring back recent gains and falling back against all of its major currency peers as the single worst-performing currency for the mid-week market session. Canadian Retail Sales flubbed forecasts, declining in February and kicking the legs out from beneath the CAD.
Canada is absent from the economic calendar for the remainder of the week, and investors will be pivoting to focus on key US data. US Gross Domestic Product (GDP) and US Personal Consumption Expenditure (PCE) Price Index inflation figures are slated for Thursday and Friday, respectively.
Daily digest market movers: Canadian Dollar pares gains as Canadian data slips
- MoM Canadian Retail Sales declined -0.1% in February, improving from the previous month’s -0.3% decline but missing the forecasted 0.1% uptick.
- Retail Sales Excluding Autos also tumbled -0.3% versus the forecast of 0.0%. January’s print was revised slightly lower to 0.4% from 0.5%.
- A broad-market recovery in the US Dollar is further pressuring CAD as investors rethink Tuesday’s broad risk appetite rally.
- Thursday’s Q1 US GDP is expected to print at 2.5% on an annualized basis, down from the previous print of 3.4%.
- Traders are hoping that Friday’s US PCE Price Index holds steady at 0.3% in March.
- Financial markets desperate for signs of rate cuts from the US Federal Reserve (Fed) have grown increasingly frustrated with ongoing signs of stubborn inflation in the US economy. Friday’s figures will drive plenty of volatility as markets grapple with rate cut forecasts.
Canadian Dollar price today
The table below shows the percentage change of Canadian Dollar (CAD) against listed major currencies today. Canadian Dollar was the strongest against the Swiss Franc.
| USD | EUR | GBP | CAD | AUD | JPY | NZD | CHF | |
| USD | 0.14% | 0.12% | 0.43% | 0.00% | 0.22% | 0.19% | 0.26% | |
| EUR | -0.15% | -0.03% | 0.29% | -0.13% | 0.07% | 0.04% | 0.09% | |
| GBP | -0.12% | 0.03% | 0.32% | -0.10% | 0.10% | 0.08% | 0.13% | |
| CAD | -0.43% | -0.28% | -0.33% | -0.42% | -0.21% | -0.24% | -0.19% | |
| AUD | 0.00% | 0.11% | 0.10% | 0.41% | 0.16% | 0.18% | 0.24% | |
| JPY | -0.23% | -0.10% | -0.10% | 0.24% | -0.21% | 0.00% | 0.02% | |
| NZD | -0.16% | -0.04% | -0.06% | 0.23% | -0.18% | 0.04% | 0.06% | |
| CHF | -0.26% | -0.10% | -0.13% | 0.19% | -0.24% | -0.03% | -0.06% |
The heat map shows percentage changes of major currencies against each other. The base currency is picked from the left column, while the quote currency is picked from the top row. For example, if you pick the Euro from the left column and move along the horizontal line to the Japanese Yen, the percentage change displayed in the box will represent EUR (base)/JPY (quote).
Technical analysis: Canadian Dollar falls across the board, USD/CAD pulls back to key technical levels
The Canadian Dollar (CAD) has weakened against all of the other major currencies on Wednesday, shedding four-tenths of a percent against the Australian Dollar (AUD) and the USD. The CAD’s least losses are against the Swiss Franc (CHF) and the Japanese Yen (JPY), falling around a fifth of a percent apiece.
The USD/CAD has risen back above the 1.3700 handle, testing chart territory north of the 200-hour Exponential Moving Average (EMA) near 1.3715. The pair bounced off the 1.3660 level to pare away Tuesday’s declines.
Wednesday’s pullback sends the USD/CAD into its first green trading day after five consecutive losing days. The pair is still down from the last swing high into 1.3850, and long-term technical support from the 200-day EMA rests near the 1.3500 handle at 1.3522.
USD/CAD hourly chart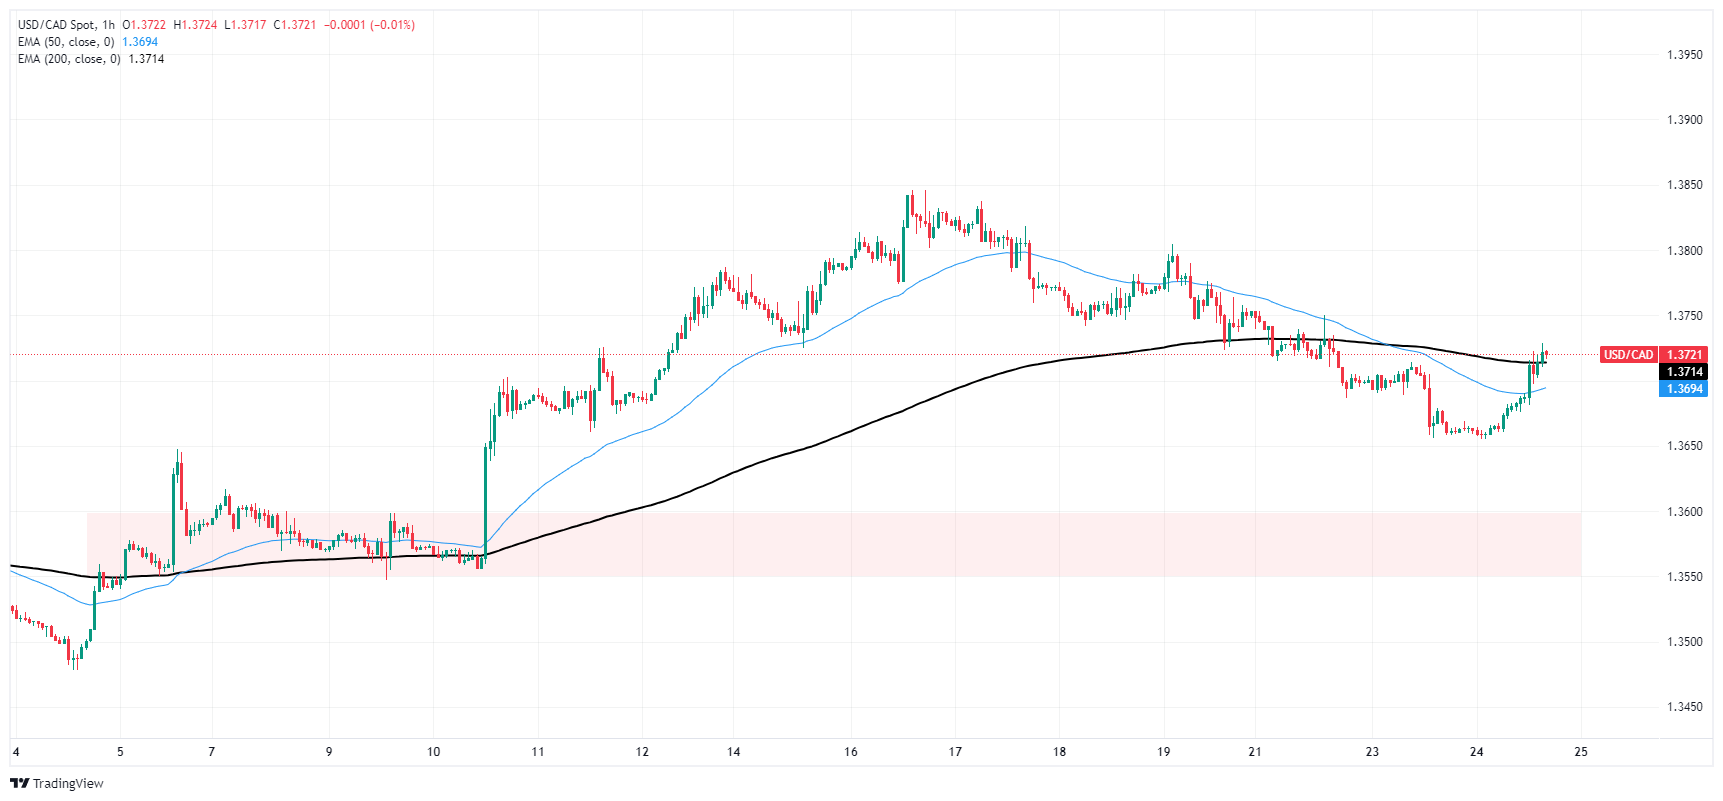
USD/CAD daily chart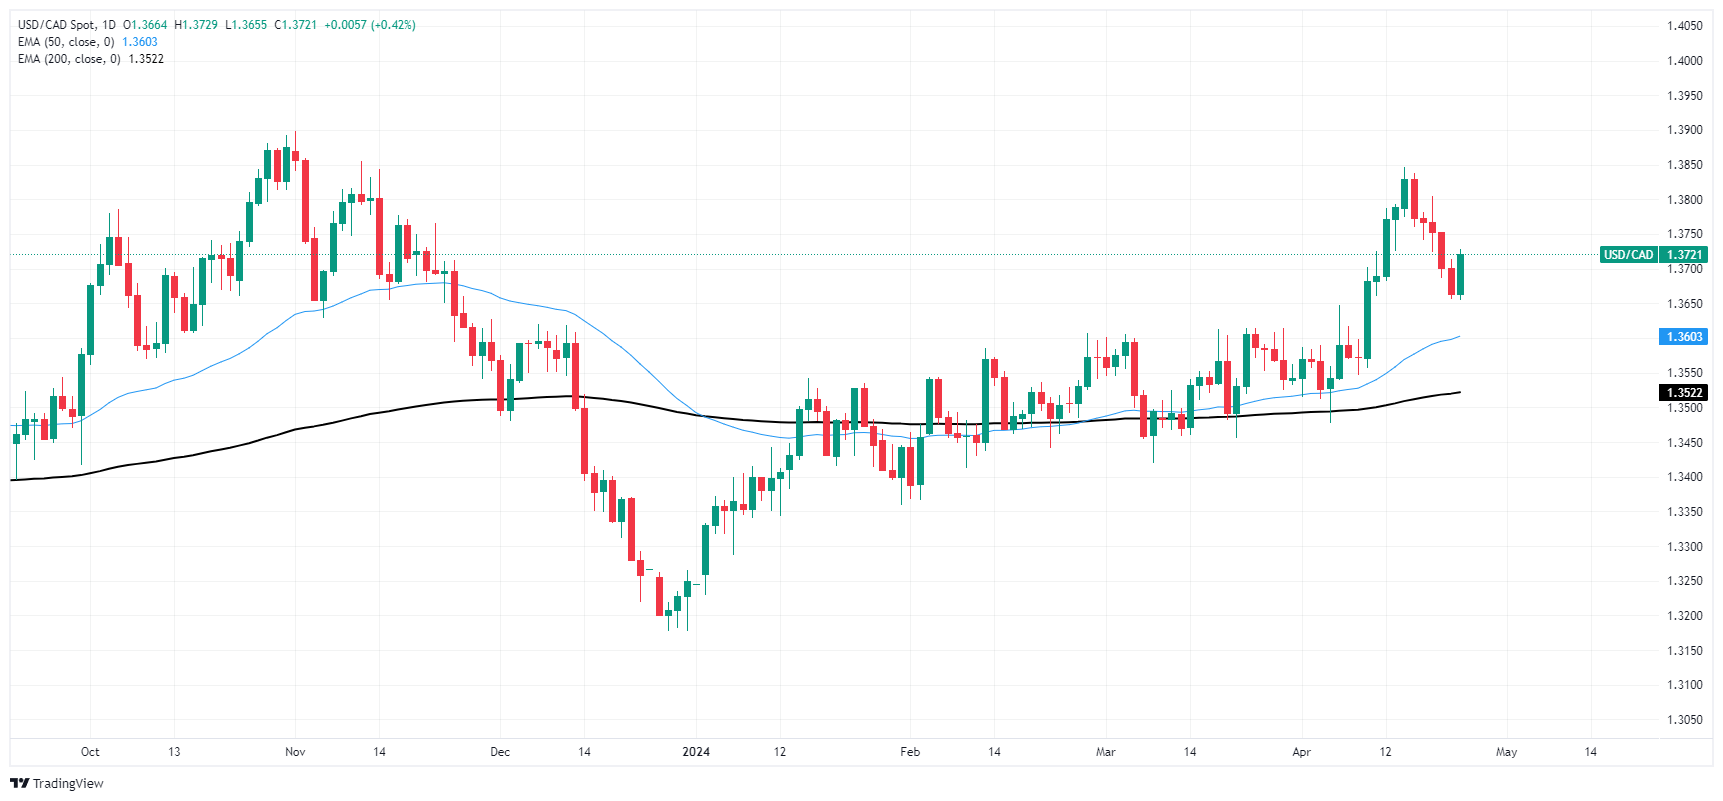
Canadian Dollar FAQs
The key factors driving the Canadian Dollar (CAD) are the level of interest rates set by the Bank of Canada (BoC), the price of Oil, Canada’s largest export, the health of its economy, inflation and the Trade Balance, which is the difference between the value of Canada’s exports versus its imports. Other factors include market sentiment – whether investors are taking on more risky assets (risk-on) or seeking safe-havens (risk-off) – with risk-on being CAD-positive. As its largest trading partner, the health of the US economy is also a key factor influencing the Canadian Dollar.
The Bank of Canada (BoC) has a significant influence on the Canadian Dollar by setting the level of interest rates that banks can lend to one another. This influences the level of interest rates for everyone. The main goal of the BoC is to maintain inflation at 1-3% by adjusting interest rates up or down. Relatively higher interest rates tend to be positive for the CAD. The Bank of Canada can also use quantitative easing and tightening to influence credit conditions, with the former CAD-negative and the latter CAD-positive.
The price of Oil is a key factor impacting the value of the Canadian Dollar. Petroleum is Canada’s biggest export, so Oil price tends to have an immediate impact on the CAD value. Generally, if Oil price rises CAD also goes up, as aggregate demand for the currency increases. The opposite is the case if the price of Oil falls. Higher Oil prices also tend to result in a greater likelihood of a positive Trade Balance, which is also supportive of the CAD.
While inflation had always traditionally been thought of as a negative factor for a currency since it lowers the value of money, the opposite has actually been the case in modern times with the relaxation of cross-border capital controls. Higher inflation tends to lead central banks to put up interest rates which attracts more capital inflows from global investors seeking a lucrative place to keep their money. This increases demand for the local currency, which in Canada’s case is the Canadian Dollar.
Macroeconomic data releases gauge the health of the economy and can have an impact on the Canadian Dollar. Indicators such as GDP, Manufacturing and Services PMIs, employment, and consumer sentiment surveys can all influence the direction of the CAD. A strong economy is good for the Canadian Dollar. Not only does it attract more foreign investment but it may encourage the Bank of Canada to put up interest rates, leading to a stronger currency. If economic data is weak, however, the CAD is likely to fall.
- US Dollar rally is likely to continue, fueled by resilient US economy and higher US Treasury yields.
- Durable Goods Orders from March were solid.
- Hawkish bets on the Fed might also benefit the US Dollar.
The US Dollar Index (DXY) is trading mildly higher at 105.90, buoyed by high US yields amidst hawkish bets on the Federal Reserve (Fed). The US economy continues to display robust growth, which has forced markets to delay their expectations on rate cuts.
In the US, the Fed maintains a steady hawkish stance despite soft preliminary PMIs in April. Additionally, persistent high US Treasury yields due to heavy supply injection could further boost the US Dollar. The week’s highlight will be March’s Personal Consumption Expenditures (PCE) on Friday and Gross Domestic Product (GDP) preliminary readings from Q1 on Thursday.
Daily digest market movers: DXY holds gains after mid-tier data
- Durable Goods Orders reported a 2.6% increase in March, albeit with the previous surge of 1.3% significantly revised to 0.7%.
- Orders Excluding Transport posted a rise to 0.2%, reversing a revised decrease from 0.3% to just 0.1%.
- Fed’s present stance on monetary policy implies that easing expectations remain low and steady. The market forecasts low chances for a rate cut in the upcoming June meeting, while July sees a diminished likelihood at 45%. By September, a rate cut still isn't entirely anticipated with probabilities reduced to 90%.
- US Treasury bond yields showcase a mixed tendency. The two-year bond yield is seen at 4.93%, the 2-year yield at 4.66%, and the 10-year bond yield stands at 4.65%. Despite the mixed movement in yields on Wednesday, increasing US Treasury yields generally support Greenback strength.
DXY technical analysis: DXY bullish momentum continues flat, markets await direction
The indicators on the daily chart reflect a mixed scenario. The flat position of the Relative Strength Index (RSI) in positive territory indicates that the buying momentum is present but somewhat subdued as there seems no definitive direction. This suggests that bulls are exerting control but are struggling to gain further ground.
The decreasing green bars of the Moving Average Convergence Divergence (MACD) hint at slowing bullish momentum, making a potential transformative shift into bearish territory possible as the selling force starts to press forward.
However, the bigger picture is slightly more nuanced. Despite this sluggish bullish momentum in the short term, the DXY is currently trading above its 20,100 and 200-day Simple Moving Averages (SMAs). This not only points toward persistent buying pressure but also signals a more long-term bullish bias.
US Dollar FAQs
The US Dollar (USD) is the official currency of the United States of America, and the ‘de facto’ currency of a significant number of other countries where it is found in circulation alongside local notes. It is the most heavily traded currency in the world, accounting for over 88% of all global foreign exchange turnover, or an average of $6.6 trillion in transactions per day, according to data from 2022. Following the second world war, the USD took over from the British Pound as the world’s reserve currency. For most of its history, the US Dollar was backed by Gold, until the Bretton Woods Agreement in 1971 when the Gold Standard went away.
The most important single factor impacting on the value of the US Dollar is monetary policy, which is shaped by the Federal Reserve (Fed). The Fed has two mandates: to achieve price stability (control inflation) and foster full employment. Its primary tool to achieve these two goals is by adjusting interest rates. When prices are rising too quickly and inflation is above the Fed’s 2% target, the Fed will raise rates, which helps the USD value. When inflation falls below 2% or the Unemployment Rate is too high, the Fed may lower interest rates, which weighs on the Greenback.
In extreme situations, the Federal Reserve can also print more Dollars and enact quantitative easing (QE). QE is the process by which the Fed substantially increases the flow of credit in a stuck financial system. It is a non-standard policy measure used when credit has dried up because banks will not lend to each other (out of the fear of counterparty default). It is a last resort when simply lowering interest rates is unlikely to achieve the necessary result. It was the Fed’s weapon of choice to combat the credit crunch that occurred during the Great Financial Crisis in 2008. It involves the Fed printing more Dollars and using them to buy US government bonds predominantly from financial institutions. QE usually leads to a weaker US Dollar.
Quantitative tightening (QT) is the reverse process whereby the Federal Reserve stops buying bonds from financial institutions and does not reinvest the principal from the bonds it holds maturing in new purchases. It is usually positive for the US Dollar.
- Mexican Peso weakens against US Dollar, with USD/MXN climbing 0.74% following mixed Mexican inflation report, robust US Durable Goods Orders.
- Mexico's CPI for mid-April shows mixed signals, potentially influencing Banxico's upcoming rate decision in May.
- USD/MXN gains momentum past the 17.00 mark as Treasury yields rise, underscoring stronger demand for Greenback.
The Mexican Peso weakens on Wednesday as the North American session begins, following a mixed inflation report for the first half of April. Mexico’s Consumer Price Index (CPI) rose above expectations, while underlying CPI declined sharply. An upbeat Durable Goods report in the United States (US) sponsored a leg up in the exotic pair. The USD/MXN trades at 17.11, 0.94% above its opening price, after bouncing off weekly lows at 16.90.
Mexico’s National Statistics Agency (INEGI) revealed that mid-month inflation rose above estimates and March’s reading on a yearly basis. In the meantime, the annual Core CPI number was below last month’s data. The mixed reading would prevent the Bank of Mexico (Banxico) from cutting rates at the May meeting.
Across the border, the US Commerce Department revealed that Durable Goods Orders rose above estimates, while core orders improved compared to February’s reading but missed forecasts.
After the data, the USD/MXN broke above the 17.00 figure and extended its gains. The rise in US Treasury yields lent a lifeline to the Greenback, which, according to the US Dollar Index (DXY), rose 0.24% at the brink of reclaiming the 106.00 threshold.
Daily digest market movers: Mexican Peso depreciates following strong Durable Goods Orders
- Mexico’s National Statistics Agency (INEGI) revealed that mid-month CPI rose by 4.63% YoY, above March’s reading and estimate of 4.48%. Monthly, inflation increased 0.09%, missing forecasts of 0.03%.
- The core CPI edged lower compared to last month's figures. It rose by 4.39% YoY as expected, down from 4.69%, a 0.3% decrease. MoM data showed that core prices rose 0.16%, aligned with estimates.
- Citibanamex Survey showed that most analysts expect Banxico to hold rates unchanged at the May meeting. The median foresees a rate cut in June, while they estimate the main reference rate to end at 10.00%, up from 9.63% previously.
- Banxico Governor Victoria Rodriguez Ceja said that service inflation is not slowing as expected. She added that the Peso’s strength has helped to temper inflationary pressures and lower imported goods. She emphasized that Banxico would remain data-dependent.
- Mexico’s economy is faring well as Economic Activity expanded in February compared to January’s data. Figures increased by 1.4% MoM and 4.4% YoY in the second month of the year, up from January’s 0.9% and 1.9% expansion, respectively.
- US Durable Goods Orders in March expanded by 2.6% MoM, up from 0.7%, and exceeded forecasts of 2.5%. Excluding Transport, they increased 0.2% MoM, higher than February’s 0.1% but missed projections of 0.3%.
- Data from the Chicago Board of Trade (CBOT) suggests that traders expect the Fed funds rate to finish 2024 at 4.98%, up from 4.965% on Tuesday.
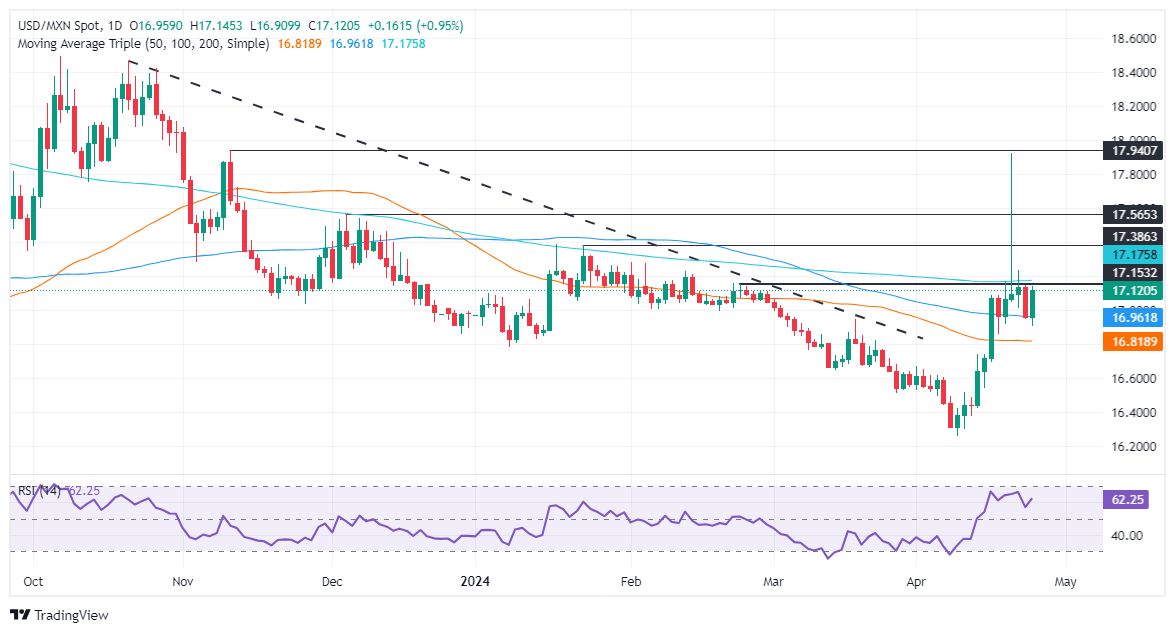
Technical analysis: Mexican Peso on backfoot as USD/MXN rallies toward 200-day SMA
The Mexican Peso loses traction as the USD/MXN aims toward the 200-day Simple Moving Average (SMA) at 17.16. Once surpassed, this SMA clears the way for buyers to push prices toward the January 23 high at 17.38. The next resistance would be December 5’s 17.56 and the 18.00 figure.
Although the exotic pair trades below the 200-day SMA, the Relative Strength Index (RSI) shows that bullish momentum is growing, which means that shorts are vulnerable to a short squeeze.
On the other hand, if USD/MXN edged below the 17.00 figure, that would open the way to testing the 100-day SMA at 16.96. A breach of the latter would expose the 50-day SMA at 16.81.
Mexican Peso FAQs
The Mexican Peso (MXN) is the most traded currency among its Latin American peers. Its value is broadly determined by the performance of the Mexican economy, the country’s central bank’s policy, the amount of foreign investment in the country and even the levels of remittances sent by Mexicans who live abroad, particularly in the United States. Geopolitical trends can also move MXN: for example, the process of nearshoring – or the decision by some firms to relocate manufacturing capacity and supply chains closer to their home countries – is also seen as a catalyst for the Mexican currency as the country is considered a key manufacturing hub in the American continent. Another catalyst for MXN is Oil prices as Mexico is a key exporter of the commodity.
The main objective of Mexico’s central bank, also known as Banxico, is to maintain inflation at low and stable levels (at or close to its target of 3%, the midpoint in a tolerance band of between 2% and 4%). To this end, the bank sets an appropriate level of interest rates. When inflation is too high, Banxico will attempt to tame it by raising interest rates, making it more expensive for households and businesses to borrow money, thus cooling demand and the overall economy. Higher interest rates are generally positive for the Mexican Peso (MXN) as they lead to higher yields, making the country a more attractive place for investors. On the contrary, lower interest rates tend to weaken MXN.
Macroeconomic data releases are key to assess the state of the economy and can have an impact on the Mexican Peso (MXN) valuation. A strong Mexican economy, based on high economic growth, low unemployment and high confidence is good for MXN. Not only does it attract more foreign investment but it may encourage the Bank of Mexico (Banxico) to increase interest rates, particularly if this strength comes together with elevated inflation. However, if economic data is weak, MXN is likely to depreciate.
As an emerging-market currency, the Mexican Peso (MXN) tends to strive during risk-on periods, or when investors perceive that broader market risks are low and thus are eager to engage with investments that carry a higher risk. Conversely, MXN tends to weaken at times of market turbulence or economic uncertainty as investors tend to sell higher-risk assets and flee to the more-stable safe havens.
- AUD/USD continues its recovery after Australian Q1 CPI data shows inflation stickier-than-forecast.
- The result is likely to keep interest rates in Australia higher for a longer time than other G10 nations.
- Bullish reversal signs are increasing on charts, suggesting the possibility of a trend reversal in the making.
AUD/USD trades off the highs of the day just below 0.6500 on Wednesday, after peaking at 0.6530 overnight following the release of stickier-than-expected Australian inflation data, which showed price gains were higher in Q1 than economists had predicted.
The Q1 Consumer Price Index (CPI) data rose by 3.6% instead of the 3.4% the market had expected, and the price stickiness reflected in the data suggests the Reserve Bank of Australia (RBA) will be even less likely to cut interest rates in the near-term.
The CPI data was a catalyst for an extension of the recovery in AUD/USD since the expectations of interest rates remaining high for longer is positive for the Australian Dollar. Higher interest rates mean more foreign capital inflows, boosting demand for AUD.
AUD/USD leads major currencies after CPI data
AUD/USD has seen three up-days in a row on Wednesday (so far), and it is the strongest performing G10 currency over a five-day view.
Due to persistent inflation, of which Wednesday’s CPI data is further evidence, the RBA is seen as the last major G10 central bank to cut interest rates, according to Rabobank. This in turn is likely to provide a backwind for the Aussie Dollar.
“Ahead of this morning’s release of Australian Q1 CPI inflation data, the market was already of the view that the RBA would be one of the last G10 central banks to cut rates this cycle. Today’s stronger than expected readings reinforces this risk and highlights Rabobank’s house view that the RBA’s forthcoming easing cycle is likely to be extremely shallow,” Rabobank said in a note on Wednesday.
The higher-than-expected inflation rate in Q1 is likely to force the RBA to revise up its inflation forecasts at the May meeting. Taken together with the weak US PMI data on Tuesday, which dented the myth of US economic exceptionalism, Rabobank are of the view that AUD/USD will continue higher.
“This week’s US and Australia data releases have reinforced our view that AUD/USD is likely to trend higher later in the year and into 2025.”
The RBA is now unlikely to make its first rate cut until November, says the bank.
“Market implied policy rates are currently pointing to a very small increase in the cash rate on a 6-month view, which reflects the rise in skepticism about the ability of the RBA to cut rates at all this year. Rabobank’s view is that the RBA will cut rates only twice in the forthcoming cycle starting in November,” Rabobank said.
An RBA cut in November now unlikely, says TD Securities
Analysts at TD Securities go further and scrap their call for the RBA to cut interest rates in November, seeing a rate cut now not materializing till February 2025.
“We now expect the RBA to deliver its first cut in Feb’25. The RBA is likely to adopt a more hawkish stance, but one that it's loath to act upon. Paying Aug'24 RBA OIS as insurance makes sense,” says TD Securities.
If they are right then this is likely to fuel an even stronger rise in AUD/USD.
AUD/USD still unlikely to rise unless US yields fall – Societe Generale
It is important to consider the other side of the AUD/USD pair too – the US Dollar.
AUD/USD will remain stuck even after the stickier Q1 data unless US yields provide a helping hand by also falling, according to analysts at Societe Generale.
“It would still take a retracement in US yields for AUD/USD to gain traction above 0.6500, even if the RBA is less likely to cut rates this year,” they comment.
Technical Analysis: AUD/USD showing signs of a bullish reversal
AUD/USD is showing some early technical signs that point to a possible bullish reversal.
This is especially the case on the 4-hour and daily charts.
The AUD/USD daily chart below shows a bullish Dragonfly Doji candlestick reversal pattern (circled) at the recent Friday April 19 lows. This was followed by a green up day on Monday, providing bullish confirmation.
The inference is that AUD/USD is undergoing a reversal, albeit one of short duration.
AUD/USD Daily Chart
If Wednesday ends as a green up-candle as looks likely it will provide further evidence the trend is reversing, since according to technical analysts three consecutive up-days are a sign of trend reversal.
AUD/USD’s 4-hour chart is also showing bullish reversal insignia and it could be argued the trend in the short-term has now reversed.
4-hour Chart
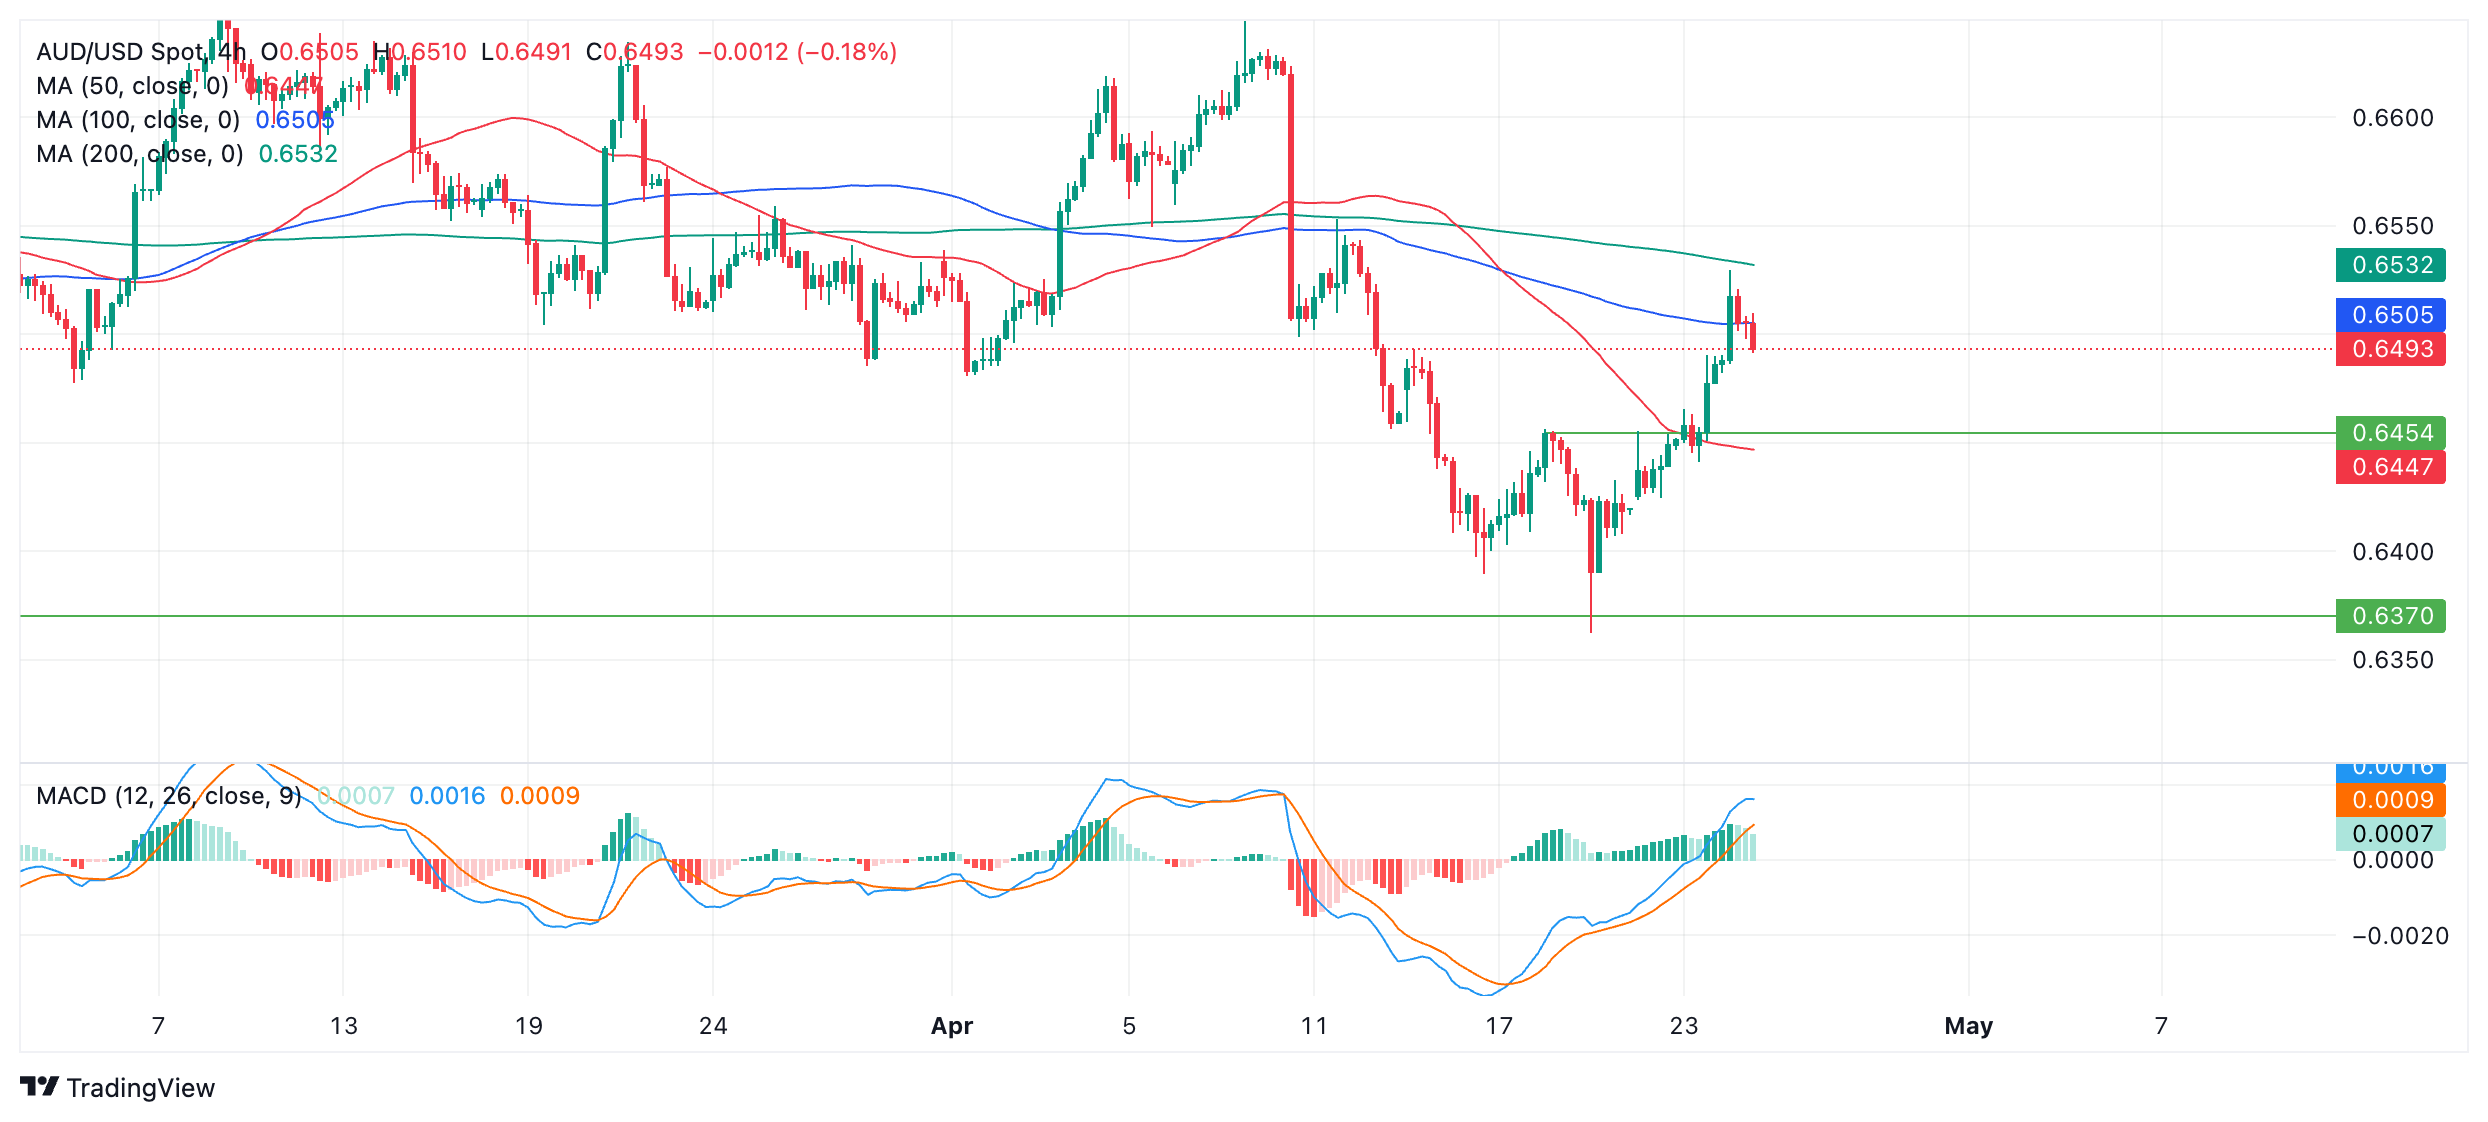
The pair has risen above the last lower high of the downtrend at 0.6452 and has broken above the 50-4hr SMA. These are both quite bullish signs.
In addition, the accompanying MACD, during the recovery from the April 19 lows, has been strongly bullish, rising more quickly than it fell over a similar timespan. This shows bullish enthusiasm and potentially institutional buyers could be participating.
The MACD has also now risen above the zero line adding more bullish evidence to the argument.
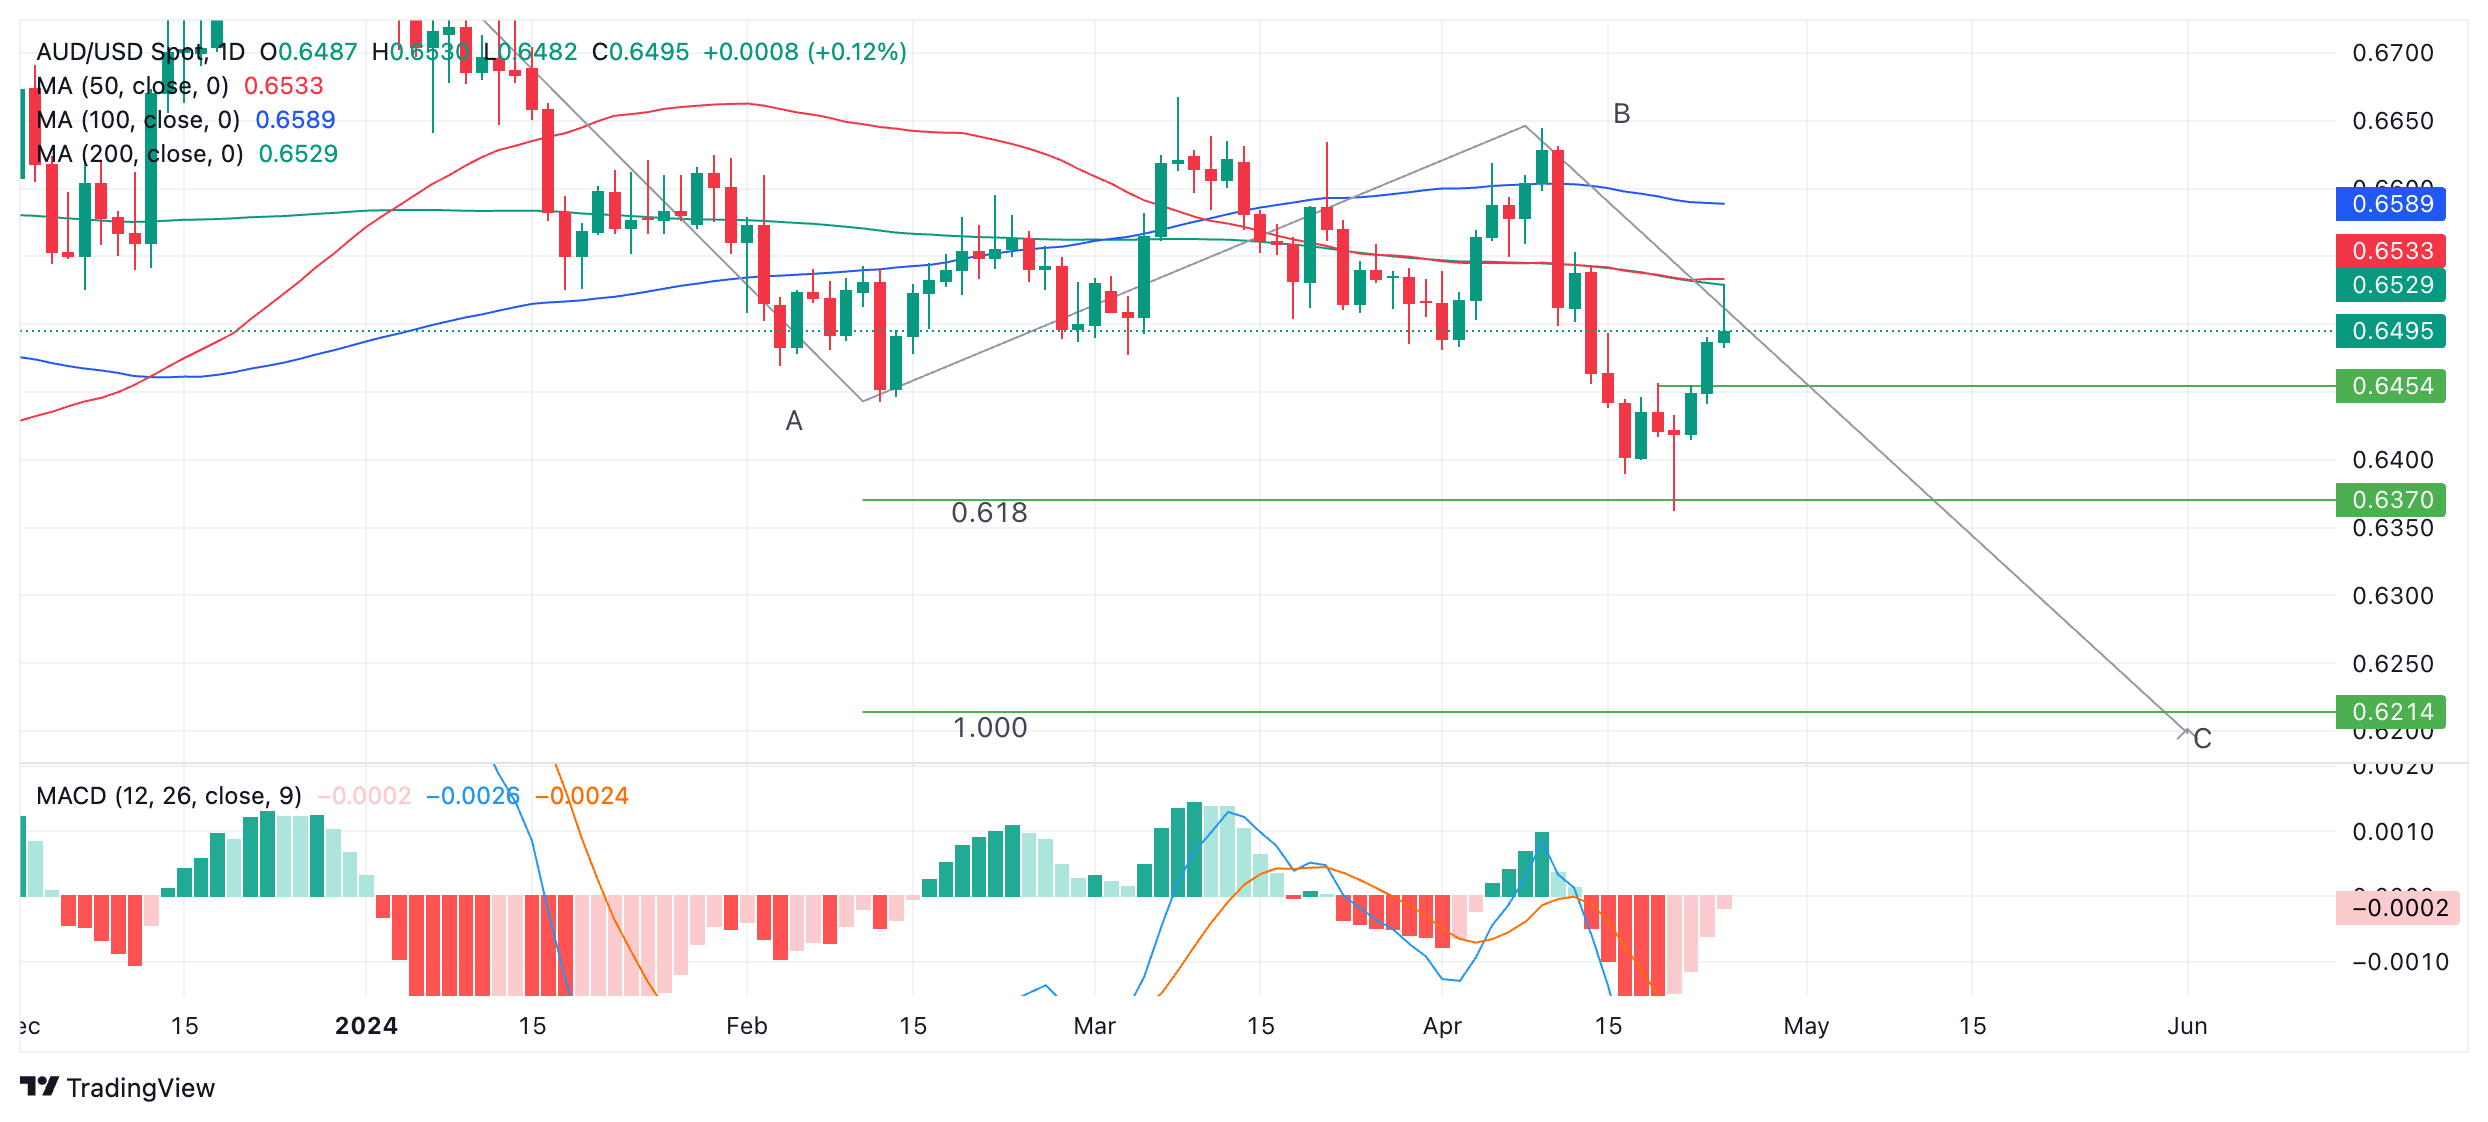
AUD/USD Weekly Chart
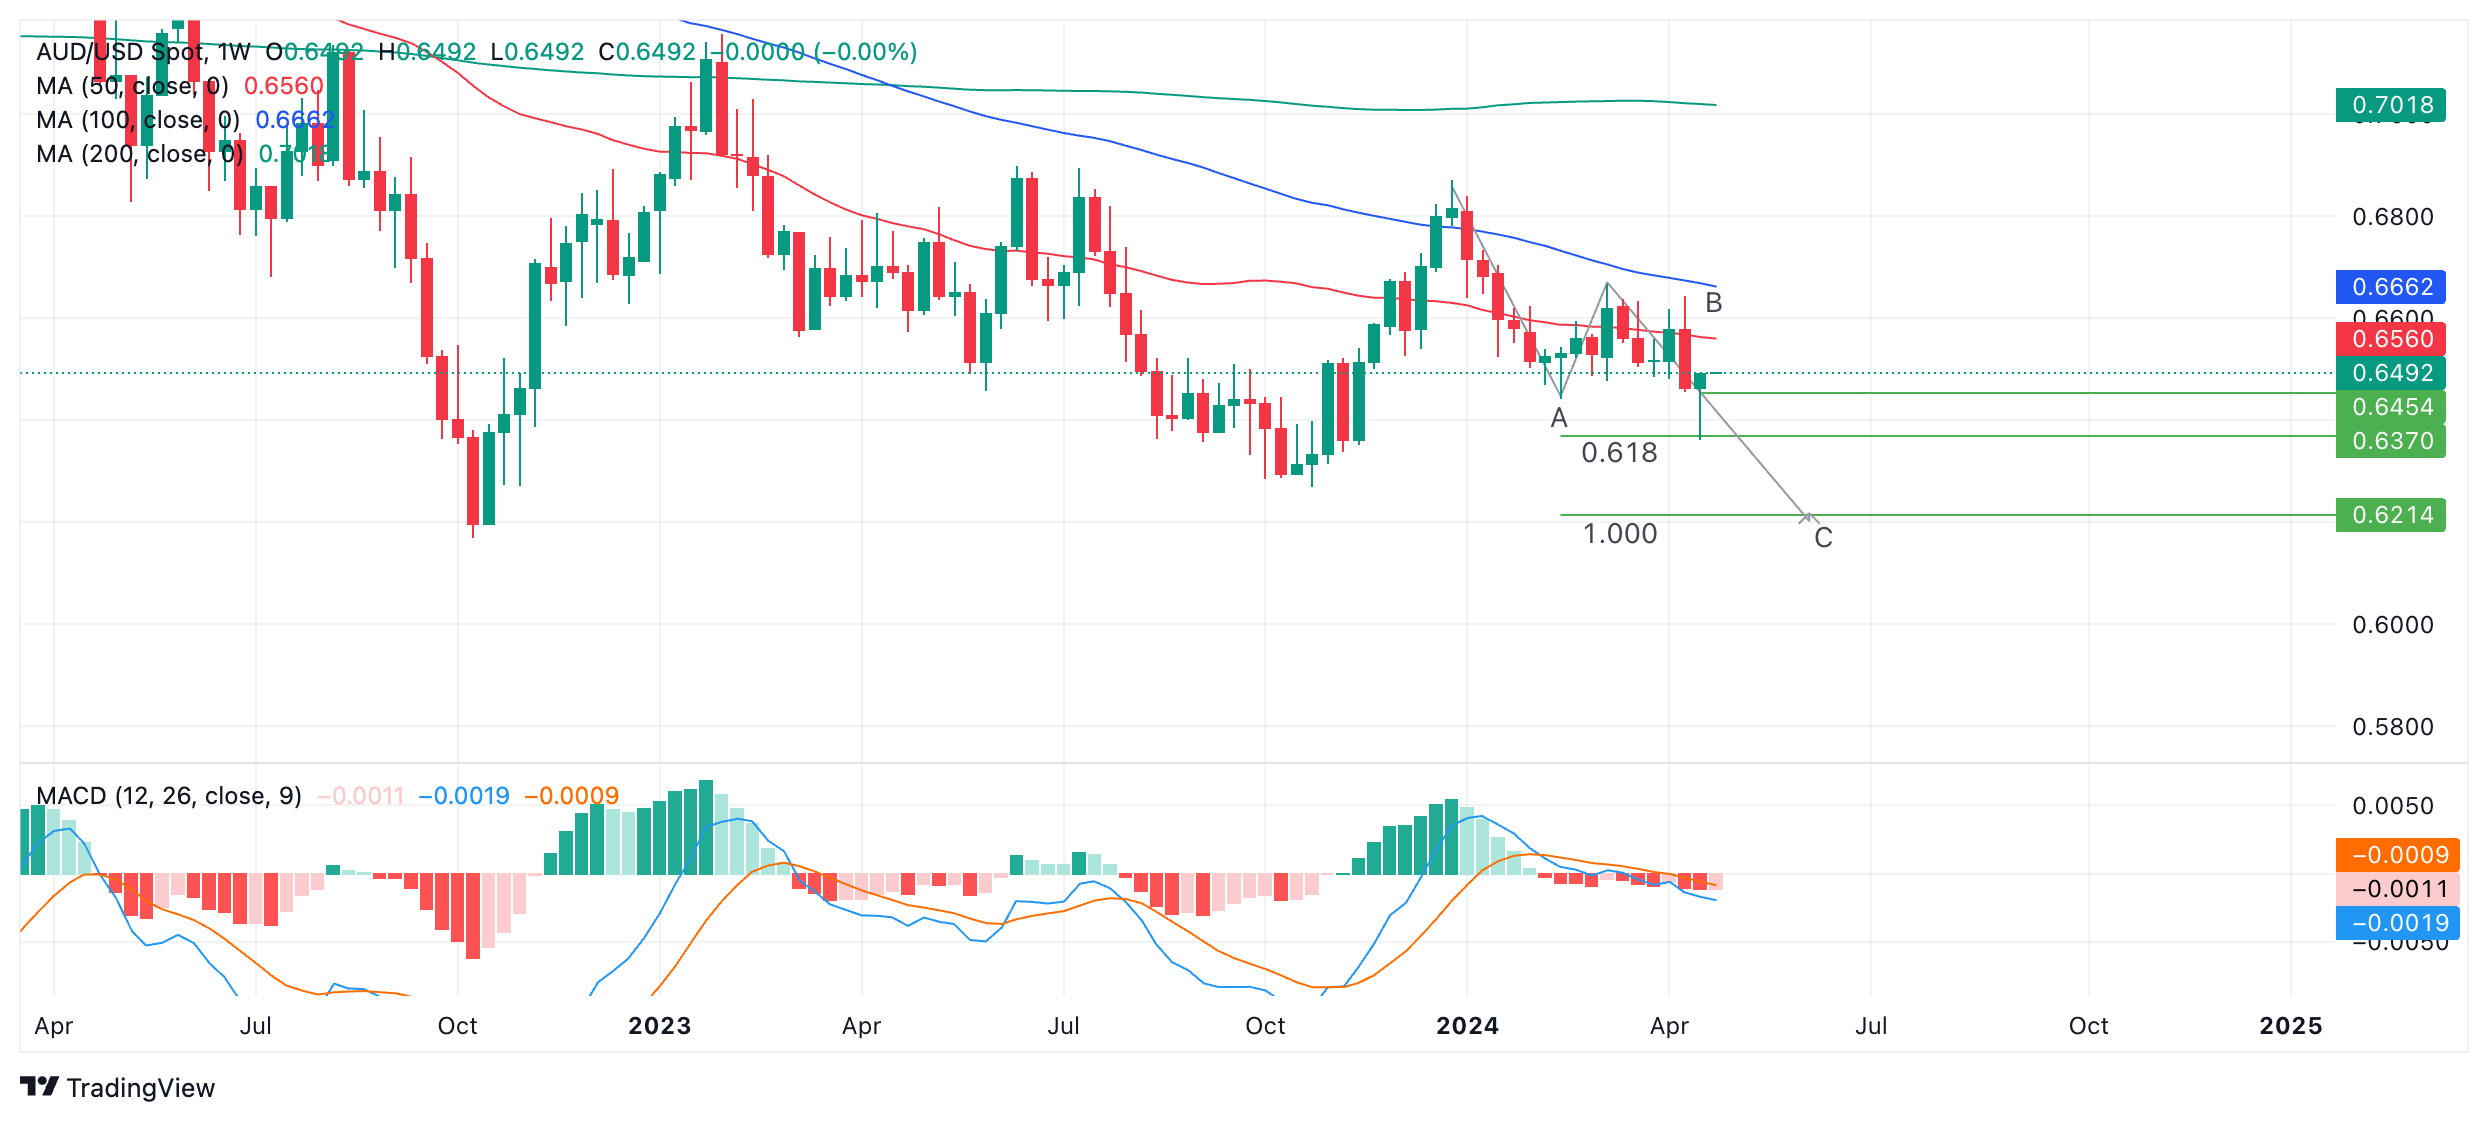
The weekly chart is the least-bullish looking chart of the three.
AUD/USD looks like it has probably formed a bearish three-wave Measured Move pattern, with waves labeled A, B and C.
If this is the case, the pair looks to be in the middle of unfolding its C-wave. Once C is complete, price is likely to undergo a reversal or, at least, a correction.
Wave C is normally equal to the length of wave A or more conservatively a Fibonacci 0.618 ratio of A. If the latter is the case, wave C may have already completed. This would add weight to the bullish reversal thesis.
If not, wave C probably has further to fall. Whilst finding out whether the current week ends on a bearish or bullish note will be crucial to interpreting the chart, simply going by the patterning, it seems risk of more downside is still very much alive.
- GBP/USD dips slightly as higher US Treasury yields bolster the US Dollar, following upbeat US data.
- Technical analysis shows GBP/USD at a pivotal point, with the potential to rise toward 1.2500 if it breaks past the April 23 high of 1.2458.
- Key downside risks include a retreat to 1.2400 and possibly further to the April 22 low of 1.2299 if current resistance holds firm.
The Pound Sterling is experiencing slight losses against the US Dollar, largely due to the influence of high US Treasury yields that are bolstering the Greenback. This trend was fueled by the release of economic data, which showed that Durable Goods exceeded expectations, leading to a surge in US yields and a favorable environment for the USD. The GBP/USD is currently trading at 1.2444, reflecting a 0.04% decrease.
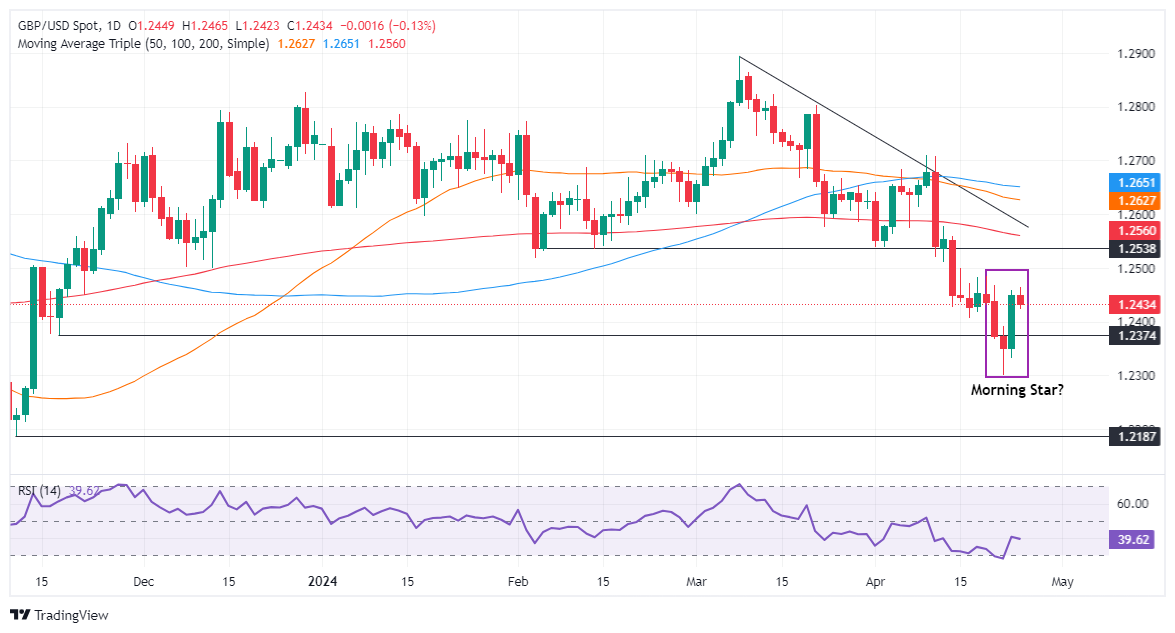
GBP/USD Price Analysis: Technical outlook
After forming a ‘morning star,’ the GBP/USD is set to continue to print gains, but traders must decisively clear the April 23 high at 1.2458, which would pave the way toward 1.2500. Up next, the first crucial resistance level would be the 200-day moving average (DMA) at 1.2561, followed by 1.2600.
On the other hand, if GBP/USD remains constrained by the April 23 high, that could pave the way for a retracement to 1.2400. A decisive break would expose April 22 low at 1.2299, which, once surpassed, could open the door to test an upslope support trendline drawn from March 2023 lows that pass at around 1.2250/60.
GBP/USD Price Action – Daily Chart
- USD/CAD recovers to near 1.3700 as the Canadian Retail Sales surprisingly contracted by 0.1% in March.
- Weak Retail Sales data would prompt expectations of early rate cuts by the BoC.
- The US Dollar struggles for a strong recovers due to weak S&P Global PMI report for April.
The USD/CAD pair witnesses strong buying interest and rises to 1.3700 as the Statistics Canada has posted weaker-than-expected Retail Sales data for March. Sales at retail stores contracted at a slower pace of 0.1% against 0.3% in February. However, investors forecasted that Retail Sales will rose by 0.1%.
The Retail Sales is a leading indicator of consumer spending that signifies households’ demand. Lower Retail Sales suggest weak demand by households, which force factory owners to reduce prices of goods and services at their factory gates. This leads to a decline in the consumer price inflation, which would allow the Bank of Canada (BoC) to start reducing interest rates earlier. Currently, financial markets anticipate that the BoC will start reducing interest rates from the June meeting.
Meanwhile, the US Dollar struggles to recover above the immediate resistance of 105.80. It seems that investors have not shrugged off the impact of weak S&P Global preliminary PMI report for April, released on Tuesday.
The S&P PMI report showed that the Manufacturing PMI drops below the 50.0 threshold and the Services PMI falls sharply to 50.9.
Going forward, the US Dollar will dance to the tunes of the Q1 Gross Domestic Product (GDP) and the core Personal Consumption Expenditure Price Index (PCE) data for March, which will be published on Thursday and Friday. The economic data will impact speculation for timing of rate cuts by the Federal Reserve (Fed), which are currently expected from the September meeting.
Analysts at Rabobank share their short-term outlook for AUD/USD.
Fed is likely to start cutting rates in September
"Measured on a 5-day view, the AUD is the best performing G10 currency. Not only has firmer AUD price data created some unease about the RBA’s potential to cut rates, but softer US PMI data this week has provided some reassurance about the ability of the Fed to ease in the coming months. The USD has consequently fallen back against the majority of G10 currencies."
"In Rabo’s view, the Fed is likely to start cutting rates in September. This suggests the prospect of a softer USD from the summer. This week’s US and Australia data releases have reinforced our view that AUD/USD is likely to trend higher later in the year and into 2025. However, near-term the AUD/USD may find it difficult to extent this week gains. This is likely to depend on the releases of US GDP and PCE inflation later this week. The 200 days Simple Moving Average (SMA) is likely to offer resistance at AUD/USD 0.6529."
- USD/CHF oscillates near a six-month high around 0.9150, exhibiting strength ahead of crucial US data.
- The SNB is expected to extend the rate-cut cycle in June.
- The Fed sees the current interest rate policy framework as appropriate.
The USD/CHF pair hovers around the six-month high of 0.9150 in Wednesday’s early American session. The near-term outlook of the Swiss Franc asset remains bullish, with expectations of further escalation in policy divergence between the Federal Reserve (Fed) and the Swiss National Bank (SNB).
The Fed is expected to keep interest rates at their current levels for a longer period, given the strength in the United States labor market and stubbornly higher inflation due to strong consumer spending.
The SNB will reduce interest rates again in the June policy meeting. The SNB kicked off the global rate-cut cycle after lowering borrowing rates by 25 basis points (bps) to 1.5% in the March meeting. The inflation in the Swiss economy has softened below the 2% target from a longer period, allowing the SNB to slice key interest rates further.
Meanwhile, investors await the crucial US Q1 Gross Domestic Product (GDP) and the core Personal Consumption Expenditure Price Index (PCE) data for March, which will be published on Thursday and Friday. The economic data will impact market expectations for Fed rate cuts, which are currently expected in the September meeting.
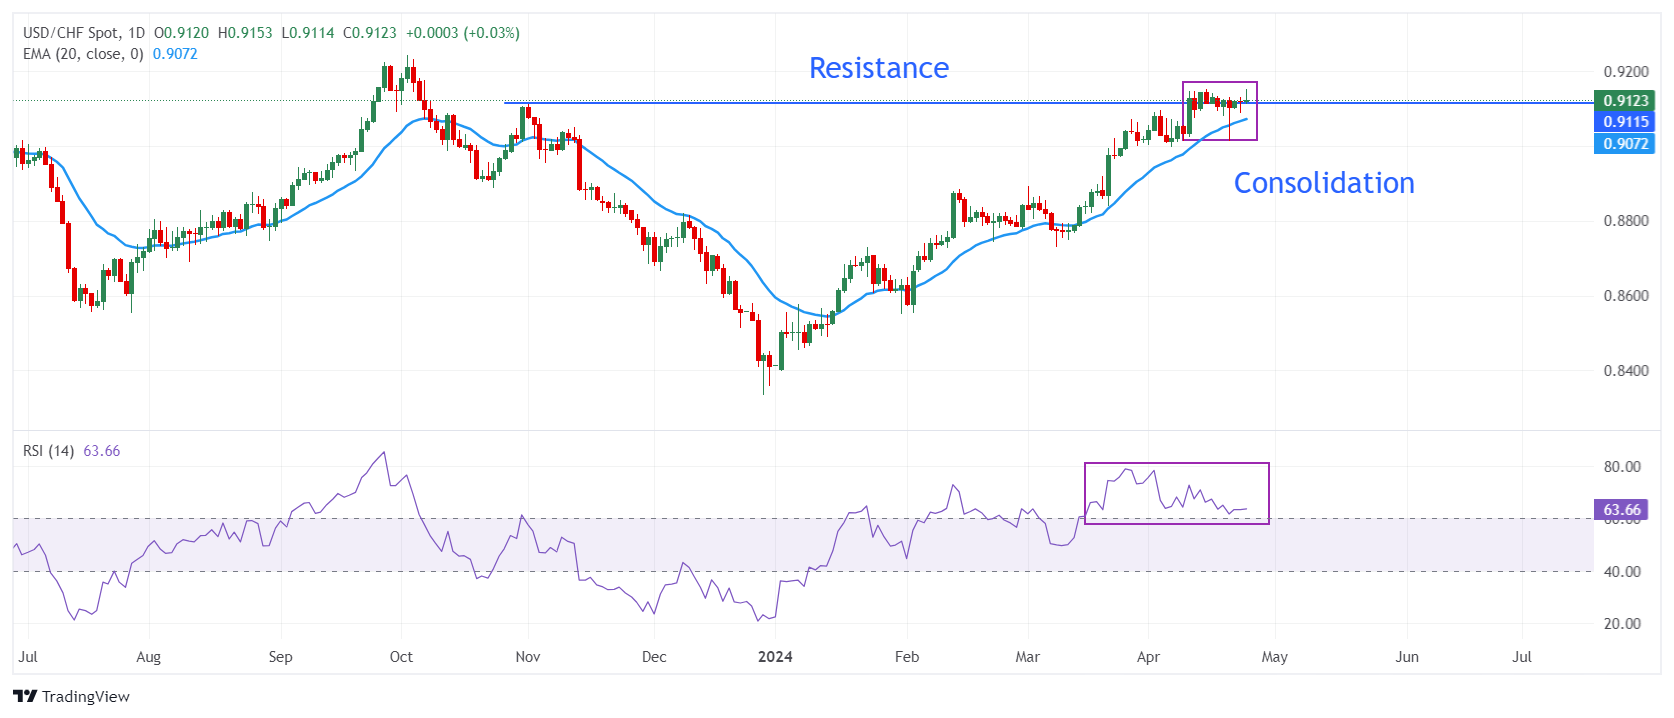
USD/CHF trades back-and-forth in a tight range near the crucial resistance of 0.9110, which is plotted from 1 November 2023 high plotted on a daily timeframe. The asset is expected to extend its upside as the upward-sloping 20-day Exponential Moving Average (EMA) near 0.9075 suggests an upbeat near-term outlook.
The 14-period Relative Strength Index (RSI) oscillates in the bullish range of 60.00-80.00, indicating that a bullish momentum is still active.
Going forward, an upside move above intraday high of 0.9153 will drive the asset towards the round-level support of 0.9200. A breach of the latter will push the asset further to 4 October 2023 high at 0.9232.
In an alternate scenario, fresh downside would appear if the asset breaks below the psychological support of 0.9000, which will expose it to March 22 low at 0.8966, followed by March 1 high at 0.8893.
USD/CHF daily chart
- EUR/GBP price has fallen to support from the top of a multi-month range at 0.8590.
- Despite bearish signs the pair could yet rally as the short-term trend remains technically bullish.
- A decisive break below the support level, however, would indicate deeper decline back into the range.
EUR/GBP price has reversed and fallen to a key support level at around 0.8590, where it is currently consolidating.
During volatile trading on April 19 the pair broke out of its multi-month range and rose up to a peak of 0.8645, however, it quickly reversed and fell back down.
EUR/GBP Daily Chart
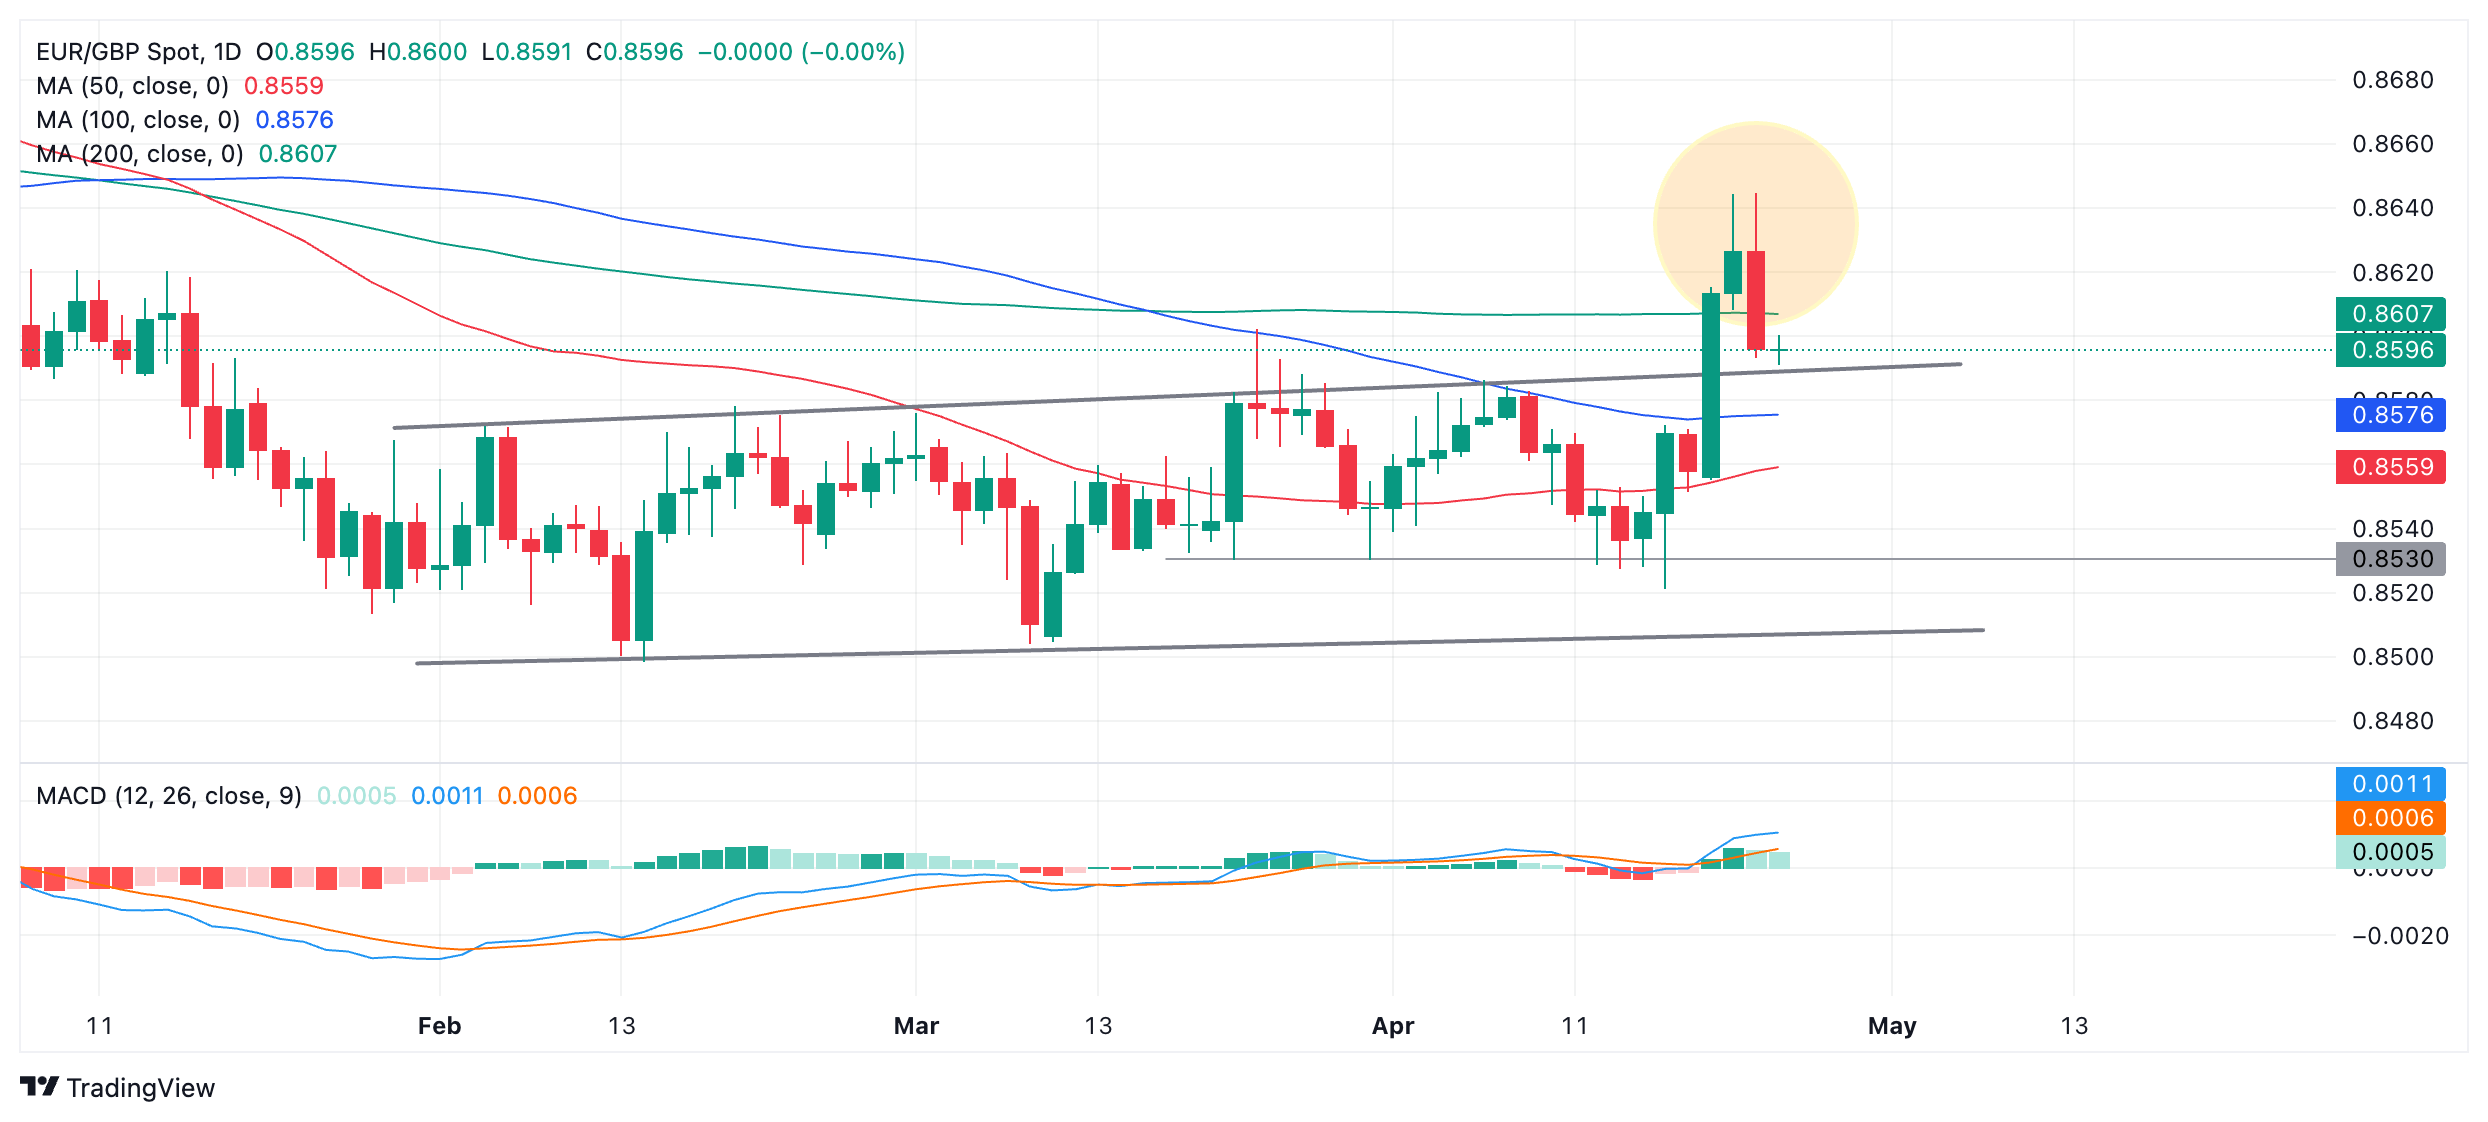
EUR/GBP hit its initial conservative target for the range breakout at the 0.618 Fibonacci extrapolation of the height of the range higher. This could mean there will be no further upside. However, if the pair reaches the optimistic target for the breakout it could still rally up to roughly 0.8660.
The pair formed a bearish Tweezer Top Japanese candlestick pattern at the highs (circled) which occurs when two consecutive days have similar candle wicks (the thin upper part of the candle) and these wicks end at similar highs. It is a fairly reliable reversal sign.
The support level currently holding up price is the top of a range that began in February. It is likely to be a tough nut for bears to crack and push price lower.
A decisive break below the top of the range would be required to confirm more weakness possible to a target at 0.8530.
“Decisive” means a break by a long red candlestick that closes near its low or a break by three consecutive red candlesticks.
4-hour Chart
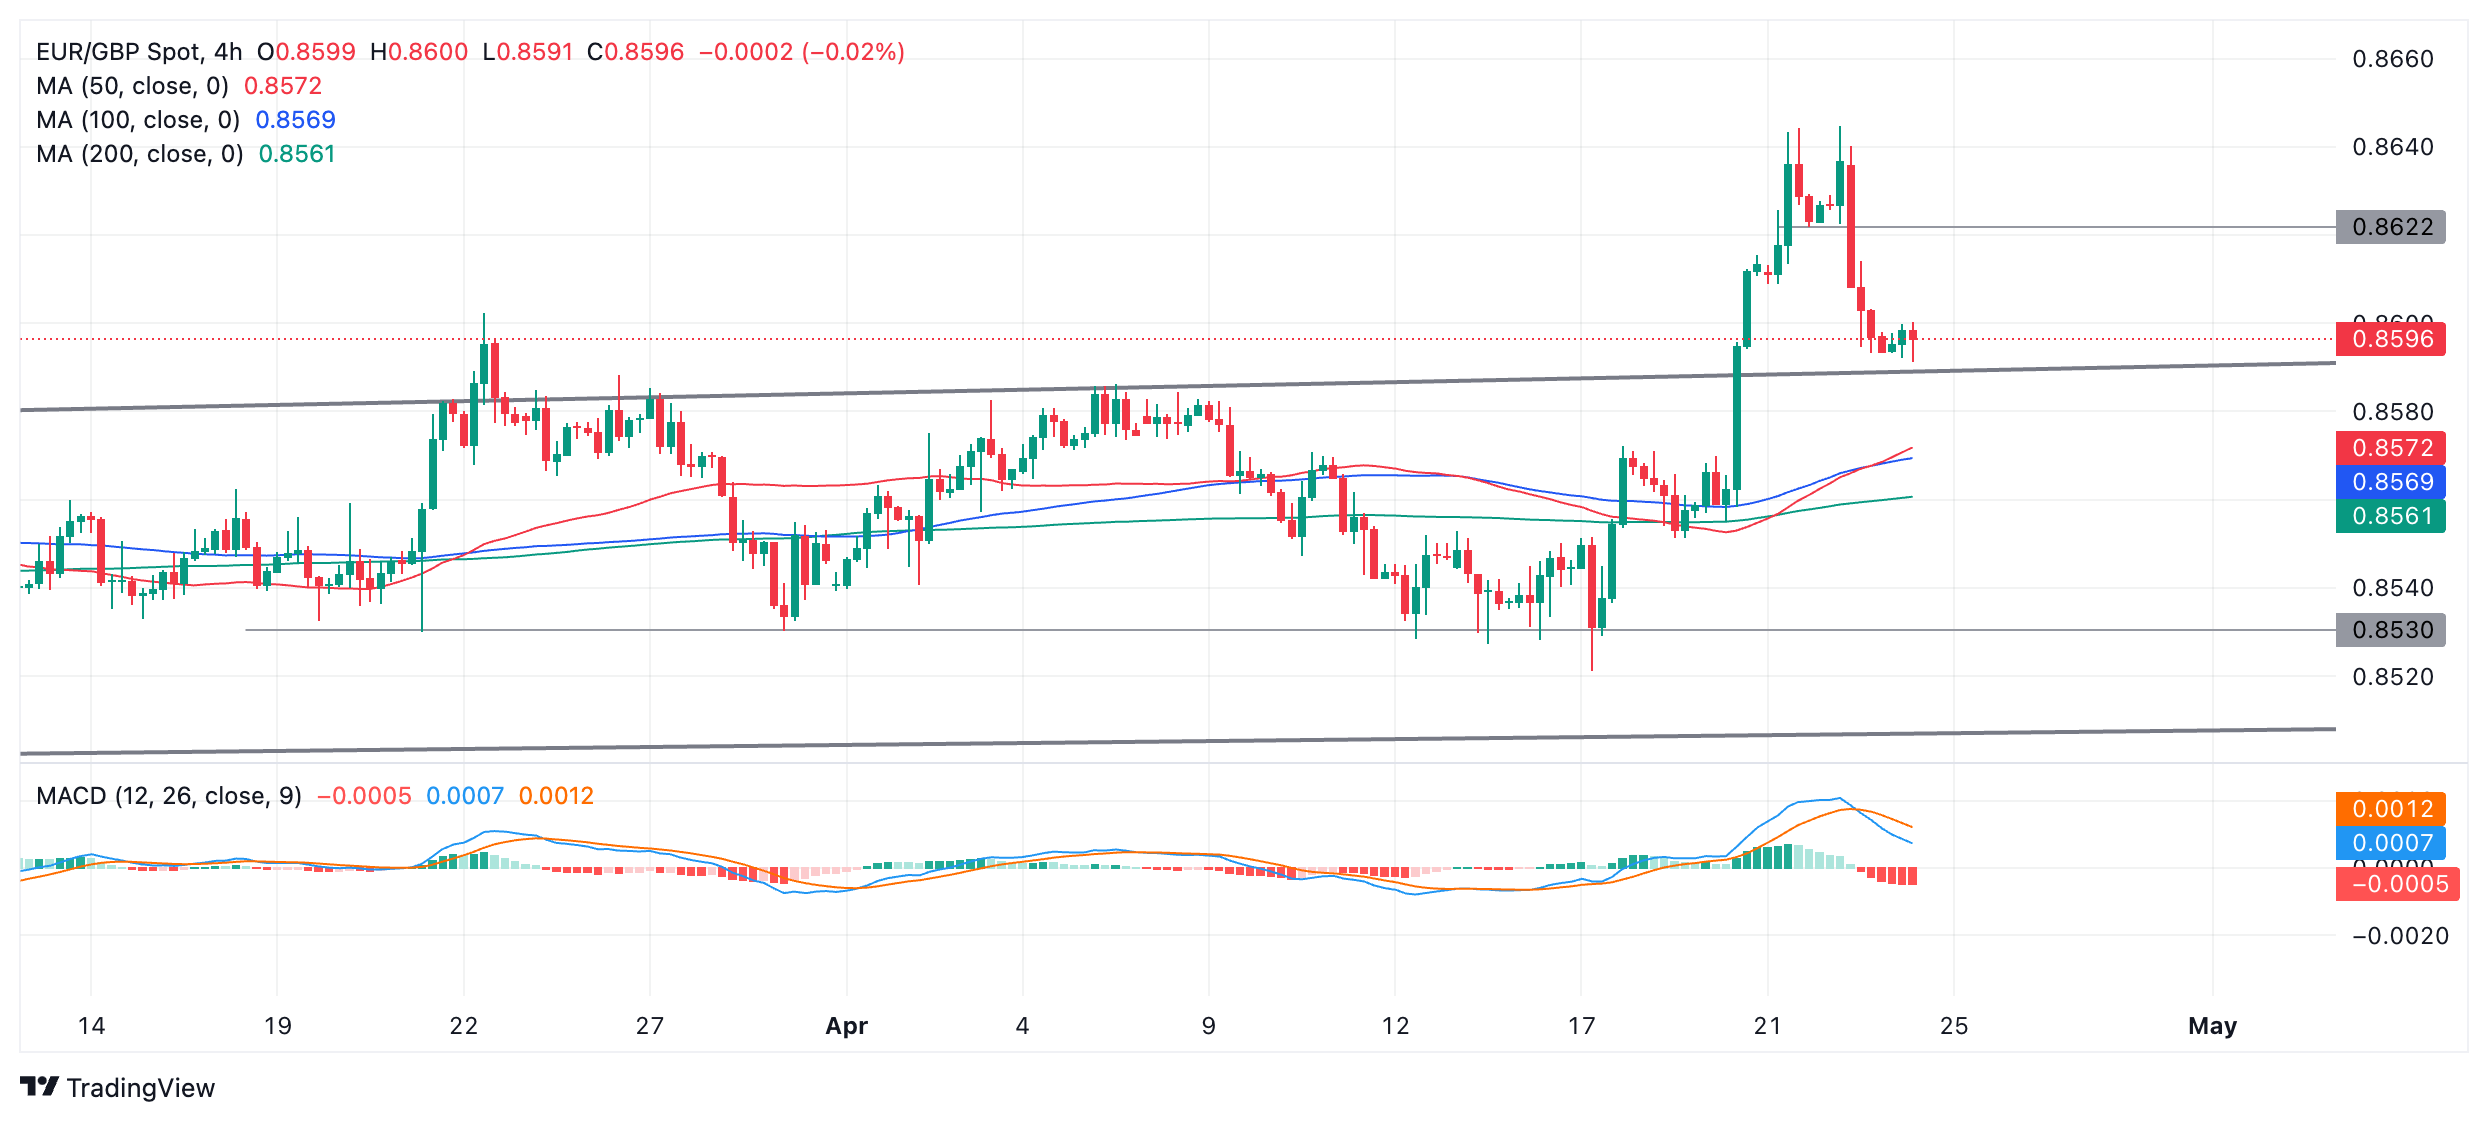
The 4-hour chart shows that a bearish M-shaped Double Top pattern formed at the highs of April 22-23. The pattern subsequently broke below its neckline (gray line at 0.8622) and plummeted. It has reached its price target which is equivalent to the height of the pattern extrapolated lower. This suggests a waning in bearish momentum.
The pair is not technically in a short-term downtrend despite recent weakness. Ideally it would need to form a more consistent trend of falling peaks and troughs before it could be said to be in a downtrend.
Since there remains a chance EUR/GBP could still be in an uptrend, and that support from the top of the range has not yet been broken, the materialization of further upside is still a very real possibility.
The level of the neckline of the Double Top at 0.8622 is likely to present resistance if an upmove evolves.
- Durable Goods Orders in the US increase $7.3 billion in March.
- US Dollar Index clings to small daily gains below 106.00.
Durable Goods Orders in the US rose 2.6%, or $7.3 billion, to $283.4 billion in March, the US Census Bureau reported on Wednesday. This reading followed the 0.7% increase (revised from 1.4%) recorded in February.
"Excluding transportation, new orders increased 0.2%," the US Census Bureau said in the press release. "Excluding defense, new orders increased 2.3%. Transportation equipment, also up two consecutive months, led the increase, $6.8 billion or 7.7%, to $95.9 billion."
Market reaction
These figures don't seem to be having a significant impact on the US Dollar Index, which was last seen rising 0.15% on the day at 105.85.
- Silver price finds support at $26.70 but remains at risk of further weakness.
- It formed a pattern on the 4-hour chart after touching the top of a four-year consolidation at $30.00.
- XAG/USD has fallen to an initial target but is vulnerable to further declines – support is at $25.80.
Silver (XAG/USD) price has found a floor at $26.70 and is consolidating. This follows a sell off that reversed the short-term uptrend after Silver was rejected by the top of a long-term range at just below $30.00 (green line).
The precious metal formed a bullish Hammer candlestick pattern on the daily chart, on Tuesday (circled below).
Silver Daily Chart
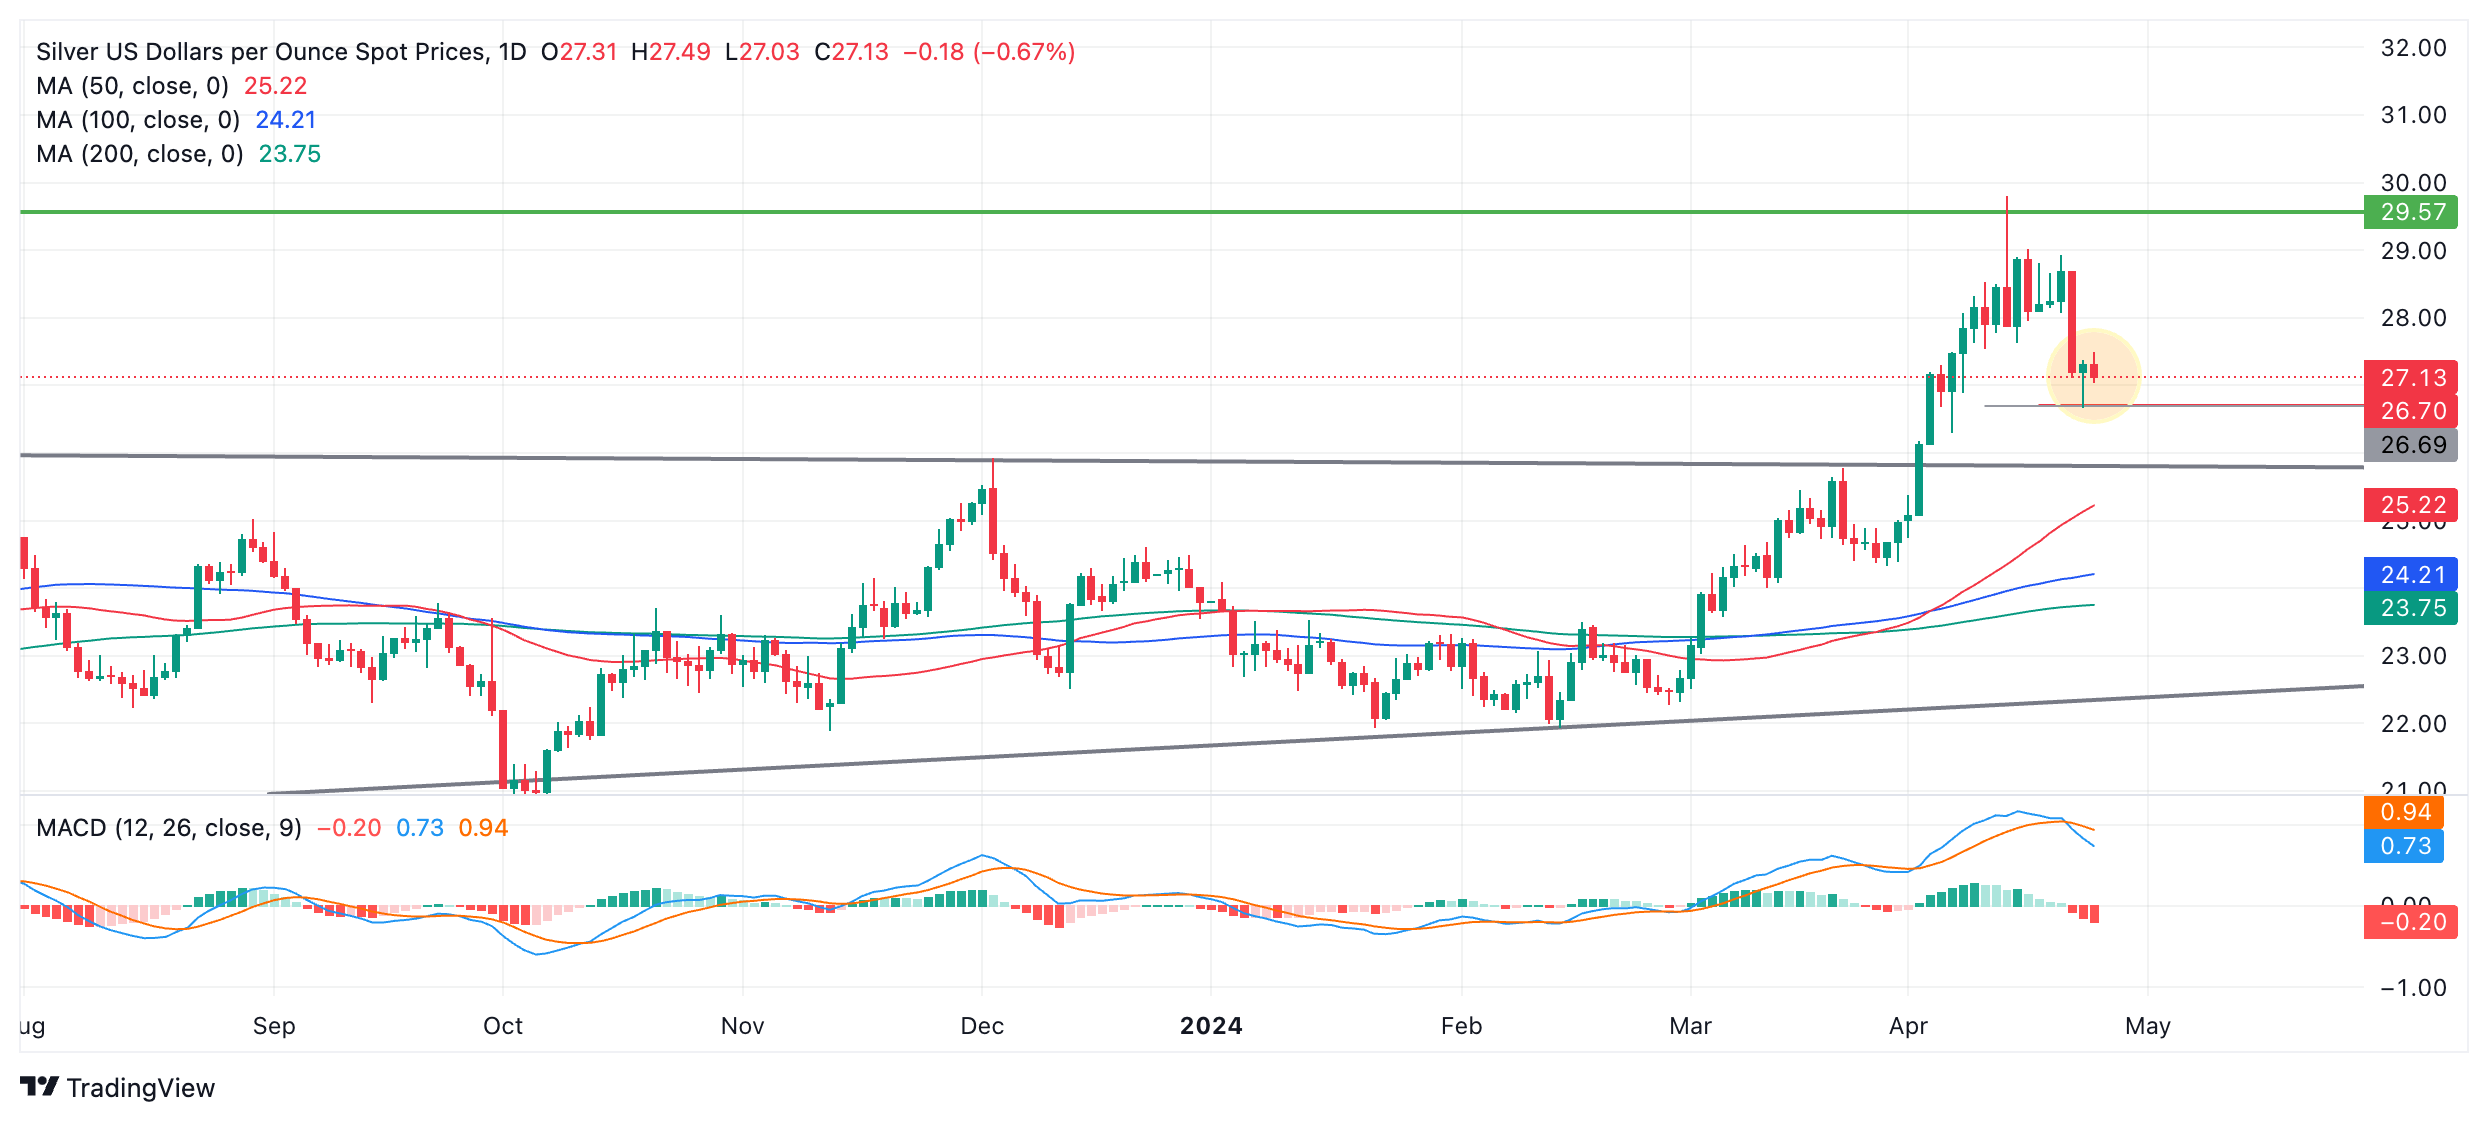
If the Hammer is followed by a green up candle on Wednesday confirming the bullish change in sentiment, it could signal a possible short-term correction higher. If not Silver price is at risk of more downside. A break below the low of the hammer would provide confirmation of more weakness. The next downside target would probably be at support from the top of the year-long range at around $25.80.
The Moving Average Convergence/Divergence (MACD) momentum indicator has crossed below its signal line, indicating more weakness is likely. The signal is reinforced by the fact that MACD has been proven to be a more reliable indicator in markets that are not strongly trending, such as is the case with Silver.
A decisive break below $25.80 would return Silver to inside its year-long range and possibly the lower trendline at roughly $23.00.
From a bullish perspective, a decisive break above the 2021 high of $30.07 would suggest Silver was going higher, with an initial target at $32.40 where former resistance lies.
4-hour Chart
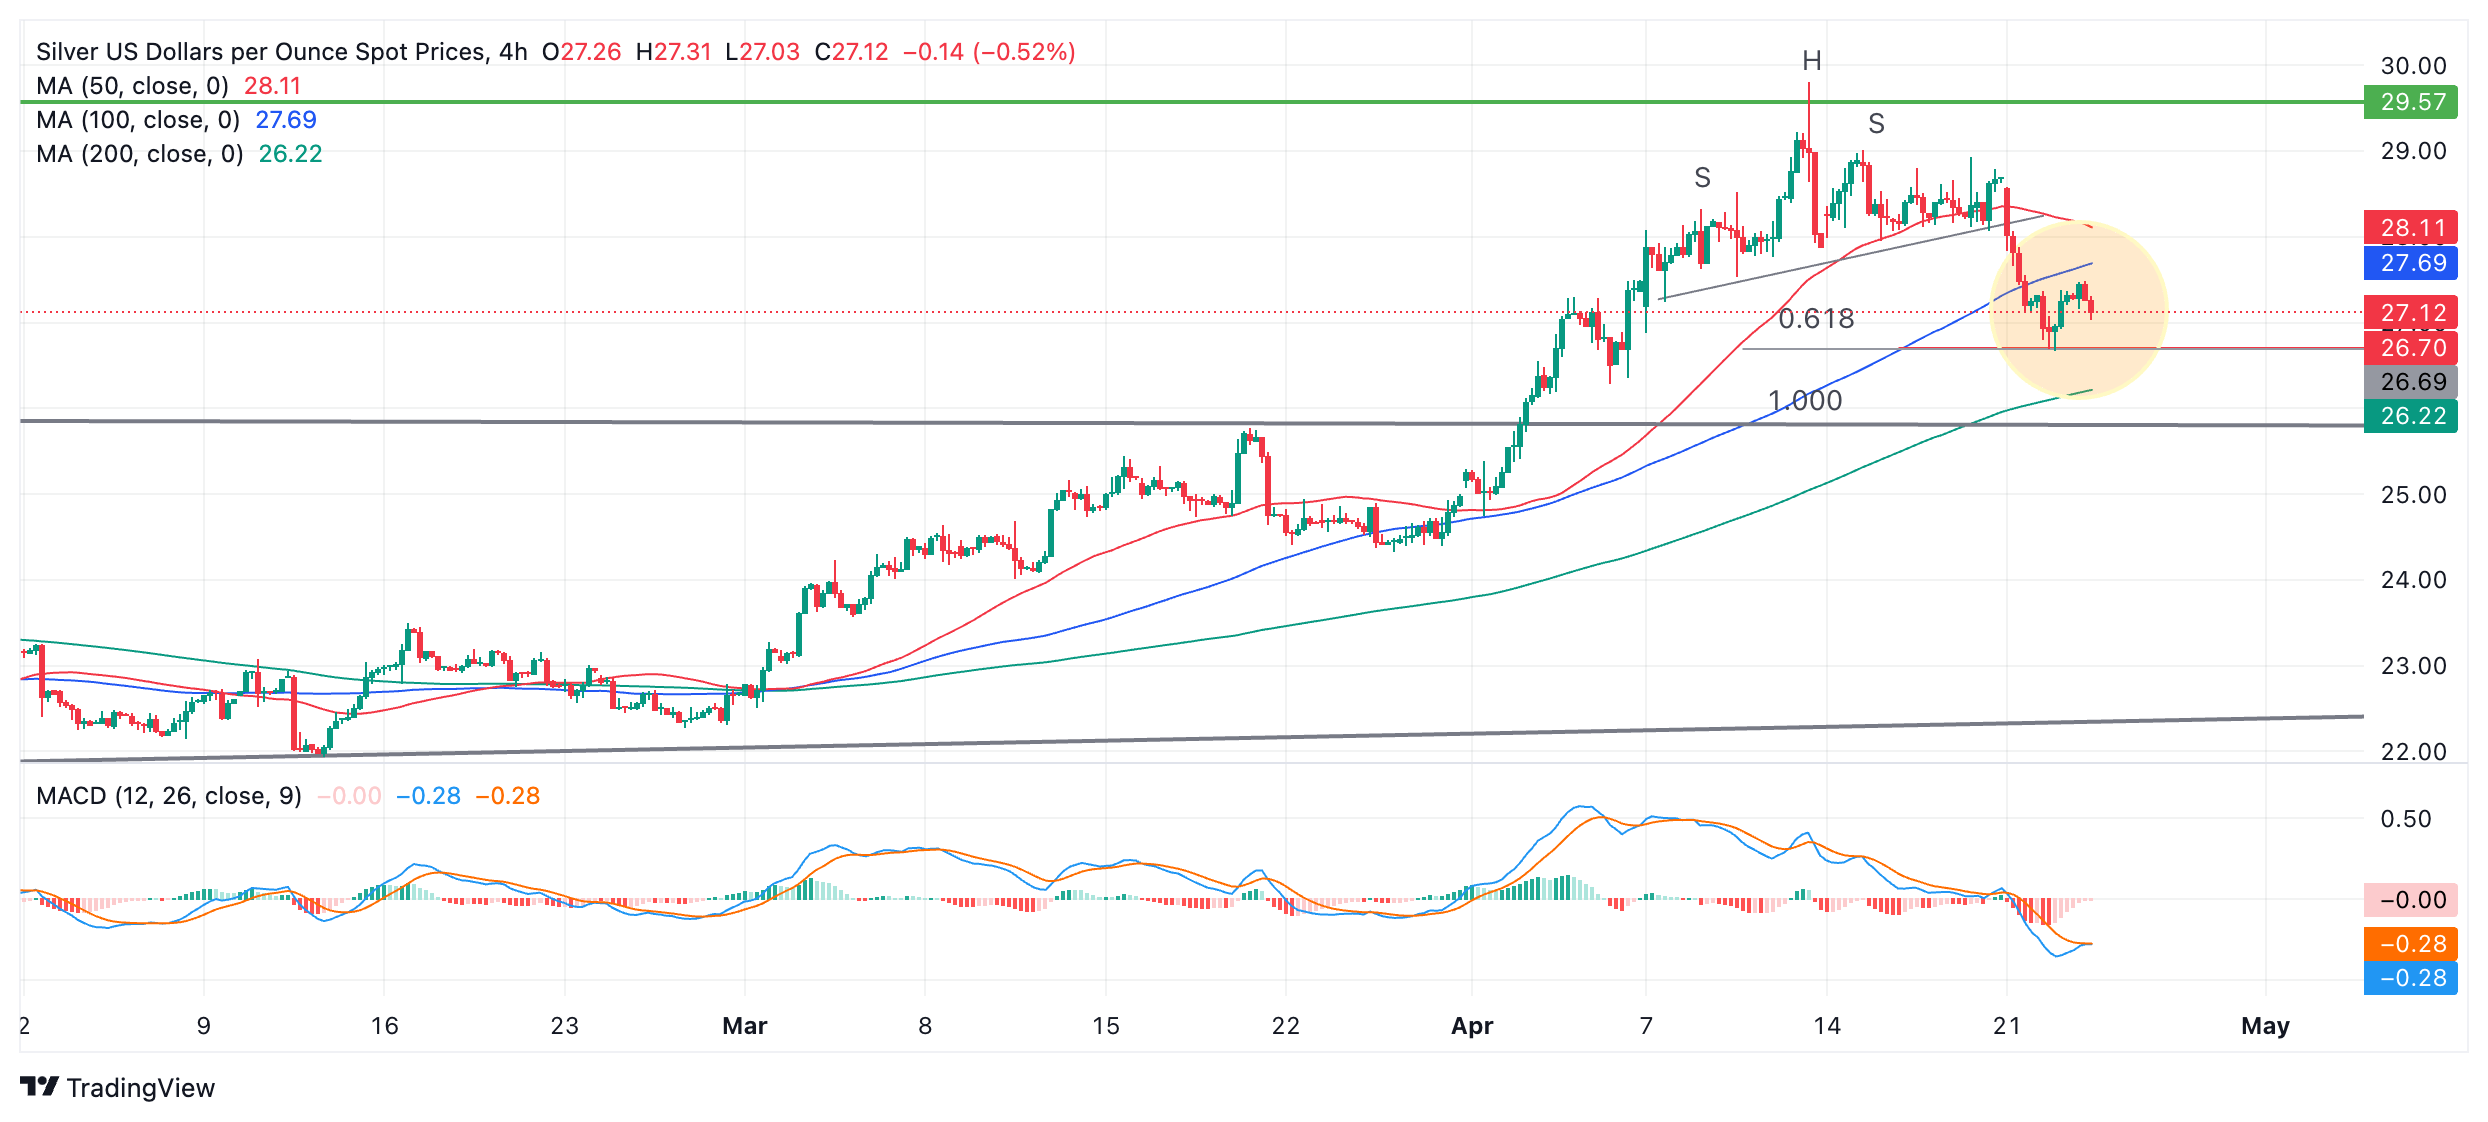
The 4-hour chart which analysts often use to determine the short-term trend, shows in more detail the price dynamics that preceded the fall from the top of the four-year consolidation zone (green line).
Silver price formed a multi-shouldered Head and Shoulders (H&S) topping pattern at the $30.00 highs of mid-April.
When the pattern broke below its “neckline” at the base, at roughly $28.00, it fell sharply to an initial target at $26.70. This target is the conservative estimate for the pattern, calculated by taking the height of the H&S and extrapolating the distance by a 0.618 Fibonacci ratio from the neckline lower.
If the pattern falls further to its optimistic target, which lies at the full distance of the height of the pattern extrapolated lower (Fib.1.000), it will reach a target at roughly the same level as the top of the year-long range at around $25.80.
- Natural Gas price hits a fresh two-month high.
- Gas prices soar as the US is set to broaden sanctions against Iran’s Oil sector.
- The US Dollar Index partially recovers from Tuesday’s decline, driven by a big miss on PMI numbers.
Natural Gas (XNG/USD) holds onto recent gains on Wednesday after a two-day rally sparked by a possible escalation of tensions in the Middle East as the US is set to extend sanctions on Iran’s Oil sector. Earlier last week, the Biden administration said it was readying a sanction package that would not disrupt Oil exports to avoid ramping up prices. However, by backtracking and now issuing sanctions on the Iranian oil sector, tensions could flare up again in the coming days, fuelling prices in the overall energy space.
Meanwhile, the US Dollar Index (DXY), which tracks the US Dollar’s value against six major currencies, fell sharply on Tuesday after a big miss on the preliminary US Purchasing Managers Index (PMI) numbers for April. Apart from the softer-than-expected data, the Manufacturing component fell below the 50 level, showing a contraction in the sector. The US Dollar is recovering though on Wednesday, with traders assessing expectations about the time of the initial interest rate cut from the US Federal Reserve (Fed)..
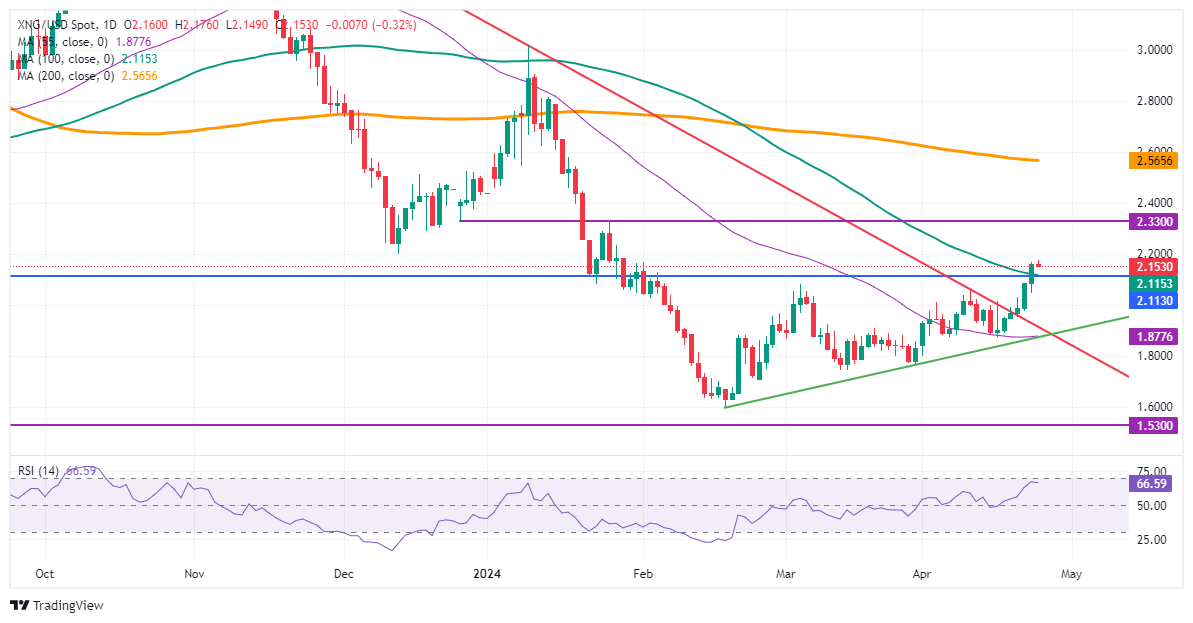
Natural Gas is trading at $2.15 per MMBtu at the time of writing.
Natural Gas news and market movers: Tensions and supply issues
- Supply issues towards Europe as the Hammerfest Liquefied Natural Gas (LNG) plant in Norway is completely shut down due to a leak, Bloomberg reports. Expectations are for it to remain closed until at least Friday.
- Marco Saalfrank, Head of Continental Europe Merchant Trading and Member of the Management Board of Axpo Solutions AG, said in an interview with Bloomberg that the Gas market is currently sentiment-driven as well, which is increasing volatility as Europe still lacks structural changes to replace the Gas supply from Russia.
- The UK is also facing some issues, with the unforeseen outage of the Elgin Franklin field in the UK North Sea by at least another day.
- US sanctions on Iran’s OIl sector are set to be signed by US President Joe Biden next week after the US Senate passed tougher measures.
Natural Gas Technical Analysis: Markets surprised by tougher sanctions
Natural Gas finally broke out of the range in which had been stuck since the end of January, between $1.60 and $2.11. A near $0.50 range that is now broken after the US is set to extend sanctions on Iran’s Oil sector. In the ripple effect of higher oil prices and elevated tensions in the Middle East, a stronger US Dollar could become a side effect of this bill being signed by US President Joe Biden next week.
On the upside, the blue line at $2.11, the 2023 low, and the 100-day Simple Moving Average (SMA) at $2.12 have been broken, resulting in a fresh two-month high. Further up, the next resistance level is the January 25 high at near $2.33.
With the firm break of the $2.11 area, the above mentioned elements (the 100-day SMA and the pivotal blue line) should now be acting as support. Traders could expect a retrace under some profit-taking, which this level should be able to withstand. Should it still break below, XNG/USD could experience a movement towards $1.92, testing a bounce off the red descending trend line.
Natural Gas: Daily Chart
Natural Gas FAQs
Supply and demand dynamics are a key factor influencing Natural Gas prices, and are themselves influenced by global economic growth, industrial activity, population growth, production levels, and inventories. The weather impacts Natural Gas prices because more Gas is used during cold winters and hot summers for heating and cooling. Competition from other energy sources impacts prices as consumers may switch to cheaper sources. Geopolitical events are factors as exemplified by the war in Ukraine. Government policies relating to extraction, transportation, and environmental issues also impact prices.
The main economic release influencing Natural Gas prices is the weekly inventory bulletin from the Energy Information Administration (EIA), a US government agency that produces US gas market data. The EIA Gas bulletin usually comes out on Thursday at 14:30 GMT, a day after the EIA publishes its weekly Oil bulletin. Economic data from large consumers of Natural Gas can impact supply and demand, the largest of which include China, Germany and Japan. Natural Gas is primarily priced and traded in US Dollars, thus economic releases impacting the US Dollar are also factors.
The US Dollar is the world’s reserve currency and most commodities, including Natural Gas are priced and traded on international markets in US Dollars. As such, the value of the US Dollar is a factor in the price of Natural Gas, because if the Dollar strengthens it means less Dollars are required to buy the same volume of Gas (the price falls), and vice versa if USD strengthens.
- USD/JPY moves higher to 155.00 as US Dollar bounces back.
- Investors await the US Data to get cues about when the Fed will pivot to interest rate cuts.
- The BoJ is projected to raise interest rates only one more time by year-end.
The USD/JPY pair advances to historic highs of 155.00 in Wednesday’s London session. The asset strengthens as the US Dollar finds support amid uncertainty ahead of the United States Q1 Gross Domestic Product (GDP) and the core Personal Consumption Expenditure Price Index (PCE) data for March, which will be published on Thursday and Friday.
The economic data will significantly influence market expectations about when the Fed will start reducing interest rates.
The market sentiment is asset-specific as S&P 500 futures have added some gains in the European session, while risk-perceived currencies drop against the US Dollar. The US Dollar Index (DXY) adds some gains after discovering buying interest near 105.70.
On Tuesday, the US Dollar corrected sharply after the S&P Global reported a weak US preliminary PMI report for April. The agency reported that the Manufacturing PMI remains below the 50.0 threshold that indicates a contraction and the Services PMI falls sharply. This has suggested that strong US economic outlook is losing some heat.
In today’s session, investors will keenly watch the Durable Goods Orders for March. Orders for Durable Goods rose by 1.4% in February. Durable Goods Orders include those products that have life span of three years or more. Strong Durable Goods Orders indicate a stubborn inflation outlook.
Meanwhile, the Japanese Yen weakens as investors expect that the Bank of Japan (BoJ) will not continue raising interest rates this week. Last time, the BoJ pushed interest rates to 0%-0.1% after maintaining a super easy monetary policy for 17 years. A Reuters poll showed that the BoJ will tighten policy further once this year and is expected to keep it stable till the June meeting.
Fears of Japan’s intervention in the FX domain to support the sliding Japanese Yen deepen. In the early European session Senior Japan Ruling Party Executive Ochi said, "There is no broad consensus right now, but if the yen slides further toward 160 or 170 to the dollar, that may be deemed excessive and could prompt policymakers to consider some action" Reuters reported.
- Gold price eyes more downside amid caution ahead of US core PCE Price Index data.
- Apart from the US underlying inflation data, investors will focus on Durable Goods Orders and Q1 GDP.
- The US Dollar corrects as a weak PMI report for April dampens investors’ confidence in the strong US economic outlook.
Gold price (XAU/USD) retreats to $2,315 in Wednesday’s European session while attempting to extend recovery above $2,320. The near-term appeal of the precious metal remains weak as safe-haven demand wanes amid easing Middle East tensions. Also, investors turn cautious for bullions ahead of the United States Q1 Gross Domestic Product (GDP) release and the core Personal Consumption Expenditure Price Index (PCE) data for March, which will be published on Thursday and Friday, respectively.
The Q1 GDP and the underlying inflation will provide further cues about when the Federal Reserve (Fed) will begin reducing interest rates. The US core PCE Inflation, the Fed’s preferred inflation gauge, is estimated to have grown steadily by 0.3%, with annual figures softening to 2.6% from 2.8% recorded for February. The Gold price could face a sharp sell-off if the underlying inflation data comes in hotter than expected.
US inflation indicators such as Consumer Price Index (CPI) and wage growth have remained high in the first quarter. Further signs of persisting price pressures would allow the Fed to continue with their argument of keeping interest rates at the current levels for a longer period. Historically, this scenario bodes well for the US Dollar and bond yields, and makes Gold less attractive.
Daily digest market movers: Gold price remains feeble amid multiple headwinds
- Gold price remains on the back foot as safe-haven demand has diminished after investors shrug off Middle East fears amid no further escalation in tensions between Iran and Israel.
- The precious metal got some relief after plunging to $2,300 as the US Dollar weakened after the release of the weak S&P Global preliminary PMI data for April. The report showed that surprisingly both Manufacturing and Services PMI were down from the prior readings. The Manufacturing PMI even fell below the 50.0 threshold, signalling a contraction.
- The US economic outlook from the agency was slightly gloomy, indicating the consequences of higher interest rates by the Federal Reserve. Chris Williamson, Chief Business Economist at S&P Global Market Intelligence said: “The US economic upturn lost momentum at the start of the second quarter, with the flash PMI survey respondents reporting below-trend business activity growth in April. Further pace may be lost in the coming months, as April saw inflows of new business fall for the first time in six months and firms’ future output expectations slipped to a five-month low amid heightened concern about the outlook.”
- However, the near-term outlook of Gold is bearish as Fed policymakers see the current monetary policy framework as appropriate due to strong labor demand and persistent price pressures. The Gold price could turn sideways as investors shift focus to the US core PCE Price Index data for March, which will influence speculation about when the Fed will pivot to interest rate cuts. Currently, traders expect that the Fed will start reducing interest rates from the September meeting.
- In Wednesday’s session, investors will focus on the Durable Goods Orders for March, which will be published at 12:30 GMT. In February, orders for Durable Goods rose sharply by 1.4%. Durable Goods are those goods that have a long life span and are a leading indicator of core CPI as it excludes prices of non-durable goods such as food and energy. Higher orders for Durable Goods indicate a strong demand by households, which allows factories to raise their prices at factory gates.
Technical Analysis: Gold price faces pressure near $2,320
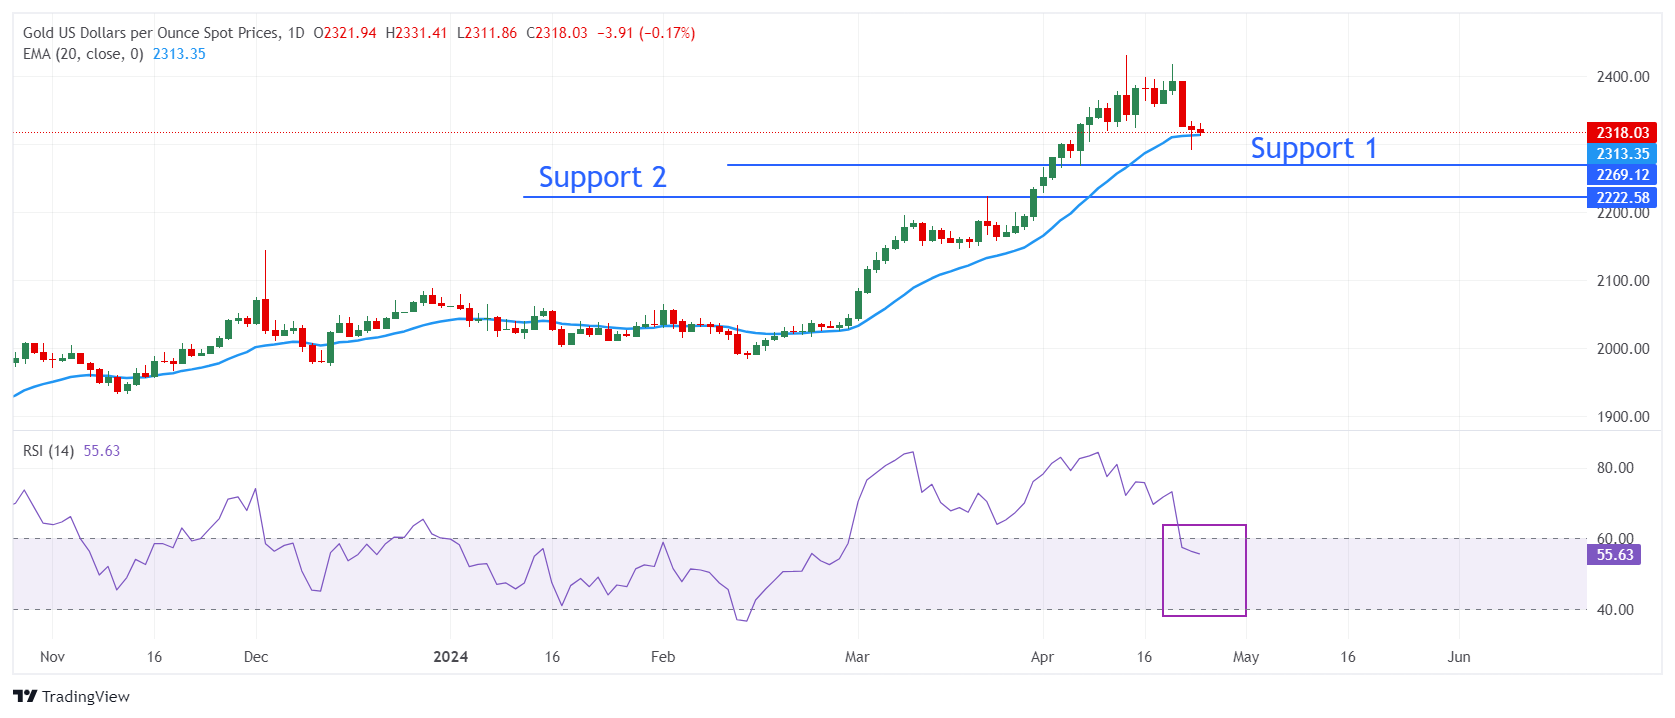
Gold price struggles for a firm footing near $2,300. The precious metal remains on tenterhooks after sliding to near the 20-day Exponential Moving Average (EMA), which trades around $2,313. The yellow metal could fall to a three-week low near $2,265 amid multiple headwinds. A breakdown below the three-week low of $2,265 would expose the asset to March 21 high at $2,223.
The 14-period Relative Strength Index (RSI) falls below 60.00, suggesting that a bullish momentum has come to an end. However, the upside bias is intact until it sustains above 40.00.
Gold FAQs
Gold has played a key role in human’s history as it has been widely used as a store of value and medium of exchange. Currently, apart from its shine and usage for jewelry, the precious metal is widely seen as a safe-haven asset, meaning that it is considered a good investment during turbulent times. Gold is also widely seen as a hedge against inflation and against depreciating currencies as it doesn’t rely on any specific issuer or government.
Central banks are the biggest Gold holders. In their aim to support their currencies in turbulent times, central banks tend to diversify their reserves and buy Gold to improve the perceived strength of the economy and the currency. High Gold reserves can be a source of trust for a country’s solvency. Central banks added 1,136 tonnes of Gold worth around $70 billion to their reserves in 2022, according to data from the World Gold Council. This is the highest yearly purchase since records began. Central banks from emerging economies such as China, India and Turkey are quickly increasing their Gold reserves.
Gold has an inverse correlation with the US Dollar and US Treasuries, which are both major reserve and safe-haven assets. When the Dollar depreciates, Gold tends to rise, enabling investors and central banks to diversify their assets in turbulent times. Gold is also inversely correlated with risk assets. A rally in the stock market tends to weaken Gold price, while sell-offs in riskier markets tend to favor the precious metal.
The price can move due to a wide range of factors. Geopolitical instability or fears of a deep recession can quickly make Gold price escalate due to its safe-haven status. As a yield-less asset, Gold tends to rise with lower interest rates, while higher cost of money usually weighs down on the yellow metal. Still, most moves depend on how the US Dollar (USD) behaves as the asset is priced in dollars (XAU/USD). A strong Dollar tends to keep the price of Gold controlled, whereas a weaker Dollar is likely to push Gold prices up.
- The Mexican Peso is trading higher in most key pairs after the release of weak manufacturing data hits its counterparts.
- Manufacturing PMI data out on Tuesday was lower than expected across the board.
- USD/MXN’s short-term trend has probably reversed from bullish to bearish.
The Mexican Peso (MXN) trades higher in most pairs midweek following widespread weakness among the majors after the release of disappointing Manufacturing Purchasing Manager Index (PMI) data weighed, especially on the US Dollar (USD).
Mexican Peso benefits from subdued Manufacturing data in US, Europe
The Mexican Peso gained its key pairs – USD/MXN, EUR/MXN and GBP/MXN – after the release of PMI data showed cracks in most developed economies. The Manufacturing PMI gauges were particularly low, and in the US it fell unexpectedly into contraction territory below 50.0, clocking in at 49.9, which was well below the estimated 52.0 and March’s print at 51.9.
In the UK, the manufacturing PMI also fell below 50, coming in at 48.7, from 50.3 previously, while in the Eurozone it fell to 45.6, missing estimates of an increase to 46.5.
Conversely, services sector PMIs rose by a greater-than-expected margin in most countries – bar the US.
Despite this, markets dialed forward their expectations for interest rate cuts by major central banks, especially the Federal Reserve (Fed).
Markets may be being optimistic about rate cuts, however, according to analysts at Rabobank, who quote a paragraph in the PMI reports stating that factory-cost pressures remain elevated.
“Yesterday’s manufacturing PMIs shouted ‘stagflation’, even if some heard ‘rate cuts’,” the Rabobank note said.
“..but its (the PMI report’s) fine print said: ‘Manufacturing has now registered the steeper rate of price increases in three of the past four months, with factory cost pressures intensifying in April amid higher raw material and fuel prices, contrasting with the wage-related services-led price pressures seen throughout much of 2023’,” the Rabobank note continues, suggesting the impact on FX could be short-lived.
Mexican Inflation data on tap
Mexican mid-month inflation data for April, out on Wednesday at 12:00 GMT, could adjust expectations for the Banxico’s policy approach going forward, given its insistence on data-dependency, as revealed in the last meeting’s minutes.
Mexican 1st half-month inflation in March is expected to steady at 4.48% on a year-over-year basis. On month, prices are expected to decline by 0.03% after rising 0.27% in the previous reading.
1st half-month core inflation is forecast to decline to 4.39% YoY in March from 4.69% previously. On a monthly basis, inflation is set to fall to 0.16% from 0.33%.
A higher-than-previous result is likely to further lower the probability of the central bank following up the March rate cut with another cut in the near term, and vice versa for a lower-than-previous result.
Higher interest rates generally appreciate a currency by attracting more inflows of foreign capital and the opposite for lower interest rates.
Technical Analysis: USD/MXN short-term trend now likely down
USD/MXN has probably reversed its short-term uptrend after breaking below the key 17.00 hurdle, the previous higher low – and more weakness is now expected as bears take control.
USD/MXN 4-hour Chart
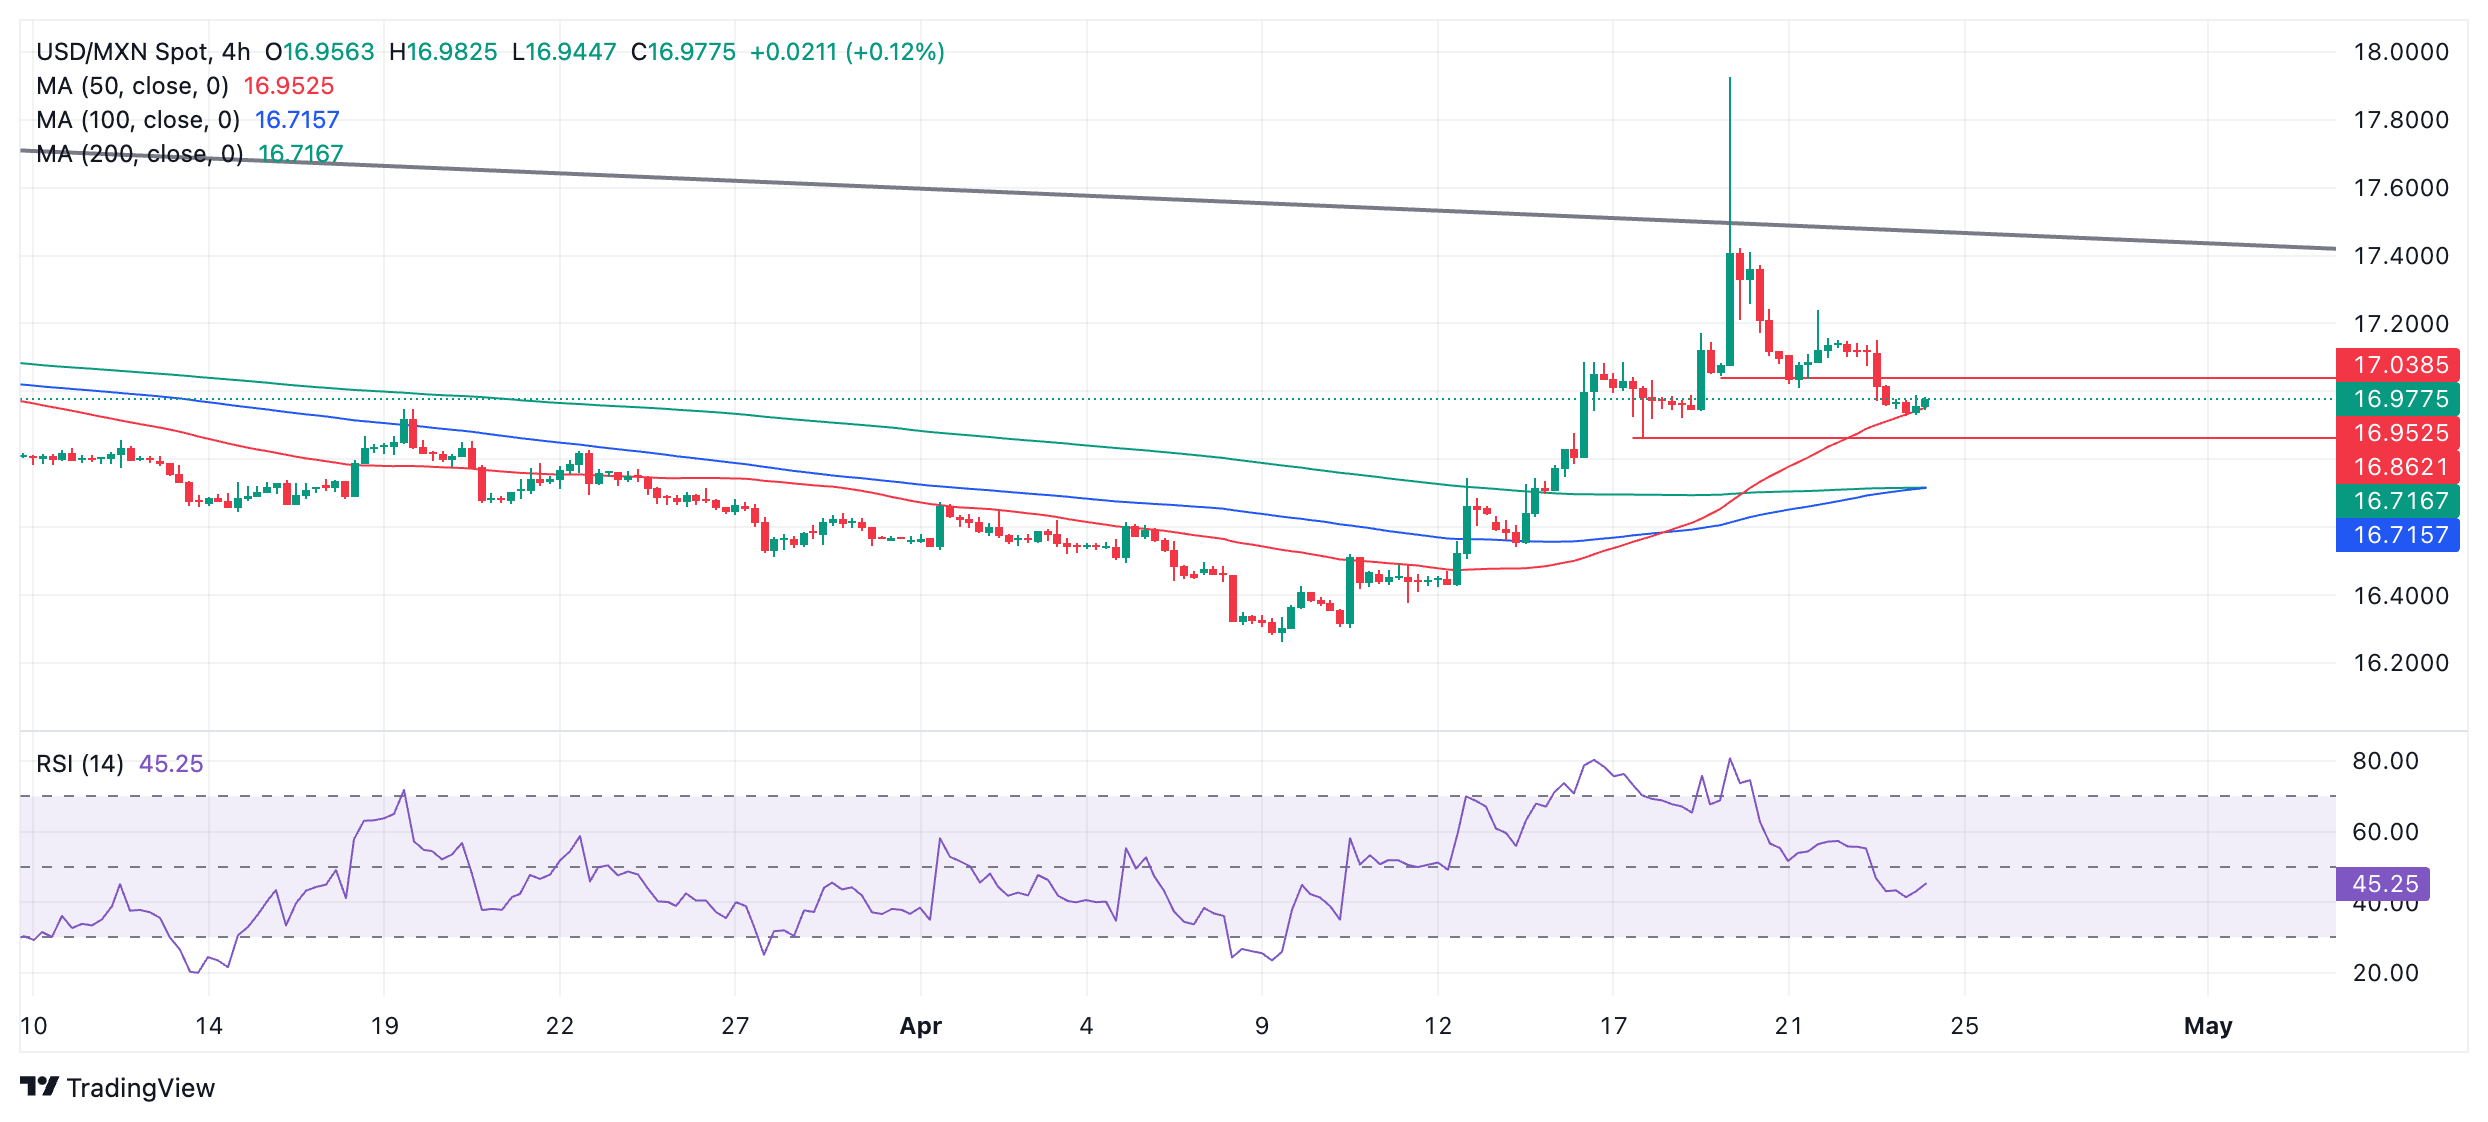
The next key support level lies at 16.86, where a major Moving Average also sits, providing dynamic support on a higher time frame chart. A decisive break below could usher in further weakness to 16.50 and then the April 9 lows at 16.26.
It will now take a decisive break above the major trendline for the long-term downtrend at roughly 17.45 to give bulls renewed confidence, and activate an upside target at roughly 18.15.
A decisive break would be one characterized by a longer-than-average green daily candlestick that pierces above the trendline and closes near its high, or three green candlesticks in a row that pierce above the level.
Economic Indicator
1st half-month Inflation
The 1st half-month core inflation index released by the Bank of Mexico is a measure of price movements by the comparison between the retail prices of a representative shopping basket of goods and services. The purchase power of Mexican Peso is dragged down by inflation. The inflation index is a key indicator since it is used by the central bank to set interest rates. Generally speaking, a high reading is seen as positive (or bullish) for the Mexican Peso, while a low reading is seen as negative (or Bearish).
Read more.Next release: Wed Apr 24, 2024 12:00
Frequency: Monthly
Consensus: -0.03%
Previous: 0.27%
Source: National Institute of Statistics and Geography of Mexico
- The US Dollar partly retraces its steps after its decline on Tuesday.
- Markets are starting to brush off the miss on US PMI data.
- The US Dollar Index heads back to 106.00 ahead of US Durable Goods data.
The US Dollar (USD) is trying to recover on Wednesday after trading firmly in the red on Tuesday. The miss on the US Purchasing Managers Index (PMI) for both the Services and Manufacturing sectors triggered a sell-off which extended to Wednesday’s Asian trading session. With the start of the European session, the dust seems to settle and seem to be considering the data miss as a one-off. Going forward, the US Gross Domestic Product (GDP) data on Thursday and the US Personal Consumption Expenditures (PCE) Price Index release on Friday will drive the next moves for the US Dollar.
On the economic data front, Wednesday’s calendar is relatively light but some data could be moving markets and the DXY US Dollar Index again. Durable Goods Orders data are due to be released, and after the PMIs disappointment, more downbeat numbers could extend doubts over the US exceptionalism. Depending on how far data would undershoot or deteriorate, a June cut might even be back on the table again by next week.
Daily digest market movers: Durable Goods to the rescue
- The Indonesian Central Bank has raised its key policy rate from 6.00% to 6.25% while markets were looking for a hold or a rate cut.
- Chinese building conglomerate Country Garden has extended all its Yuan Bonds in order to avoid a local default.
- The US Senate has passed a $95 billion aid package for Ukraine, Israel and Taiwan.
- USD/JPY is ticking up again to 154.90, making a new multi-decade high. Bank of America has warned in a report on Wednesday that a forex intervention might be nearby.
- At 11:00 GMT, the weekly Mortgage Bankers Application Index will be released. Last week, the index surged by 3.3%, with no forecast pencilled in.
- At 12:30 GMT, the preliminary Durable Goods print for March will be released:
- Headline orders grew by 1.3% in February, with no forecast for March..
- Orders without transportation, a widely followed indicator by markets, are expected to increase at a steady rate of 0.3%.
- The US Treasury is heading to markets to allocate a 5-year Note.
- It is another green day in equity markets, with Asian indexes broadly up by 2% and both European equities and US indices futures up by 0.50%.
- The CME Fedwatch Tool suggests June will still be a no-change to the monetary policy rate for the Federal Reserve by 84.8%, with September bearing a 46.7% probability for a rate cut against 31.6% for unchanged.
- The benchmark 10-year US Treasury Note trades around 4.62%, near the low for this week.
US Dollar Index Technical Analysis: One drop on a hot plate
The US Dollar Index’s (DXY) recent rally broadly comes from the staggering US economy, which has been relentlessly printing positive economic numbers. Tuesday’s PMI numbers came in below estimates for the first time since last year, but investors seem to be taking this miss as a one-off rather than a sudden shock. Markets will want to await further confirmation in the data points from this week and possibly even next week before heading back to pricing in a rate cut for June.
On the upside, first 105.88 (a pivotal level since March 2023) needs to be recovered again before targeting the high of April 16 at 106.52. Further up and above the 107.00 round level, the DXY Index could meet resistance at 107.35, the October 3 high.
On the downside, 105.12 and 104.60 should also act as support ahead of the 55-day and the 200-day Simple Moving Averages (SMAs) at 104.35 and 104.05, respectively. If those two are unable to catch the falling knife price action, the 100-day SMA near 103.70 is the next best candidate.
US Dollar FAQs
The US Dollar (USD) is the official currency of the United States of America, and the ‘de facto’ currency of a significant number of other countries where it is found in circulation alongside local notes. It is the most heavily traded currency in the world, accounting for over 88% of all global foreign exchange turnover, or an average of $6.6 trillion in transactions per day, according to data from 2022. Following the second world war, the USD took over from the British Pound as the world’s reserve currency. For most of its history, the US Dollar was backed by Gold, until the Bretton Woods Agreement in 1971 when the Gold Standard went away.
The most important single factor impacting on the value of the US Dollar is monetary policy, which is shaped by the Federal Reserve (Fed). The Fed has two mandates: to achieve price stability (control inflation) and foster full employment. Its primary tool to achieve these two goals is by adjusting interest rates. When prices are rising too quickly and inflation is above the Fed’s 2% target, the Fed will raise rates, which helps the USD value. When inflation falls below 2% or the Unemployment Rate is too high, the Fed may lower interest rates, which weighs on the Greenback.
In extreme situations, the Federal Reserve can also print more Dollars and enact quantitative easing (QE). QE is the process by which the Fed substantially increases the flow of credit in a stuck financial system. It is a non-standard policy measure used when credit has dried up because banks will not lend to each other (out of the fear of counterparty default). It is a last resort when simply lowering interest rates is unlikely to achieve the necessary result. It was the Fed’s weapon of choice to combat the credit crunch that occurred during the Great Financial Crisis in 2008. It involves the Fed printing more Dollars and using them to buy US government bonds predominantly from financial institutions. QE usually leads to a weaker US Dollar.
Quantitative tightening (QT) is the reverse process whereby the Federal Reserve stops buying bonds from financial institutions and does not reinvest the principal from the bonds it holds maturing in new purchases. It is usually positive for the US Dollar.
- USD/CAD rebounds from a two-week low and draws support from a combination of factors.
- Weaker Oil prices undermine the Loonie and act as a tailwind amid renewed USD buying.
- Traders look forward to important US macro releases before placing fresh directional bets.
The USD/CAD pair attracts some buyers in the vicinity of mid-1.3600s, or a two-week low touched earlier this Wednesday and for now, seems to have snapped a five-day losing streak. Spot prices stick to modest intraday gains through the first half of the European session and currently trade near the 1.3675-1.3680 region or the top end of the daily range.
Crude Oil prices struggle to capitalize on the previous day's goodish rebound from the 50-day Simple Moving Average (SMA) support amid easing geopolitical tensions and concerns about slowing economic growth in China. This, along with expectations that the Bank of Canada (BoC) will cut interest rates in the summer amid declining inflation and slower economic growth, is seen undermining the commodity-linked Loonie and acting as a tailwind for the USD/CAD pair amid the emergence of some US Dollar (USD) dip-buying.
Investors now seem convinced that the Federal Reserve (Fed) is unlikely to begin cutting interest rates before September and have also scaled back their expectations about the number of rate cuts in 2024 to two amid still sticky inflation. The hawkish outlook, meanwhile, remains supportive of elevated US Treasury bond yields and helps revive the USD demand. That said, a generally positive risk tone might hold back traders from placing fresh bullish bets around the safe-haven buck and act as a headwind for the USD/CAD pair.
Investors might also prefer to wait on the sidelines ahead of this week's important US macro data, starting with Durable Goods Orders later during the North American session. Apart from this, the Advance US Q1 GDP report and the Personal Consumption Expenditures (PCE) Price Index on Thursday and Friday, respectively, might provide fresh cues about the Fed's rate cut path. This, in turn, will play a key role in influencing the near-term USD price dynamics and help determine the next leg of a directional move for the USD/CAD pair.
Silver prices (XAG/USD) fell on Wednesday, according to FXStreet data. Silver trades at $27.23 per troy ounce, down 0.29% from the $27.31 it cost on Tuesday.
Silver prices have increased by 6.91% since the beginning of the year.
| Unit measure | Today Price |
|---|---|
| Silver price per troy ounce | $27.23 |
| Silver price per gram | $0.88 |
The Gold/Silver ratio, which shows the number of troy ounces of Silver needed to equal the value of one troy ounce of Gold, stood at 85.16 on Wednesday, up from 85.02 on Tuesday.
Investors might use this ratio to determine the relative valuation of Gold and Silver. Some may consider a high ratio as an indicator that Silver is undervalued – or Gold is overvalued – and might buy Silver or sell Gold accordingly. Conversely, a low ratio might suggest that Gold is undervalued relative to Silver.
Global Market Movers: Comex Silver price stays defensive on ebbing geopolitical fears
- Comex Silver price turns red around $27.30 on Wednesday, despite the weaker US Dollar.
- A relaxation in Middle East geopolitical tensions drags Silver price to a two-week low.
- The rising demand for white metal in industrial uses supports the XAG/USD.
- Investors will take more cues about the US inflation trajectory and interest rate outlook from the US Q1 Gross Domestic Product (GDP) number on Thursday and the Core Personal-Consumption Expenditures (PCE) Price Index due on Friday.
(An automation tool was used in creating this post.)
Silver FAQs
Silver is a precious metal highly traded among investors. It has been historically used as a store of value and a medium of exchange. Although less popular than Gold, traders may turn to Silver to diversify their investment portfolio, for its intrinsic value or as a potential hedge during high-inflation periods. Investors can buy physical Silver, in coins or in bars, or trade it through vehicles such as Exchange Traded Funds, which track its price on international markets.
Silver prices can move due to a wide range of factors. Geopolitical instability or fears of a deep recession can make Silver price escalate due to its safe-haven status, although to a lesser extent than Gold's. As a yieldless asset, Silver tends to rise with lower interest rates. Its moves also depend on how the US Dollar (USD) behaves as the asset is priced in dollars (XAG/USD). A strong Dollar tends to keep the price of Silver at bay, whereas a weaker Dollar is likely to propel prices up. Other factors such as investment demand, mining supply – Silver is much more abundant than Gold – and recycling rates can also affect prices.
Silver is widely used in industry, particularly in sectors such as electronics or solar energy, as it has one of the highest electric conductivity of all metals – more than Copper and Gold. A surge in demand can increase prices, while a decline tends to lower them. Dynamics in the US, Chinese and Indian economies can also contribute to price swings: for the US and particularly China, their big industrial sectors use Silver in various processes; in India, consumers’ demand for the precious metal for jewellery also plays a key role in setting prices.
Silver prices tend to follow Gold's moves. When Gold prices rise, Silver typically follows suit, as their status as safe-haven assets is similar. The Gold/Silver ratio, which shows the number of ounces of Silver needed to equal the value of one ounce of Gold, may help to determine the relative valuation between both metals. Some investors may consider a high ratio as an indicator that Silver is undervalued, or Gold is overvalued. On the contrary, a low ratio might suggest that Gold is undervalued relative to Silver.
- EUR/JPY eyes more upside amid uncertainty over BoJ’s neat rate hike.
- Japan Ochi expects that an intervention is possible if the Yen slides further to 160 or 170 vs. the US Dollar.
- The speculation for ECB pivoting to interest rate cuts in June remains firm.
The EUR/JPY pair aims to extend its upside to 166.00 due to persistent weakness in the Japanese Yen. The cross consolidates near multi-year highs but is expected to rise further as investors expect that the Bank of Japan (BoJ) will struggle to tighten its monetary policy further due to absence of significant wage growth spiral.
Apart from that, Japan has raised bar for USD/JPY where the administration could do a stealth intervention has also weighed on the Japanese Yen. In Wednesday’s early European session, Senior Japan Ruling Party Executive Ochi said, "There is no broad consensus right now, but if the yen slides further toward 160 or 170 to the dollar, that may be deemed excessive and could prompt policymakers to consider some action" Reuters reported.
Earlier, investors were speculating that Japan will intervene in the FX domain when the Japanese Yen will drop to 155.00 against the US Dollar. But now higher targets for the major have exposed the Japanese Yen to more downside.
Going forward, investors will focus on the BoJ’s interest rate decision, which will be announced on Friday. A Reuters poll in the April 11-17 period showed that none of the economists have predicted a rate hike move before June. The survey also showed that economists are anticipating that the BoJ will raise interest rates one more time. The survey lacks clear consensus on when exactly the move would come.
Meanwhile, the Euro performs relatively weaker against other currencies as the European Central Bank (ECB) is widely anticipated to cut interest rates in the June meeting. ECB policymaker Villeroy de Galhau said last week that they could cut rates in the next meeting, barring a major surprise. Villeroy emphasized on returning to structural transformation as inflation is receding.
Also, ECB Joachim Nagel said in Wednesday’s European session that a June interest rate cut may not be necessarily followed up by a series of rate cuts. The statement clearly indicates that he is comfortable with a rate cut move in June.
- NZD/USD extends gains despite the prevailing bearish sentiment for the pair.
- A break below 0.5900 could lead the pair to test the rebound support level of 0.5863.
- A break into the triangle around the level of 0.5963 has the potential to weaken the bearish sentiment.
NZD/USD advances for the third consecutive session on Wednesday, trading around 0.5940 during the European session. The pair is testing the lower boundary of the daily symmetrical triangle around the level of 0.5963. A breach into the triangle could potentially weaken the bearish sentiment.
However, analysis of the lagging indicator Moving Average Convergence Divergence (MACD) suggests a downward trend for the NZD/USD pair. This is indicated by the placement of the MACD line below the centerline and the signal line.
Additionally, the 14-day Relative Strength Index (RSI) remains below the 50 level, further confirming the bearish sentiment. This could prompt NZD/USD to approach the psychological level of 0.5900. A break below this level may lead the pair to test the rebound support region around the levels of 0.5863 and 0.5850.
Alternatively, If the NZD/USD pair breaks into the symmetrical triangle, it might target the psychological barrier of 0.6000. A breakthrough above this level could support the pair's momentum to test the 50-day Exponential Moving Average (EMA) at 0.6023, which aligns with the upper boundary of the triangle around 0.6030.
NZD/USD: Daily Chart
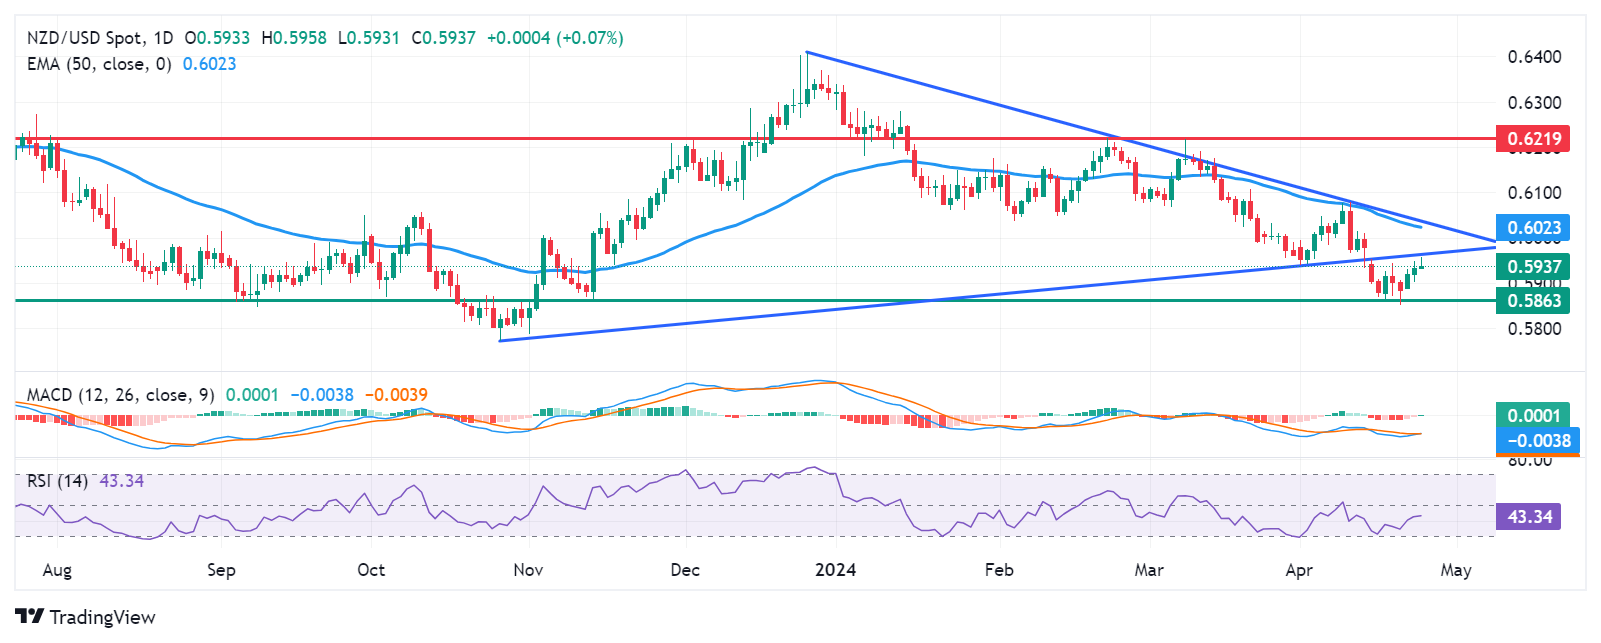
- EUR/USD climbs above the key 1.0700 psychological level early on Wednesday.
- Weaker-than-expected US PMI data on Tuesday undermined the US Dollar and fueled the recovery.
- EUR/USD’s Bear Flag pattern deforms, bringing into doubt its validity.
EUR/USD trades just shy of 1.0700 on Wednesday after weaker-than-expected private sector growth and US business activity dent the myth of US economic exceptionalism, weighing on the US Dollar (USD).
EUR/USD gains a further small bump after the release of positive German economic sentiment IFO survey data for April shows a greater-than-expected rise in the Business Climate (89.4) and Current Assessment (88.9) components, whilst Expectations increases to 89.9 in line with estimates.
EUR/USD recovers on weaker-than-expected US data
EUR/USD broke above the top of its seven-day range early on Wednesday after the Greenback lost favor with traders. The Euro (EUR), meanwhile, maintained its value on the back of growth in the Services sector revealed in Tuesday’s better-than-expected HCOB Eurozone Services PMI data for April.
In comparison, the PMI indexes from the US fell for both Services and Manufacturing in April, which took investors by surprise and suggested the economy is not coping as well as previously thought under the yoke of relatively high interest rates.
Stubborn price momentum in the services sector in both the US and Europe have delayed the time by which both the Federal Reserve (Fed) and European Central Bank (ECB) are expected to cut interest rates. Whilst ECB officials seem fairly united in wanting to cut the ECB’s base lending rate in June, Fed officials have become increasingly vague about when they might consider cutting interest rates.
Since the expectation of lower interest rates depreciates a currency, the lack of commitment of Fed officials compared to their ECB colleagues has been the main catalyst behind the US Dollar’s outperformance over recent weeks, and EUR/USD’s bearish momentum.
The higher-than-expected preliminary Services PMI data in the Eurozone revealed on Tuesday, however, introduces some doubt into confidence that the ECB will in fact go ahead with rate cuts in June.
On Wednesday, ECB governing council member and Bundesbank President Joachim Nagel reflected this doubt, saying “Services inflation remains high, driven by continued strong wage growth,” and because of this he was not convinced inflation was falling in a sustainable manner and, therefore, could not “pre-commit to a particular rate path.”
It means more weight will be given to the defining data point for the decision, which is – according to the ECB President Christine Lagarde – first quarter Eurozone wage growth data.
EUR/USD traders will now assess commentary from ECB officials on Wednesday. Meanwhile in the US, Durable Goods data will pad out the portrait of how well “Captain American Economy” is doing when it is released during the US session.
Technical Analysis: EUR/USD pierces top of short-term range
EUR/USD breaks out of the box-like range it had been trading in for the last seven days and pierces above the key 1.0700 level to bring into doubt the durability of the short-term downtrend.
It is now less certain EUR/USD is forming a Bear Flag price pattern as had previously been assumed. The pattern has quite bearish connotations with a potential downside target in the 1.0400s, so if it fails to activate the pair could reverse on the disappointment, with some short-covering adding fuel to the recovery.
EUR/USD 4-hour Chart
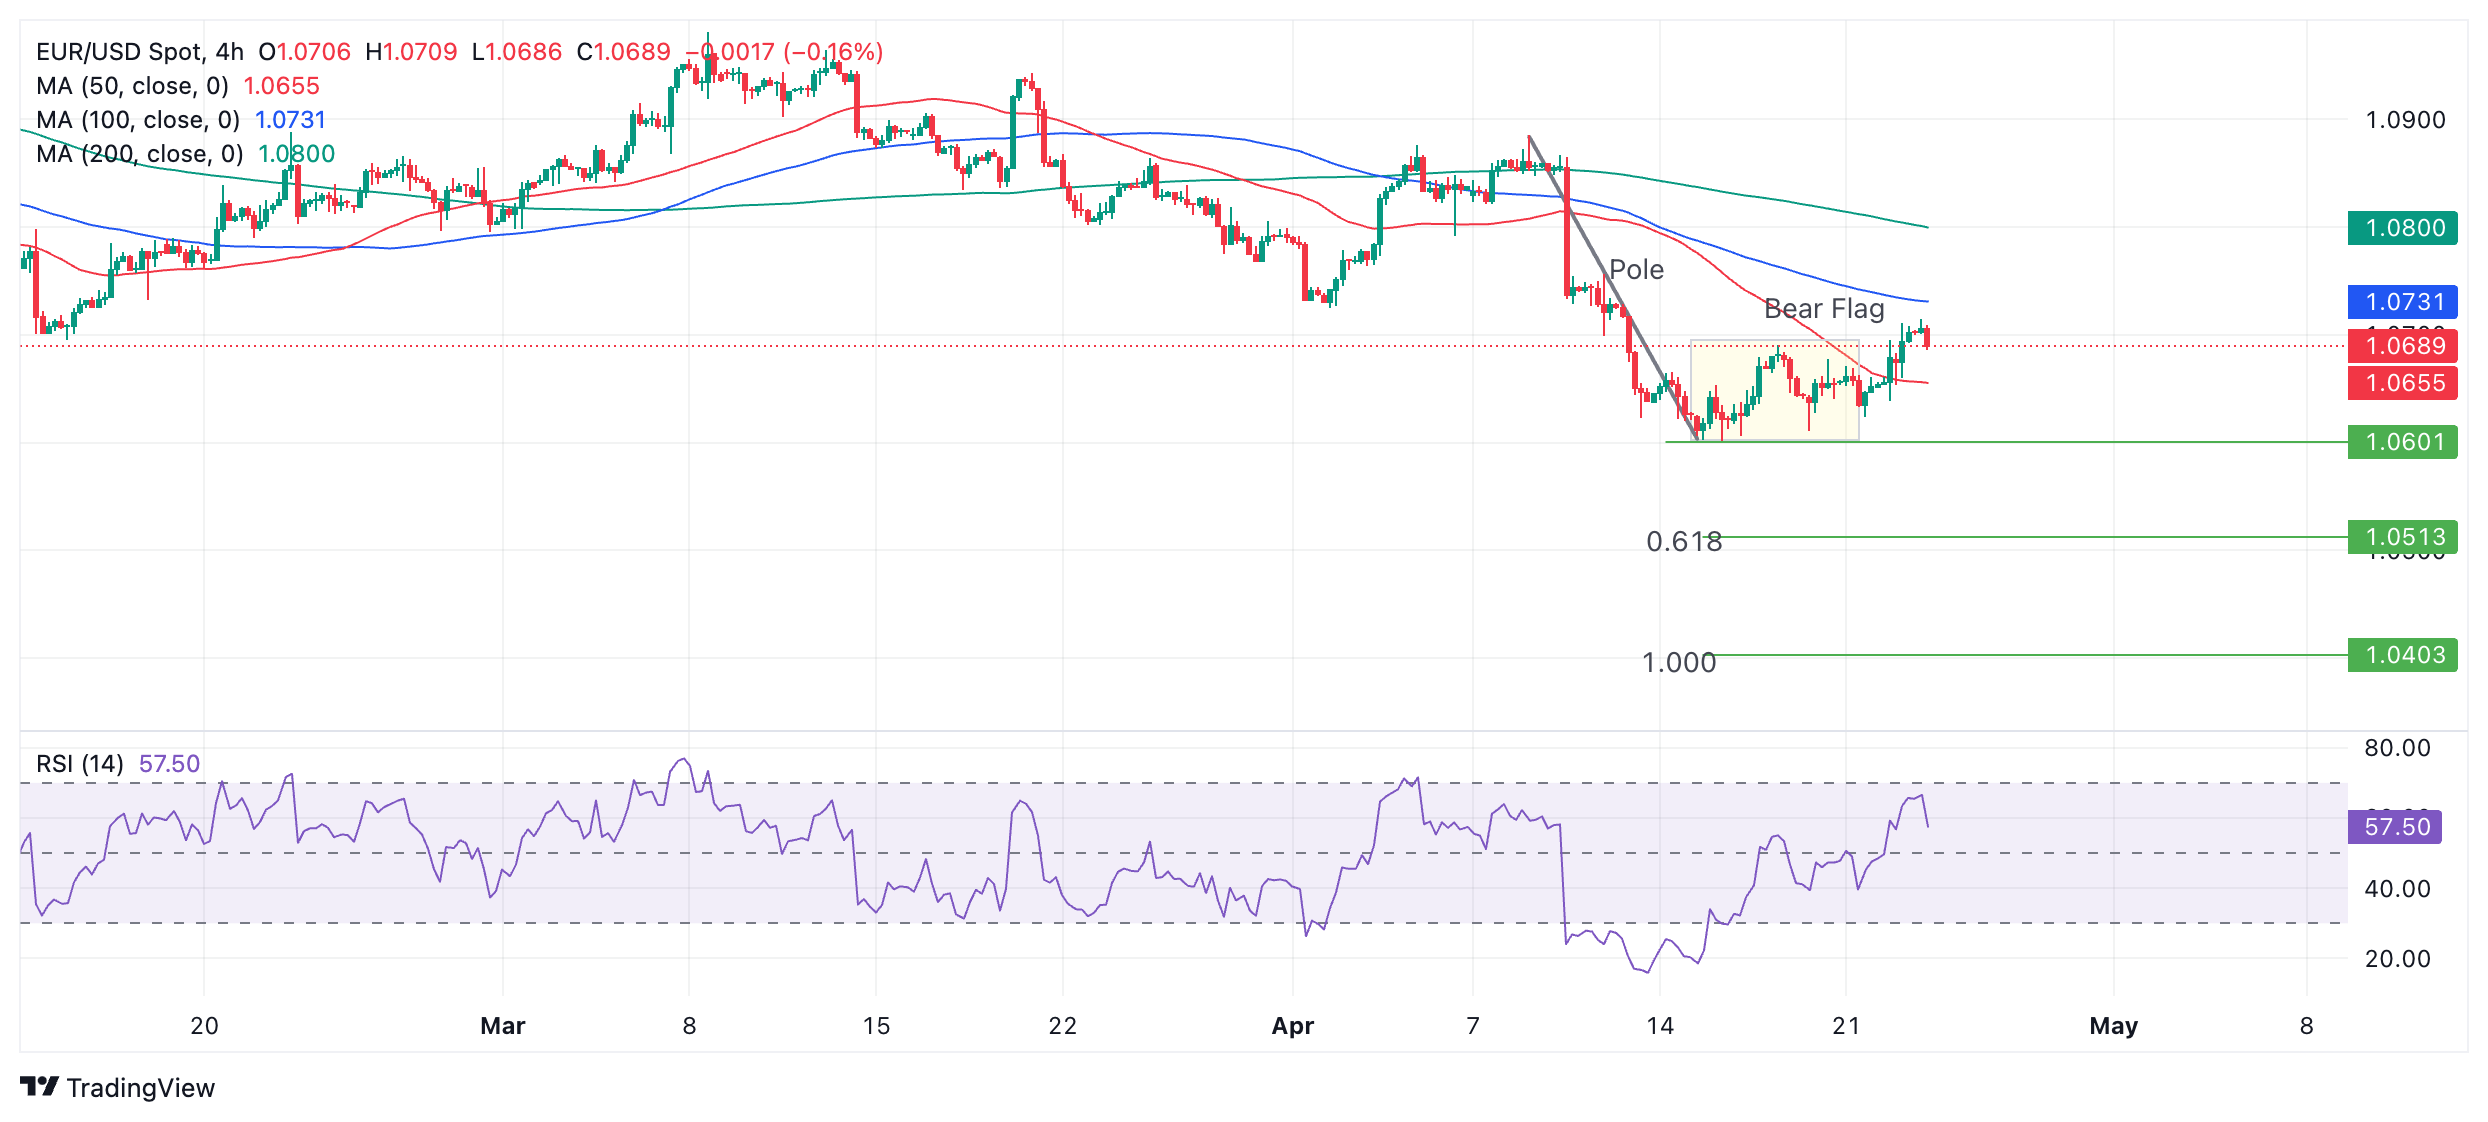
With the short-term downtrend in doubt more upside is possible, with the next target at resistance from the previous lower high providing an initial target at 1.0758. After that, the 50-day and 200-day Simple Moving Averages (SMA) provide resistance at 1.0807 on the daily chart (not shown).
A break below the 1.0601 April 16 low, however, would prove the Bear Flag hypothesis valid in the end and signal the start of a decline.
According to technical lore, the expected move out of a Bear Flag usually equals the length of the “pole” or steep decline preceding the box-like formation of the flag square, or a Fibonacci ratio of the pole.
The Fibonacci 0.618 ratio of the pole extrapolated lower provides the most reliable conservative target. This gives a price objective at 1.0503. After that, the next concrete target is at 1.0446 – the October 2023 low. A fall of equal length to the pole would take EUR/USD down to 1.0403.
Economic Indicator
IFO – Business Climate
This German business sentiment index released by the CESifo Group is closely watched as an early indicator of current conditions and business expectations in Germany. The Institute surveys more than 7,000 enterprises on their assessment of the business situation and their short-term planning. The positive economic growth anticipates bullish movements for the EUR, while a low reading is seen as negative (or bearish).
Read more.Last release: Wed Apr 24, 2024 08:00
Frequency: Monthly
Actual: 89.4
Consensus: 88.9
Previous: 87.8
Source: IFO Institute
- The Pound Sterling holds recovery to near 1.2450 on an upbeat preliminary S&P Global/CIPS PMI report for April.
- BoE Haskel wants to see more slack in labor demand to gain confidence that inflation will sustainably return to the 2% target.
- Weak US PMI for April weighed on the US Dollar.
The Pound Sterling (GBP) turns sideways at around 1.2450 against the US Dollar (USD) in Wednesday’s European session after bouncing back strongly from a five-month low at around 1.2300 earlier in the week. The GBP/USD pair capitalizes on strong United Kingdom preliminary PMI numbers for April and a steep correction in the US Dollar.
On Tuesday, the S&P Global/CIPS reported that new business volumes increased across the private sector as a whole in April. “The rate of growth was the strongest since May 2023, but the expansion was centred on the service economy as manufacturers saw a moderate downturn in order books.”
Strong new business volumes usually indicate an upbeat consumer spending outlook, which could boost inflationary pressures and allow the Bank of England (BoE) to delay interest-rate cuts. The scenario bodes well for the Pound Sterling.
The USD came under pressure after S&P Global surprisingly reported weak preliminary US PMI numbers for April. The Manufacturing PMI dropped below the 50.0 threshold, signalling a contraction in the sector, and the Services PMI fell sharply to 50.9. The US Dollar Index (DXY), which measures the US Dollar’s value against six major currencies, attempted to establish firm footing near 105.70.
Daily digest market movers: Pound Sterling eyes more upside, US Dollar strives for support
- The Pound Sterling aims to extend upside above the immediate resistance of 1.2450 against the US Dollar due to multiple tailwinds. The uncertainty about when the Bank of England could start reducing interest rates and strong preliminary PMI data for April reported by S&P Global/CIPS on Tuesday have boosted demand for the Pound Sterling.
- Traders remain split between June and August policy meetings as the start of the easing cycle. "It is between June and August, we are leaning slightly towards August on the basis that one of the key things the Bank is looking at is services inflation," said James Smith, economist at ING Financial Markets. "If services inflation is a little bit stickier, I think that tilts the balance a little bit further towards August over June, but it's a pretty close call to be honest."
- Also, distinct commentaries from BoE policymakers keep the timing of the BoE’s first interest rate cut uncertain. Last week, BoE deputy governor Dave Ramsden said inflation could decline faster than the pace projected by the central bank in its latest forecasts. Ramsden remains confident that inflation will return to the 2% target in May and will remain there for the next three years.
- On the contrary, BoE policymaker Jonathan Haskel is worried about inflation remaining persistent due to tight labor market conditions. Haskel said, "The labour market is central to the inflation aspect." He added that he wants to see the job market easing further to be confident about inflation returning to the 2% target, reported Reuters.
- On the economic data front, the S&P Global/CIPS reported stronger-than-expected preliminary PMI data for April on Tuesday. Surprisingly, the Services PMI jumped to 54.9 from the prior reading of 53.1. Investors had forecasted the Services PMI to drop slightly to 53.0. On the contrary, the preliminary Manufacturing PMI surprisingly dropped below the 50.0 threshold that separates expansion from contraction after being in the expansion territory since January. The factory PMI fell sharply to 48.7 from expectations and the prior reading of 50.3.
Technical Analysis: Pound Sterling rises to 1.2450
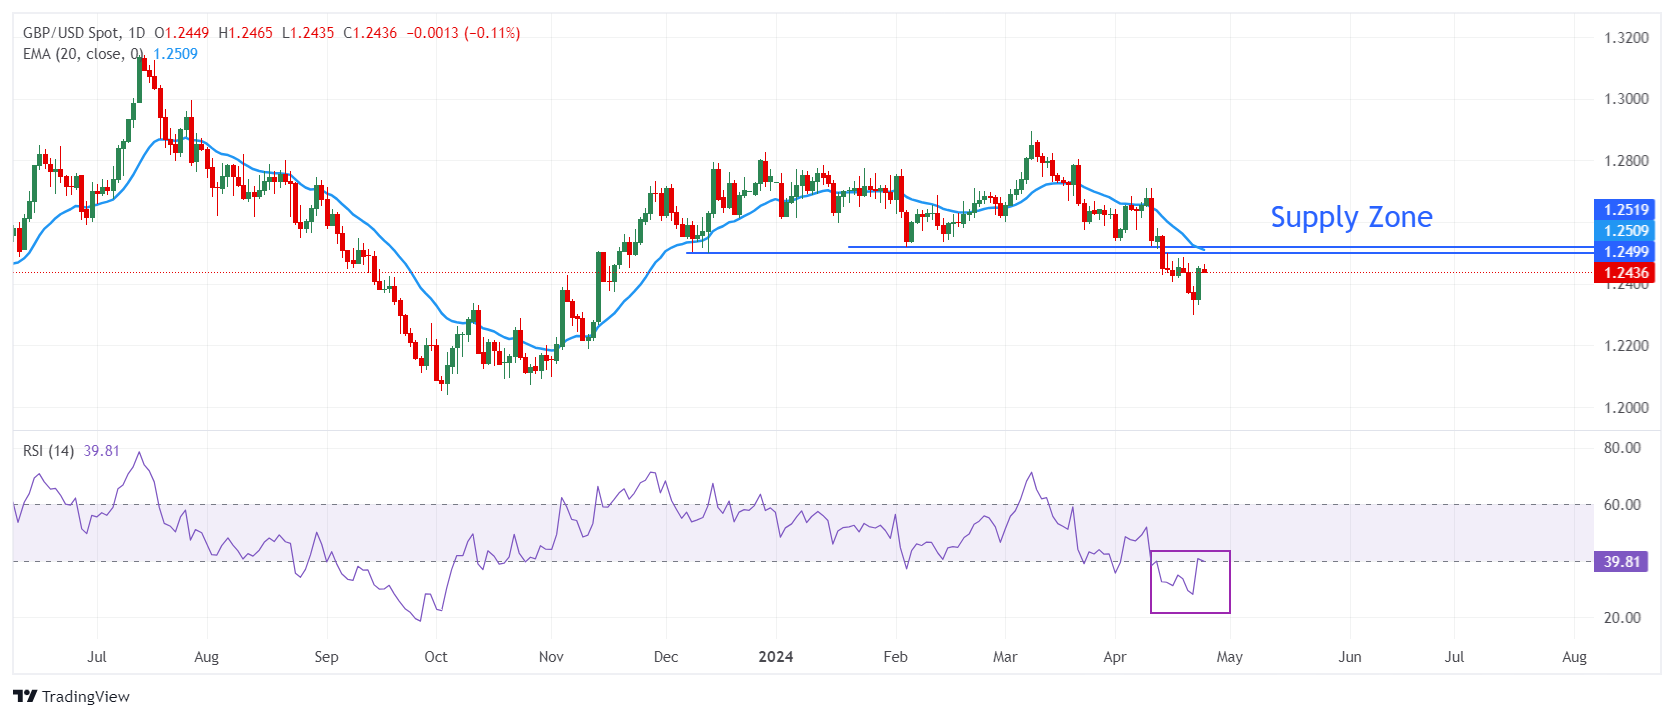
The Pound Sterling recovers sharply from a five-month low of 1.2300 against the US Dollar. The GBP/USD pair moved higher to 1.2450 on Tuesday and remains at around this level at the time of writing. The upside is limited near the supply zone, placed in a tight range of 1.2500-1.2520. The near-term outlook of the Cable remains weak as the 20-day Exponential Moving Average (EMA) at 1.2509 is declining.
The 14-period Relative Strength Index (RSI) rebounds to 40.00, which could act as a ceiling ahead. The speculation for a bullish reversal could emerge if the momentum oscillator decisively breaks above 40.00.
Pound Sterling FAQs
The Pound Sterling (GBP) is the oldest currency in the world (886 AD) and the official currency of the United Kingdom. It is the fourth most traded unit for foreign exchange (FX) in the world, accounting for 12% of all transactions, averaging $630 billion a day, according to 2022 data. Its key trading pairs are GBP/USD, aka ‘Cable’, which accounts for 11% of FX, GBP/JPY, or the ‘Dragon’ as it is known by traders (3%), and EUR/GBP (2%). The Pound Sterling is issued by the Bank of England (BoE).
The single most important factor influencing the value of the Pound Sterling is monetary policy decided by the Bank of England. The BoE bases its decisions on whether it has achieved its primary goal of “price stability” – a steady inflation rate of around 2%. Its primary tool for achieving this is the adjustment of interest rates. When inflation is too high, the BoE will try to rein it in by raising interest rates, making it more expensive for people and businesses to access credit. This is generally positive for GBP, as higher interest rates make the UK a more attractive place for global investors to park their money. When inflation falls too low it is a sign economic growth is slowing. In this scenario, the BoE will consider lowering interest rates to cheapen credit so businesses will borrow more to invest in growth-generating projects.
Data releases gauge the health of the economy and can impact the value of the Pound Sterling. Indicators such as GDP, Manufacturing and Services PMIs, and employment can all influence the direction of the GBP. A strong economy is good for Sterling. Not only does it attract more foreign investment but it may encourage the BoE to put up interest rates, which will directly strengthen GBP. Otherwise, if economic data is weak, the Pound Sterling is likely to fall.
Another significant data release for the Pound Sterling is the Trade Balance. This indicator measures the difference between what a country earns from its exports and what it spends on imports over a given period. If a country produces highly sought-after exports, its currency will benefit purely from the extra demand created from foreign buyers seeking to purchase these goods. Therefore, a positive net Trade Balance strengthens a currency and vice versa for a negative balance.
Gold prices rose in India on Wednesday, according to data from India's Multi Commodity Exchange (MCX).
Gold price stood at 71,911 Indian Rupees (INR) per 10 grams, up INR 554 compared with the INR 71,357 it cost on Tuesday.
As for futures contracts, Gold prices decreased to INR 70,972 per 10 gms from INR 71,029 per 10 gms.
Prices for Silver futures contracts increased to INR 80,690 per kg from INR 80,678 per kg.
| Major Indian city | Gold Price |
|---|---|
| Ahmedabad | 74,430 |
| Mumbai | 74,235 |
| New Delhi | 74,230 |
| Chennai | 74,380 |
| Kolkata | 74,475 |
Global Market Movers: Comex Gold price struggles amid positive risk tone, modest USD strength
- Easing concerns over geopolitical tensions in the Middle East remain supportive of a generally positive risk tone and continue to act as a headwind for the safe-haven Gold price on Comex.
- Hawkish comments from Federal Reserve officials lifted bets that the US central bank will keep rates higher for longer and further undermined the non-yielding yellow metal.
- The weaker US PMI prints released on Tuesday keep the US Dollar bulls on the defensive near a one-and-half-week low, which is seen lending some support to the commodity.
- The S&P Global Composite Purchasing Managers Index (PMI) fell to 50.9 in April's flash estimate, suggesting that the business activity in the US private sector expanded at a slower pace.
- Meanwhile, the S&P Global Manufacturing PMI unexpectedly dropped into the contraction territory in April, while the gauge for the services sector declined to 50.9 from 51.7 in March.
- Traders also prefer to wait on the sidelines ahead of this week's key US macro data, which might influence the Fed's future policy decision and provide a fresh impetus to the XAU/USD.
- Wednesday's US economic docket features Durable Goods Orders, though the focus remains on the Advance Q1 GDP report and the Personal Consumption Expenditures (PCE) Price Index.
(An automation tool was used in creating this post.)
Gold FAQs
Gold has played a key role in human’s history as it has been widely used as a store of value and medium of exchange. Currently, apart from its shine and usage for jewelry, the precious metal is widely seen as a safe-haven asset, meaning that it is considered a good investment during turbulent times. Gold is also widely seen as a hedge against inflation and against depreciating currencies as it doesn’t rely on any specific issuer or government.
Central banks are the biggest Gold holders. In their aim to support their currencies in turbulent times, central banks tend to diversify their reserves and buy Gold to improve the perceived strength of the economy and the currency. High Gold reserves can be a source of trust for a country’s solvency. Central banks added 1,136 tonnes of Gold worth around $70 billion to their reserves in 2022, according to data from the World Gold Council. This is the highest yearly purchase since records began. Central banks from emerging economies such as China, India and Turkey are quickly increasing their Gold reserves.
Gold has an inverse correlation with the US Dollar and US Treasuries, which are both major reserve and safe-haven assets. When the Dollar depreciates, Gold tends to rise, enabling investors and central banks to diversify their assets in turbulent times. Gold is also inversely correlated with risk assets. A rally in the stock market tends to weaken Gold price, while sell-offs in riskier markets tend to favor the precious metal.
The price can move due to a wide range of factors. Geopolitical instability or fears of a deep recession can quickly make Gold price escalate due to its safe-haven status. As a yield-less asset, Gold tends to rise with lower interest rates, while higher cost of money usually weighs down on the yellow metal. Still, most moves depend on how the US Dollar (USD) behaves as the asset is priced in dollars (XAU/USD). A strong Dollar tends to keep the price of Gold controlled, whereas a weaker Dollar is likely to push Gold prices up.
- German IFO Business Climate Index surpasses estimates with 89.4 in April.
- IFO Current Economic Assessment improved to 88.9 in the reported month.
The headline German IFO Business Climate Index came in at 89.4 in April, way higher than the March reading of 87.9. The market forecast was for an 88.9 print.
Meanwhile, the Current Economic Assessment Index rose from 88.1 in March to 88.9 in the same period, beating estimates of 88.7.
The IFO Expectations Index – indicating firms’ projections for the next six months, improved to 89.9 in April vs. 87.7 seen in March while surpassing the expected 88.9 figure.
Market reaction to the German IFO Survey
EUR/USD fails to find inspiration from the upbeat German IFO survey. At the time of writing, the pair is trading 0.09% lower at 1.0688 amid resurgent US Dollar demand.
About German IFO
The headline IFO business climate index was rebased and recalibrated in April after the IFO Research Institute changed the series from the base year of 2000 to the base year of 2005 as of May 2011 and then changed series to include services as of April 2018. The survey now includes 9,000 monthly survey responses from firms in the manufacturing, service sector, trade and construction.
European Central Bank (ECB) policymaker and Bundesbank Chief Joachim Nagel said on Wednesday that a June interest rate cut may not be necessarily followed up by a series of rate cuts.
Additional comments
Services inflation remains high, driven by continued strong wage growth.
Not fully convinced that inflation will actually return to target in a timely, sustained manner.
Given the uncertainty, we cannot pre-commit to a particular rate path.
Market reaction
EUR/USD is easing below 1.0700 despite Nagel’s hawkish comments. The pair is currently trading at 1.0692, losing 0.07% so far.
ECB FAQs
The European Central Bank (ECB) in Frankfurt, Germany, is the reserve bank for the Eurozone. The ECB sets interest rates and manages monetary policy for the region. The ECB primary mandate is to maintain price stability, which means keeping inflation at around 2%. Its primary tool for achieving this is by raising or lowering interest rates. Relatively high interest rates will usually result in a stronger Euro and vice versa. The ECB Governing Council makes monetary policy decisions at meetings held eight times a year. Decisions are made by heads of the Eurozone national banks and six permanent members, including the President of the ECB, Christine Lagarde.
In extreme situations, the European Central Bank can enact a policy tool called Quantitative Easing. QE is the process by which the ECB prints Euros and uses them to buy assets – usually government or corporate bonds – from banks and other financial institutions. QE usually results in a weaker Euro. QE is a last resort when simply lowering interest rates is unlikely to achieve the objective of price stability. The ECB used it during the Great Financial Crisis in 2009-11, in 2015 when inflation remained stubbornly low, as well as during the covid pandemic.
Quantitative tightening (QT) is the reverse of QE. It is undertaken after QE when an economic recovery is underway and inflation starts rising. Whilst in QE the European Central Bank (ECB) purchases government and corporate bonds from financial institutions to provide them with liquidity, in QT the ECB stops buying more bonds, and stops reinvesting the principal maturing on the bonds it already holds. It is usually positive (or bullish) for the Euro.
- USD/CHF remains bullish due to disparities in expected policy trajectories between the Fed and SNB.
- The Swiss Franc is under downward pressure as the SNB is anticipated to implement another rate cut in June.
- The US Dollar has rebounded, potentially driven by the higher 10-year yield on US Treasury bond.
USD/CHF hovers near 0.9140 during early European trading hours on Wednesday, maintaining its position close to the six-month high of 0.9152 reached on April 15. The Swiss Franc (CHF) faces challenges due to the notable disparities in expected monetary policy trajectories between the US Federal Reserve (Fed) and the Swiss National Bank (SNB).
Swiss annual inflation dropped to a more than two-year low of 1% in March, emphasizing the SNB's assertion that underlying inflation has moderated. This, coupled with pessimistic Business Confidence indicators and a decline in Retail Sales, has strengthened market expectations that the SNB may implement another rate cut in June.
The CHF had already experienced significant depreciation after the Swiss National Bank unexpectedly reduced its main interest rate by 25 basis points to 1.50% in March, becoming the first major central bank to reverse course on tighter monetary policy.
In the United States (US), the probability of the Federal Reserve's maintaining interest rates unchanged in the June meeting has risen to 84.6%, up from the previous week's 82.7%, according to the CME FedWatch Tool.
The US Dollar Index (DXY), which measures the US Dollar (USD) against six major currencies, has rebounded due to a higher 10-year yield on US Treasury bonds, standing at 4.62%, up by 0.54% at the time of writing. However, disappointing US Purchasing Managers Index (PMI) data is weighing on the Greenback, thereby limiting the advance of the USD/CHF pair.
In April, the preliminary S&P Global Composite PMI for the US declined to 50.9 from the previous reading of 52.1. Additionally, the Manufacturing PMI fell to 49.9 from 51.9 in the previous reading, below the estimated 52.0. Similarly, the Services PMI decreased to 50.9, compared to the prior 51.7, falling short of the expected 52.0.
Here is what you need to know on Wednesday, April 24:
After weakening against its major rivals in the American session on Tuesday, the US Dollar (USD) seems to have stabilized in the European morning on Wednesday. IFO sentiment data from Germany will be watched closely by market participants midweek. Later in the day, the US economic docket will feature Durable Goods Orders for March.
The USD Index turned south in the second half of the day on Tuesday and closed the day 0.4% lower after the data from the US showed that the business activity in the private sector expanded at a softening pace in early April. The S&P Global Composite PMI declined to 50.9 from 52.1 in March, while the S&P Global Manufacturing PMI fell into the contraction territory, arriving at 49.9. Early Wednesday, the USD Index fluctuates in a narrow range below 106.00 and the benchmark 10-year US Treasury bond yield clings to modest daily gains above 4.6%. After Wall Street's main indexes registered gains for the second consecutive day on Tuesday, US stock index futures trade in positive territory in the European morning.
US Dollar price this week
The table below shows the percentage change of US Dollar (USD) against listed major currencies this week. US Dollar was the weakest against the Australian Dollar.
| USD | EUR | GBP | CAD | AUD | JPY | NZD | CHF | |
| USD | -0.35% | -0.57% | -0.50% | -1.31% | 0.19% | -0.65% | 0.30% | |
| EUR | 0.35% | -0.21% | -0.14% | -0.94% | 0.54% | -0.27% | 0.65% | |
| GBP | 0.56% | 0.21% | 0.07% | -0.74% | 0.74% | -0.07% | 0.85% | |
| CAD | 0.50% | 0.15% | -0.07% | -0.81% | 0.67% | -0.14% | 0.79% | |
| AUD | 1.29% | 0.93% | 0.74% | 0.80% | 1.42% | 0.66% | 1.59% | |
| JPY | -0.19% | -0.54% | -0.76% | -0.67% | -1.49% | -0.81% | 0.11% | |
| NZD | 0.66% | 0.28% | 0.06% | 0.14% | -0.67% | 0.77% | 0.89% | |
| CHF | -0.29% | -0.65% | -0.86% | -0.79% | -1.61% | -0.11% | -0.92% |
The heat map shows percentage changes of major currencies against each other. The base currency is picked from the left column, while the quote currency is picked from the top row. For example, if you pick the Euro from the left column and move along the horizontal line to the Japanese Yen, the percentage change displayed in the box will represent EUR (base)/JPY (quote).
During the Asian trading hours, the data from Australia showed that inflation, as measured by the change in the Consumer Price Index (CPI), softened to 3.6% on a yearly basis in the first quarter from 4.1%. This reading, however, came in above the market expectation of 3.4%. On a quarterly basis, the CPI rose 1% in Q1. AUD/USD gathered bullish momentum following the inflation data and was last seen rising nearly 0.5% on the day above 0.6500.
Australian Dollar holds position due to risk-on sentiment amid stable US Dollar.
EUR/USD rose 0.5% on Tuesday and climbed above 1.0700 for the first time in over a week. The pair stays relatively quiet near 1.0700 in the European morning.
GBP/USD benefited from the broad USD weakness on Tuesday and gained 0.8%, snapping a three-day losing streak. The pair holds steady at around 1.2450 early Wednesday.
USD/JPY ignored the selling pressure surrounding the USD and extended its sideways action on Tuesday. The pair trades within a few pips of 155.00 in the European session.
Japanese Yen hangs near multi-decade low against USD, close to 155.00 mark.
After registering its largest one-day loss of the year by falling more than 2.5% on Monday, Gold continued to push lower and declined below $2,300 for the first time in nearly three weeks on Tuesday. Although XAU/USD managed to stage a rebound later in the day, it failed to gather momentum. Early Wednesday, the pair trades in a narrow band at around $2,320.
Gold price ticks higher amid modest USD weakness, positive risk tone might cap gains.
Economic Indicator
Durable Goods Orders
The Durable Goods Orders, released by the US Census Bureau, measures the cost of orders received by manufacturers for durable goods, which means goods planned to last for three years or more, such as motor vehicles and appliances. As those durable products often involve large investments they are sensitive to the US economic situation. The final figure shows the state of US production activity. Generally speaking, a high reading is bullish for the USD.
Read more.Last release: Tue Mar 26, 2024 12:30
Frequency: Monthly
Actual: 1.4%
Consensus: 1.3%
Previous: -6.1%
Source: US Census Bureau
- Silver price turns red around $27.30 on Wednesday, despite the weaker USD.
- A relaxation in Middle East geopolitical tensions drags silver price to a two-week low.
- The rising demand for white metal in industrial uses supports the XAG/USD.
Silver price (XAG/USD) trades on a softer note near $27.30 during the early European session on Wednesday. The easing of tensions in the Middle East and the risk-on environment cap the upside of the white metal.
Geopolitical tensions in the Middle East, particularly in Israel and Iran, have boosted the price of precious metals in recent weeks. However, those fears have largely dissipated as Iran and Israel have signaled they are not interested in a wider war after attacks earlier this month. This, in turn, leads traders to reduce their precious metal positions and favor riskier assets.
Furthermore, the robust economy and rising inflation pressures in the United States have triggered the expectation that the US Fed might delay its easing cycle this year, which weighs on the US Dollar-denominated silver. Investors will take more cues about inflation trajectory and interest rate outlook from the US Q1 Gross Domestic Product (GDP) number on Thursday and the Core Personal-Consumption Expenditures (PCE) Price Index, the Federal Reserve's (Fed) preferred gauge of underlying inflation, due later on Friday.
On the other hand, rising demand for silver, driven by its industrial uses in photovoltaics, semiconductors, and electric vehicle charging, along with a significant deficit in silver supply, might boost the white metal for the time being. According to the Silver Institute, industrial demand for silver set a record in 2023 of 654.4 million ounces, owing to sustained structural gains from green economy applications.
FX option expiries for Apr 24 NY cut at 10:00 Eastern Time, via DTCC, can be found below
- EUR/USD: EUR amounts
- 1.0550 565m
- 1.0575 400m
- 1.0600 440m
- 1.0610 1.1b
- 1.0650 1.1b
- 1.0700 2.3b
- 1.0705 645m
- 1.0725 860m
- GBP/USD: GBP amounts
- 1.2450 613m
- USD/JPY: USD amounts
- 153.00 452m
- 153.50 1.5b
- 154.00 902m
- 155.40 1b
- USD/CHF: USD amounts
- 0.9150 765m
- AUD/USD: AUD amounts
- 0.6325 500m
- 0.6400 472m
- 0.65425 335m
- USD/CAD: USD amounts
- 1.3600 600m
- 1.3650 625m
- 1.3680 914m
- EUR/GBP: EUR amounts
- 0.8600 351m
- EUR/USD holds positive ground around 1.0705 in Wednesday’s early European session.
- The pair keeps the bearish vibe unchanged below the key EMA.
- The first upside barrier is seen at the 1.0710–1.0715 region; the first downside target is located at 1.0638.
The EUR/USD pair trades in positive territory for the fourth consecutive day near 1.0705 on Wednesday during the early European trading hours. The recovery of the major pair is bolstered by the downbeat US April PMI data, which weighs on the Greenback. Later in the day, Germany’s IFO business sentiment index and Expectations will be published. On the US docket, the US March Durable Goods Orders will be released.
Technically, the bearish trend of EUR/USD remains intact on the four-hour chart, as the major pair is below the key 100-period Exponential Moving Average (EMA). In the event that the EUR/USD pair crosses above the key 100-period EMA, it will resume its upside. It’s worth noting that the Relative Strength Index (RSI) stands in bullish territory around 66, suggesting that further upside cannot be ruled out.
A decisive break above the upper boundary of the Bollinger Band and the 100-period EMA in the 1.0710-1.0715 zone will see a rally to a high of April 11 at 1.0756. The next key upside barrier is seen at the confluence of a low of March 22 and a psychological level at 1.0800. The additional upside filter to watch is a high of April 4 at 1.0875.
On the other hand, the first downside target is located near a low of April 23 at 1.0638. Any follow-through selling below the latter will see a drop to the lower limit of the Bollinger Band at 1.0625. A breach of this level will expose a low of November 2 at 1.0565.
EUR/USD four-hour chart
-638495321264262842.png)
- WTI consolidates in a narrow range and is influenced by a combination of diverging forces.
- Easing geopolitical risks acts as a headwind, though improving demand outlook lends support.
- Traders look to US Durable Goods Orders and the official US inventory data for a fresh impetus.
West Texas Intermediate (WTI) US crude Oil prices struggle to build on the overnight bounce from the 50-day Simple Moving Average (SMA) support near the $80.75 area and oscillate in a range during the Asian session on Wednesday. The commodity currently trades around the $83.25 region, nearly unchanged for the day, and is influenced by a combination of diverging forces.
Concerns about a further escalation of geopolitical tensions in the Middle East eased after Iran signaled that it has no plans to retaliate against the Israeli limited-scale missile strike. This reduces the risk premium from markets and acts as a headwind for Crude Oil prices. That said, the Israel-Hamas war, so far, has shown little signs of abating, keeping risks of Middle Eastern geopolitics in play and lending some support to the black liquid.
Adding to this, expectations that major central banks will cut interest rates to support economic growth, which, in turn, will boost fuel consumption, and a surprise drop in US crude inventories last week help limit the downside for Crude Oil prices. In fact, the American Petroleum Institute (API) reported on Tuesday that US oil inventories fell by 3.2 million barrels during the week to April 19 and added to the optimism over improving demand.
Meanwhile, the US Dollar (USD) languishes near its lowest level in over a week in the wake of Tuesday's disappointing US PMI prints for April and further seems to lend support to the commodity. That said, expectations that the Federal Reserve (Fed) will keep rates higher for longer support prospects for the emergence of some USD dip-buying and warrants caution before positioning for any further near-term appreciating move for Crude Oil prices.
Traders now look forward to the official US crude inventory data for confirmation of the big drawdown and some meaningful impetus. Apart from this, the release of the US Durable Goods Orders might influence the USD and produce short-term trading opportunities around Crude Oil prices. The focus, however, remains on the Advance US Q1 GDP report and the Personal Consumption Expenditures (PCE) Price Index on Thursday and Friday, respectively.
- GBP/USD tests the major level of 1.2450 despite the bearish sentiment shown by the technical analysis.
- The pair continues to trade below the pullback resistance level at 1.2518, positioned near the lower boundary of the descending triangle.
- The breach into the descending channel around the level of 1.2490 may lead to a weakening of the bearish sentiment.
GBP/USD has been on the rise for the second consecutive day, trading around 1.2450 in Asian trading on Wednesday. However, the pair is still below the pullback resistance at 1.2518, which coincides with the lower boundary of the descending triangle at 1.2510. Furthermore, the 14-day Relative Strength Index (RSI) is below the 50 level, indicating a bearish sentiment.
Additionally, the Moving Average Convergence Divergence (MACD) confirms this bearish trend, with the MACD line below the centerline and the signal line. Looking ahead, GBP/USD could encounter significant support around the psychological level of 1.2400. If this level is breached, the pair may test the five-month low of 1.2300.
On the upside, breaching the descending triangle around the level of 1.2490, along with surpassing the psychological level of 1.2500, could potentially weaken the bearish sentiment. Further resistance is anticipated around the pullback resistance level at 1.2518 and the 38.2% Fibonacci retracement level at 1.2527, drawn between 1.2894 and 1.2300.
A breakthrough above the latter resistance region might signify a shift towards a bullish sentiment. In such a scenario, GBP/USD could aim to test the upper boundary of the descending triangle around 1.2565.
GBP/USD: Daily Chart
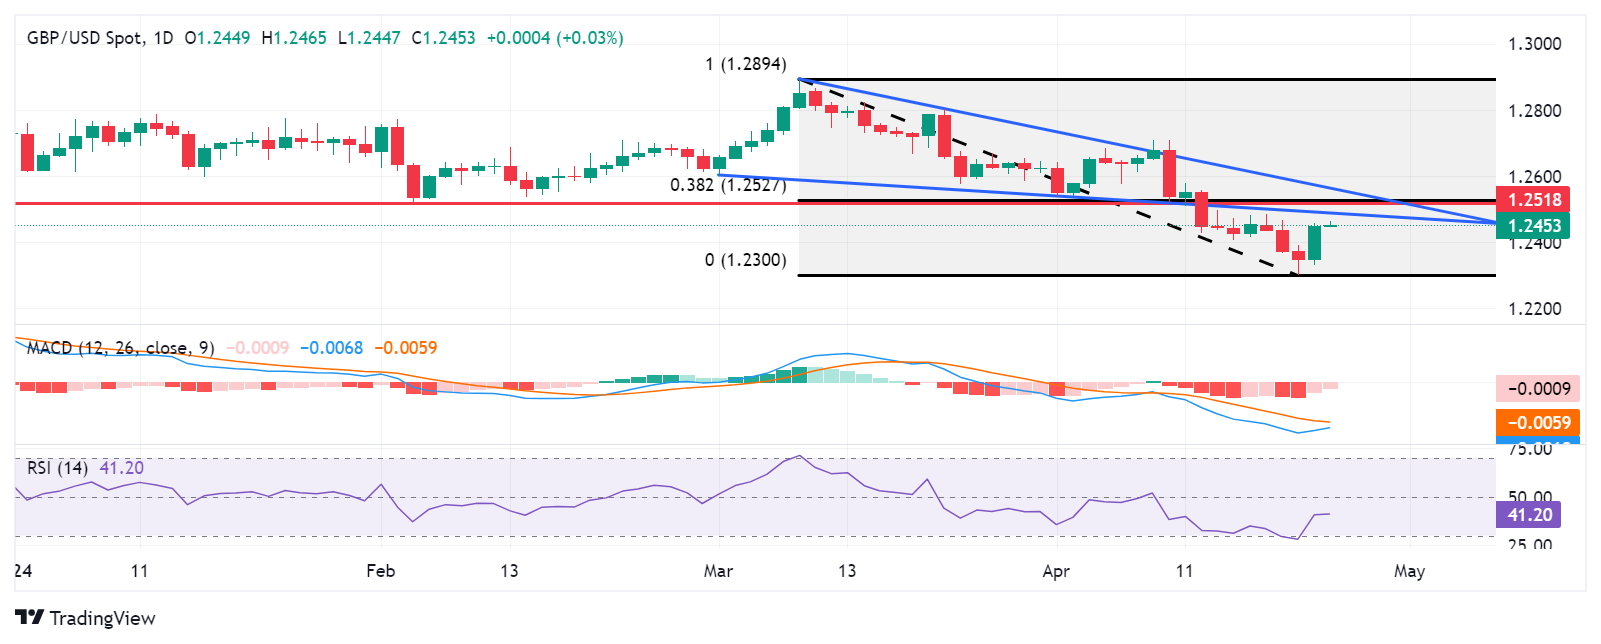
- Gold price lacks follow-through buying and is influenced by a combination of diverging forces.
- Easing geopolitical tensions continue to undermine demand for the safe-haven precious metal.
- Tuesday’s dismal US PMIs weigh on the USD and lend support ahead of the key US macro data.
Gold price (XAU/USD) struggles to capitalize on the previous day's bounce from over a two-week low – levels just below the $2,300 mark – and oscillates in a narrow range during the Asian session on Wednesday. Diminishing fears about a further escalation of tensions in the Middle East turn out to be a key factor that continues to undermine the safe-haven precious metal. Apart from this, growing acceptance that the Federal Reserve (Fed) will keep interest rates higher for longer amid sticky inflation further contributes to capping the upside for the non-yielding yellow metal.
Meanwhile, the US Dollar (USD) languishes near its lowest level in over a week in the wake of Tuesday's disappointing release of the US PMIs, which suggested that the economic upturn lost momentum at the start of the second quarter. This, in turn, is seen lending some support to the Gold price as traders keenly await important US macro data – the Advance Q1 GDP report and the Personal Consumption Expenditures (PCE) Price Index on Thursday and Friday, respectively. In the meantime, the US Durable Goods Orders data might provide some impetus to the XAU/USD later today.
Daily Digest Market Movers: Gold price continues to be undermined by receding safe-haven demand
- Easing concerns over geopolitical tensions in the Middle East remain supportive of a generally positive risk tone and continue to act as a headwind for the safe-haven Gold price.
- Hawkish comments from Federal Reserve officials lifted bets that the US central bank will keep rates higher for longer and further undermined the non-yielding yellow metal.
- The weaker US PMI prints released on Tuesday keep the US Dollar bulls on the defensive near a one-and-half-week low, which is seen lending some support to the commodity.
- The S&P Global Composite Purchasing Managers Index (PMI) fell to 50.9 in April's flash estimate, suggesting that the business activity in the US private sector expanded at a slower pace.
- Meanwhile, the S&P Global Manufacturing PMI unexpectedly dropped into the contraction territory in April, while the gauge for the services sector declined to 50.9 from 51.7 in March.
- Traders also prefer to wait on the sidelines ahead of this week's key US macro data, which might influence the Fed's future policy decision and provide a fresh impetus to the XAU/USD.
- Wednesday's US economic docket features Durable Goods Orders, though the focus remains on the Advance Q1 GDP report and the Personal Consumption Expenditures (PCE) Price Index.
Technical Analysis: Gold price needs to find acceptance below $2,300 for bears to seize control
From a technical perspective, the XAU/USD showed some resilience below the 23.6% Fibonacci retracement level of the February-April rally. The subsequent bounce, along with the fact that oscillators on the daily chart are still holding in the positive territory, warrants some caution for bearish traders. Hence, it will be prudent to wait for acceptance below the $2,300 mark before positioning for deeper losses. The Gold price might then slide to the $2,260-2,255 area, or the 38.2% Fibo. level, en route to the $2,225 intermediate support and the $2,200-2,190 confluence, comprising the 50% Fibo. level and the 50-day Simple Moving Average (SMA).
On the flip side, any further move up is more likely to confront stiff resistance and remain capped near the $2,350-2,355 region. The next relevant hurdle is pegged near the $2,380 supply zone, which is followed by the $2,400 mark and the all-time peak, near the $2,431-2,432 area. A sustained strength beyond the latter will be seen as a fresh trigger for bullish traders and set the stage for an extension of the recent blowout rally witnessed over the past two months or so.
Gold FAQs
Gold has played a key role in human’s history as it has been widely used as a store of value and medium of exchange. Currently, apart from its shine and usage for jewelry, the precious metal is widely seen as a safe-haven asset, meaning that it is considered a good investment during turbulent times. Gold is also widely seen as a hedge against inflation and against depreciating currencies as it doesn’t rely on any specific issuer or government.
Central banks are the biggest Gold holders. In their aim to support their currencies in turbulent times, central banks tend to diversify their reserves and buy Gold to improve the perceived strength of the economy and the currency. High Gold reserves can be a source of trust for a country’s solvency. Central banks added 1,136 tonnes of Gold worth around $70 billion to their reserves in 2022, according to data from the World Gold Council. This is the highest yearly purchase since records began. Central banks from emerging economies such as China, India and Turkey are quickly increasing their Gold reserves.
Gold has an inverse correlation with the US Dollar and US Treasuries, which are both major reserve and safe-haven assets. When the Dollar depreciates, Gold tends to rise, enabling investors and central banks to diversify their assets in turbulent times. Gold is also inversely correlated with risk assets. A rally in the stock market tends to weaken Gold price, while sell-offs in riskier markets tend to favor the precious metal.
The price can move due to a wide range of factors. Geopolitical instability or fears of a deep recession can quickly make Gold price escalate due to its safe-haven status. As a yield-less asset, Gold tends to rise with lower interest rates, while higher cost of money usually weighs down on the yellow metal. Still, most moves depend on how the US Dollar (USD) behaves as the asset is priced in dollars (XAU/USD). A strong Dollar tends to keep the price of Gold controlled, whereas a weaker Dollar is likely to push Gold prices up.
- USD/CAD faces challenges due to improved risk sentiment, driven by easing geopolitical tensions in the Middle East.
- The US Dollar lost ground after the release of downbeat US PMI data released on Tuesday.
- The Canadian Dollar receives support from the uptick in crude Oil prices.
USD/CAD continues its losing streak that began on April 17, trading around 1.3660 during the Asian session on Wednesday. The pair receives downward pressure due to the downbeat US Dollar (USD), which could be attributed to the disappointing Purchasing Managers Index (PMI) data from the United States (US) released on Tuesday.
In April, the preliminary S&P Global Composite PMI for the US declined to 50.9 from the previous reading of 52.1. Additionally, the Manufacturing PMI fell to 49.9 from 51.9 in the previous reading, below the estimated 52.0. Similarly, the Services PMI decreased to 50.9, compared to the prior 51.7, falling short of the expected 52.0.
In Canada, the uptick in crude Oil prices contributes upward support to the Canadian Dollar (CAD), given the fact that Canada is the largest crude Oil exporter to the United States (US). West Texas Intermediate (WTI) Oil price trades around $83.20 per barrel, by the press time.
Crude Oil prices have advanced following industry data indicating an unexpected decrease in US crude stocks last week, signaling positive demand dynamics. Attention has shifted away from tensions in the Middle East. The American Petroleum Institute (API) reported a 3.23 million barrels decline in weekly crude Oil stocks for the week ending April 19, contrary to the expected increase of 1.80 million barrels and the previous week's increase of 4.09 million barrels.
Canadian Industrial Product Price Index rose by 0.8% in March, in line with expectations and slightly lower than the previous month's upwardly revised figure of 1.1%. Additionally, the New Housing Price Index remained unchanged in March, against forecasts of a 0.1% increase, with the year-over-year NHPI declining by 0.4%. Investors will keep an eye on Canadian Retail Sales data due on Wednesday.
- Indian Rupee trades on a softer note on Wednesday on USD demand.
- The positive outlook for the Indian economy might support the INR and cap the pair’s upside.
- Investors will focus on the US March Durable Goods Orders, which are due on Wednesday.
Indian Rupee (INR) is losing its recovery momentum on Wednesday amid US Dollar (USD) demand from importers and bets that US Federal Reserve (Fed) rate cuts are not imminent. Nonetheless, the positive cues from local equities and the optimistic outlook in the Indian economy might boost the INR and limit the pair’s upside in the near term. India's business activity continued to strengthen in April and expanded at its fastest pace in nearly 14 years, owing to strong demand, according to a survey released on Tuesday. The report suggested India is well positioned to be the fastest-growing major economy this year after impressive growth in recent quarters.
The US March Durable Goods Orders are due on Wednesday. Later this week, market participants will keep an eye on the US preliminary Gross Domestic Product (GDP) Annualized for the first quarter, which is estimated to grow 2.5% in Q1. On Friday, the final reading of the US March Personal Consumption Expenditures Price Index (PCE) will be in the spotlight.
Daily Digest Market Movers: Indian Rupee remains weak despite the positive economic outlook
- India’s HSBC Manufacturing Purchasing Managers Index (PMI) came in at 59.1 in April, compared to 59.1 in March. The Services PMI figure rose to 61.7 from the previous reading of 61.2.
- “Strong performance in both the manufacturing and service sectors, led by increased new orders, resulted in the highest composite output index since June 2010," said HSBC chief India economist, Pranjul Bhandari.
- The US flash S&P Global Composite PMI fell to 50.9 in April from the previous reading of 52.1, indicating US business activity continued to expand in April, albeit at a softer pace than in March.
- The US S&P Global Manufacturing PMI dropped to 49.9 in April from 51.9 in the previous reading, weaker than the estimation of 52.0. The Services PMI decreased to 50.9, compared to 51.7 prior, worse than the 52.0 expected.
- US New Home Sales rose 8.8% MoM to a seasonally adjusted annual rate of 693,000 units in March, the highest level since September 2023.
Technical analysis: USD/INR’s longer-term bullish trend remains intact
The Indian Rupee trades weaker on the day. The bullish vibe of USD/INR remains unchanged on the daily chart as the pair remains above the key 100-day Exponential Moving Average (EMA). However, the 14-day Relative Strength Index (RSI) holds below the 50.00 midline, indicating further consolidation or downside cannot be ruled out before positioning for any near-term USD/INR appreciation.
Looking at the bright side, the immediate resistance level for the pair is seen at 83.50 (high of April 15). Further north, the next upside target will emerge at 83.72 (an all-time high), en route to 84.00 (round figure). On the flip side, the initial contention level for USD/INR is located in the 83.10–83.15 region, portraying the confluence of the 100-day EMA and a low of April 10. Any follow-through selling will pave the way to 82.78 (low of January 15), followed by 82.65 (low of March 16).
US Dollar price today
The table below shows the percentage change of US Dollar (USD) against listed major currencies today. US Dollar was the strongest against the Japanese Yen.
| USD | EUR | GBP | CAD | AUD | JPY | NZD | CHF | |
| USD | -0.06% | -0.07% | -0.01% | -0.54% | 0.03% | -0.20% | 0.01% | |
| EUR | 0.06% | 0.00% | 0.05% | -0.47% | 0.09% | -0.10% | 0.05% | |
| GBP | 0.07% | -0.01% | 0.06% | -0.46% | 0.09% | -0.10% | 0.06% | |
| CAD | 0.01% | -0.06% | -0.04% | -0.52% | 0.04% | -0.16% | 0.00% | |
| AUD | 0.53% | 0.45% | 0.44% | 0.51% | 0.54% | 0.33% | 0.51% | |
| JPY | -0.04% | -0.10% | -0.10% | -0.04% | -0.56% | -0.18% | -0.04% | |
| NZD | 0.24% | 0.12% | 0.12% | 0.15% | -0.34% | 0.21% | 0.18% | |
| CHF | 0.00% | -0.05% | -0.07% | 0.00% | -0.51% | 0.04% | -0.17% |
The heat map shows percentage changes of major currencies against each other. The base currency is picked from the left column, while the quote currency is picked from the top row. For example, if you pick the Euro from the left column and move along the horizontal line to the Japanese Yen, the percentage change displayed in the box will represent EUR (base)/JPY (quote).
Indian Rupee FAQs
The Indian Rupee (INR) is one of the most sensitive currencies to external factors. The price of Crude Oil (the country is highly dependent on imported Oil), the value of the US Dollar – most trade is conducted in USD – and the level of foreign investment, are all influential. Direct intervention by the Reserve Bank of India (RBI) in FX markets to keep the exchange rate stable, as well as the level of interest rates set by the RBI, are further major influencing factors on the Rupee.
The Reserve Bank of India (RBI) actively intervenes in forex markets to maintain a stable exchange rate, to help facilitate trade. In addition, the RBI tries to maintain the inflation rate at its 4% target by adjusting interest rates. Higher interest rates usually strengthen the Rupee. This is due to the role of the ‘carry trade’ in which investors borrow in countries with lower interest rates so as to place their money in countries’ offering relatively higher interest rates and profit from the difference.
Macroeconomic factors that influence the value of the Rupee include inflation, interest rates, the economic growth rate (GDP), the balance of trade, and inflows from foreign investment. A higher growth rate can lead to more overseas investment, pushing up demand for the Rupee. A less negative balance of trade will eventually lead to a stronger Rupee. Higher interest rates, especially real rates (interest rates less inflation) are also positive for the Rupee. A risk-on environment can lead to greater inflows of Foreign Direct and Indirect Investment (FDI and FII), which also benefit the Rupee.
Higher inflation, particularly, if it is comparatively higher than India’s peers, is generally negative for the currency as it reflects devaluation through oversupply. Inflation also increases the cost of exports, leading to more Rupees being sold to purchase foreign imports, which is Rupee-negative. At the same time, higher inflation usually leads to the Reserve Bank of India (RBI) raising interest rates and this can be positive for the Rupee, due to increased demand from international investors. The opposite effect is true of lower inflation.
- The Australian Dollar appreciates after the release of stronger-than-expected CPI data released on Wednesday.
- The Australian Dollar receives upward support due to the improved risk appetite, along with the higher ASX 200 Index.
- The US Dollar faced challenges after the downbeat PMI data was released on Tuesday.
The Australian Dollar (AUD) extends its winning streak for the third successive day after the release of the better-than-expected Consumer Price Index (CPI) data on Wednesday. The upbeat inflation figures have the potential to fuel a hawkish sentiment regarding the Reserve Bank of Australia’s (RBA) monetary policy outlook. This has contributed to the strength of the Australian Dollar (AUD), thereby supporting the AUD/USD pair.
The Australian Dollar (AUD) advances, tracking the higher ASX 200 Index, with notable contributions from the technology and healthcare sectors. Australian stocks are mirroring the positive momentum observed on Wall Street, driven by strong corporate earnings reports that have bolstered market sentiment.
The US Dollar Index (DXY), gauging the US Dollar (USD) against six major currencies, experiences downward pressure amid a decrease in US Treasury yields. Furthermore, disappointing Purchasing Managers Index (PMI) data from the United States (US) weighed on the US Dollar (USD), thereby supporting the AUD/USD pair. Nevertheless, inflation reports indicate that business activity in the United States continued to expand in April, albeit at a slower pace compared to March.
Daily Digest Market Movers: Australian Dollar appreciates on upbeat consumer inflation data
- Australia’s Consumer Price Index (CPI) rose by 1.0% QoQ in the first quarter of 2024, against the expected 0.8% and 0.6% prior. CPI (YoY) increased by 3.6% compared to the forecasted 3.4% for Q1 and 4.1% prior.
- Australia’s Monthly Consumer Price Index (YoY) rose by 3.5% in March, against the market expectations and the previous reading of 3.4%.
- On Tuesday, the US preliminary S&P Global Composite PMI fell to 50.9 in April from the previous reading of 52.1. Meanwhile, the Manufacturing PMI dropped to 49.9 from 51.9 in the previous reading, weaker than the estimation of 52.0. The Services PMI decreased to 50.9, compared to 51.7 prior, worse than the 52.0 expected.
- Australia's Judo Bank Composite Purchasing Managers Index (PMI) released on Tuesday, showed a surge to a 24-month high of 53.6 in April, marking an improvement from the previous month's 53.3. Manufacturing PMI rose to an eight-month high of 49.9 in April, compared to March's 47.3. Services PMI declined to a 2-month low of 54.2 compared to the previous reading of 54.4.
- The China Securities Journal reported on Tuesday that the People's Bank of China (PBoC) will decrease the Medium-term Lending Facility (MLF) rate, aiming to lower funding costs. The next MLF rate setting is scheduled for May 15. This decision could potentially influence the Australian market, given the close trade relationship between the two countries.
- The likelihood of the Federal Reserve's (Fed) interest rates remaining unchanged in the June meeting has risen to 84.6%, up from the previous week's 82.7%, according to the CME FedWatch Tool.
Technical Analysis: Australian Dollar moves above the psychological level of 0.6500
The Australian Dollar trades around 0.6520 on Wednesday. The pair has breached into the symmetrical triangle, indicating a shift towards bullish sentiment. Furthermore, the 14-day Relative Strength Index (RSI) is above the 50-level, supporting this bullish outlook.
The AUD/USD pair may aim for the psychological level of 0.6600 and attempt to reach the upper boundary of the symmetrical triangle near 0.6639, potentially reinforcing the bullish sentiment.
In terms of the downside, immediate support is anticipated around the psychological level of 0.6500, aligned with the lower boundary of the triangle. A breach below this channel could exert downward pressure on the AUD/USD pair, with the next significant support level at 0.6456. Further support is located at April’s low of 0.6362.
AUD/USD: Daily Chart
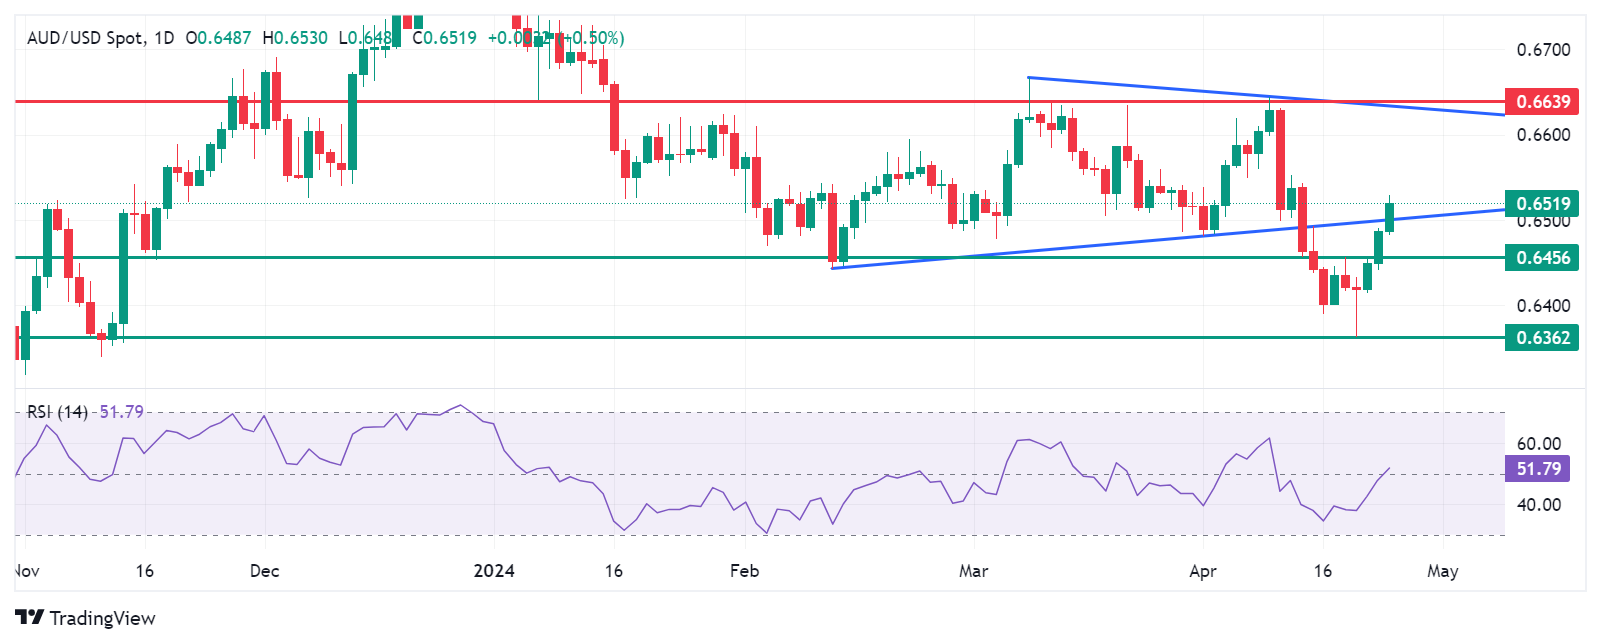
Australian Dollar price today
The table below shows the percentage change of the Australian Dollar (AUD) against listed major currencies today. The Australian Dollar was the strongest against the US Dollar.
| USD | EUR | GBP | CAD | AUD | JPY | NZD | CHF | |
| USD | -0.08% | -0.05% | -0.01% | -0.45% | 0.04% | -0.13% | 0.00% | |
| EUR | 0.07% | 0.02% | 0.06% | -0.36% | 0.11% | -0.07% | 0.04% | |
| GBP | 0.05% | -0.02% | 0.05% | -0.38% | 0.09% | -0.08% | 0.04% | |
| CAD | 0.01% | -0.06% | -0.05% | -0.43% | 0.05% | -0.13% | -0.01% | |
| AUD | 0.45% | 0.34% | 0.38% | 0.41% | 0.41% | 0.30% | 0.42% | |
| JPY | -0.05% | -0.13% | -0.08% | -0.04% | -0.48% | -0.13% | -0.05% | |
| NZD | 0.16% | 0.07% | 0.10% | 0.12% | -0.30% | 0.13% | 0.13% | |
| CHF | 0.01% | -0.04% | -0.04% | 0.00% | -0.42% | 0.07% | -0.12% |
The heat map shows percentage changes of major currencies against each other. The base currency is picked from the left column, while the quote currency is picked from the top row. For example, if you pick the Euro from the left column and move along the horizontal line to the Japanese Yen, the percentage change displayed in the box will represent EUR (base)/JPY (quote).
Australian Dollar FAQs
One of the most significant factors for the Australian Dollar (AUD) is the level of interest rates set by the Reserve Bank of Australia (RBA). Because Australia is a resource-rich country another key driver is the price of its biggest export, Iron Ore. The health of the Chinese economy, its largest trading partner, is a factor, as well as inflation in Australia, its growth rate and Trade Balance. Market sentiment – whether investors are taking on more risky assets (risk-on) or seeking safe-havens (risk-off) – is also a factor, with risk-on positive for AUD.
The Reserve Bank of Australia (RBA) influences the Australian Dollar (AUD) by setting the level of interest rates that Australian banks can lend to each other. This influences the level of interest rates in the economy as a whole. The main goal of the RBA is to maintain a stable inflation rate of 2-3% by adjusting interest rates up or down. Relatively high interest rates compared to other major central banks support the AUD, and the opposite for relatively low. The RBA can also use quantitative easing and tightening to influence credit conditions, with the former AUD-negative and the latter AUD-positive.
China is Australia’s largest trading partner so the health of the Chinese economy is a major influence on the value of the Australian Dollar (AUD). When the Chinese economy is doing well it purchases more raw materials, goods and services from Australia, lifting demand for the AUD, and pushing up its value. The opposite is the case when the Chinese economy is not growing as fast as expected. Positive or negative surprises in Chinese growth data, therefore, often have a direct impact on the Australian Dollar and its pairs.
Iron Ore is Australia’s largest export, accounting for $118 billion a year according to data from 2021, with China as its primary destination. The price of Iron Ore, therefore, can be a driver of the Australian Dollar. Generally, if the price of Iron Ore rises, AUD also goes up, as aggregate demand for the currency increases. The opposite is the case if the price of Iron Ore falls. Higher Iron Ore prices also tend to result in a greater likelihood of a positive Trade Balance for Australia, which is also positive of the AUD.
The Trade Balance, which is the difference between what a country earns from its exports versus what it pays for its imports, is another factor that can influence the value of the Australian Dollar. If Australia produces highly sought after exports, then its currency will gain in value purely from the surplus demand created from foreign buyers seeking to purchase its exports versus what it spends to purchase imports. Therefore, a positive net Trade Balance strengthens the AUD, with the opposite effect if the Trade Balance is negative.
- NZD/USD gains positive traction for the third straight day amid a softer USD.
- Tuesday’s disappointing US PMIs and a positive risk tone undermine the buck.
- Reduced Fed rate cut bets should help limit the USD losses and cap the major.
The NZD/USD pair attracts follow-through buying for the third successive day on Wednesday and climbs to over a one-week high, around mid-0.5900s during the Asian session amid a modest US Dollar (USD) weakness.
Weaker US PMI prints released on Tuesday indicated that the economic upturn lost momentum at the start of the second quarter. Furthermore, easing geopolitical tensions in the Middle East remains supportive of a generally positive tone around the equity markets and undermines the safe-haven buck, which, in turn, is seen benefitting the risk-sensitive Kiwi. That said, hawkish Federal Reserve (Fed) expectations help limit the downside for the USD and keep a lid on the NZD/USD pair.
Market participants now seem convinced that the Fed is unlikely to begin its rate-cutting cycle in June and have also scaled back their expectations about the total number of rate cuts in 2024 to less than two, or around 40 basis points. The hawkish outlook, meanwhile, remains supportive of elevated US Treasury bond yields and is likely to act as a tailwind for the Greenback. This, in turn, might hold back traders from placing aggressive bullish bets around the NZD/USD pair and cap the upside.
Investors now look forward to the release of the US Durable Goods Orders for some impetus later during the North American session. The focus, however, will remain glued to the Advance US Q1 GDP print and the US Personal Consumption Expenditures (PCE) Price Index on Thursday and Friday, respectively. This will influence market expectations about the Fed's future policy decisions, which will drive the USD demand and help in determining the near-term trajectory for the NZD/USD pair.
| Raw materials | Closed | Change, % |
|---|---|---|
| Silver | 27.283 | 0.29 |
| Gold | 2321.72 | -0.37 |
| Palladium | 1019.41 | 1.13 |
- AUD/JPY gains ground due to the stronger-than-expected Australian consumer inflation data.
- The ASX 200 Index appreciates, primarily fueled by advancements in technology and healthcare stocks.
- The Japanese Yen faces challenges as the yield gap widens between Japan and other major countries.
AUD/JPY extends its winning streak for the third successive day after paring intraday losses on Wednesday. Additionally, the Australian Bureau of Statistics (ABS) released the better-than-expected Consumer Price Index (CPI) data on Wednesday, guiding the outlook for the Reserve Bank of Australia’s (RBA) monetary policy. This has bolstered the Australian Dollar (AUD), consequently, underpinning the AUD/JPY cross.
The Australian Dollar (AUD) receives upward support due to the improved risk appetite, along with the higher ASX 200 Index, particularly driven by gains in technology and healthcare stocks. Australian shares followed the positive trend seen on Wall Street, buoyed by robust corporate earnings reports, which have lifted market sentiment. Additionally, diminishing tensions in the Middle East have contributed to a positive market atmosphere.
The Japanese Yen (JPY) encounters difficulties due to the widening yield gap between Japan and numerous other major countries, leading traders to borrow JPY and seek higher yields in other assets. Despite this trend, intervention by Japanese authorities to buy Yen has not yet occurred. With the Bank of Japan (BoJ) commencing its two-day policy meeting on Thursday, Tokyo may refrain from intervening in the currency market until at least next week.
Daily Digest Market Movers: AUD/JPY appreciates on stronger CPI, risk-on mood
- Australia’s Consumer Price Index (CPI) rose by 1.0% QoQ in the first quarter of 2024, against the expected 0.8% and 0.6% prior. CPI (YoY) increased by 3.6% compared to the forecasted 3.4% for Q1 and 4.1% prior.
- Australia’s Monthly Consumer Price Index (YoY) rose by 3.5% in March, against the market expectations and the previous reading of 3.4%.
- On Tuesday, Australia's Judo Bank Composite Purchasing Managers Index (PMI) showed a surge to a 24-month high of 53.6 in April, marking an improvement from the previous month's 53.3. Manufacturing PMI rose to an eight-month high of 49.9 in April, compared to March's 47.3. Services PMI declined to a 2-month low of 54.2 compared to the previous reading of 54.4.
- Japan’s Jibun Bank Manufacturing PMI improved to 49.9 in April as data showed on Tuesday, compared to the expected reading of 48.0 and 48.2 prior. Meanwhile, Services PMI rose to 54.6 from the previous reading of 54.1.
- Reuters reported that Bank of Japan (BoJ) Governor Kazuo Ueda reiterated on Tuesday that the central bank would raise interest rates again if trend inflation accelerates toward its 2% target, in line with its forecast. Ueda also said that it is hard to predict in advance the ideal timeframe for the Bank of Japan (BoJ) to gather sufficient data before considering a policy change.
- Japan's Finance Minister Shunichi Suzuki stated on Tuesday that last week's trilateral meeting with his counterparts from the US and South Korea likely established a foundation for Tokyo to undertake necessary measures in the foreign exchange market, according to a Reuters report.
- The China Securities Journal reported on Tuesday that the People's Bank of China (PBoC) will decrease the Medium-term Lending Facility (MLF) rate, aiming to lower funding costs. The next MLF rate setting is scheduled for May 15. This decision could potentially influence the Australian market, given the close trade relationship between the two countries.
Technical Analysis: AUD/JPY rises to the psychological level of 101.00
The AUD/JPY trades around 100.90 on Wednesday. The currency cross moves above April’s high of 100.81. The daily ascending channel, coupled with the 14-day Relative Strength Index (RSI) reacting above the 50 level, indicates a strengthening bullish sentiment. The immediate barrier appears at the psychological level of 101.00. A breakthrough above this level could prompt the AUD/JPY cross to test the upper boundary of the ascending channel at 101.50.
On the downside, the AUD/JPY cross could find key support at the major level of 100.50. A break below this level could lead the currency cross to the support level of 99.65, followed by the lower boundary of the ascending channel around the level of 99.00.
AUD/JPY: Daily Chart
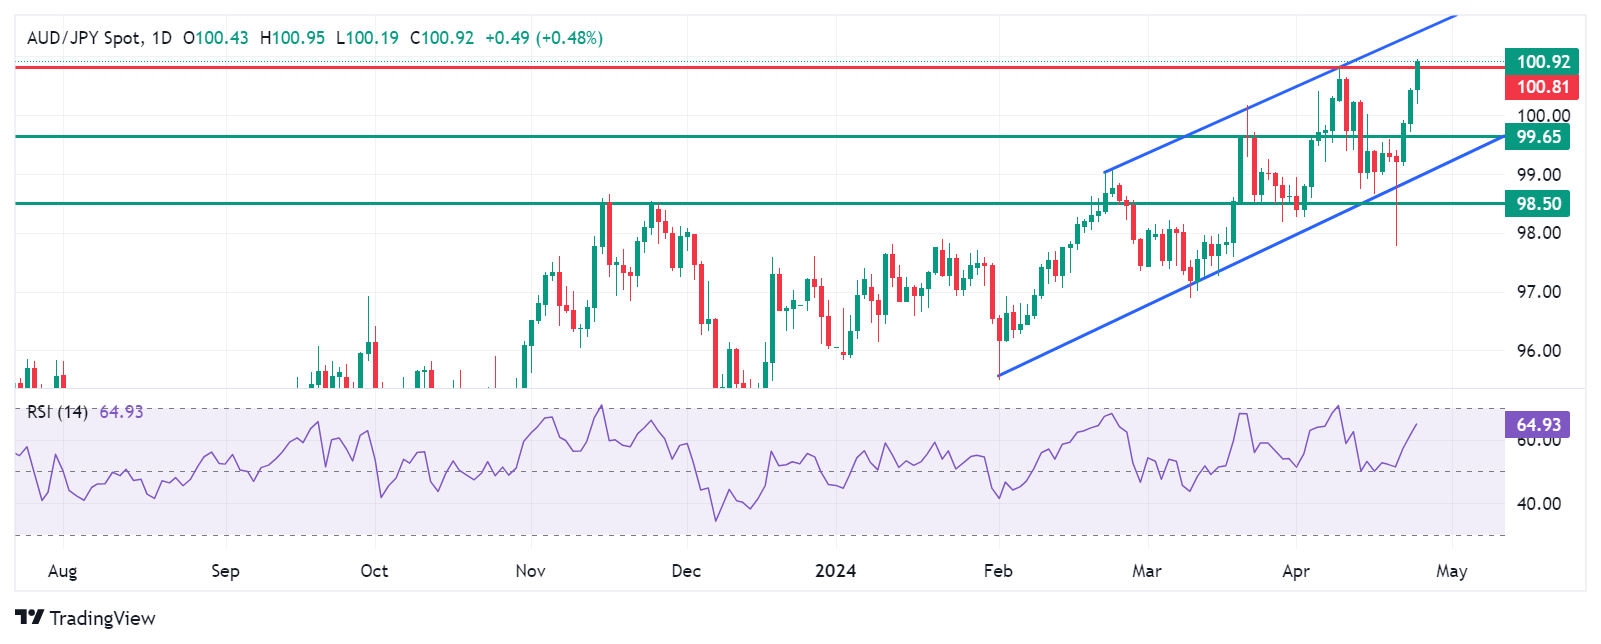
Australian Dollar price today
The table below shows the percentage change of Canadian Dollar (CAD) against listed major currencies today. Canadian Dollar was the strongest against the Canadian Dollar.
| USD | EUR | GBP | CAD | AUD | JPY | NZD | CHF | |
| USD | -0.05% | -0.05% | 0.00% | -0.56% | 0.03% | -0.10% | -0.01% | |
| EUR | 0.05% | -0.01% | 0.04% | -0.49% | 0.08% | -0.08% | 0.01% | |
| GBP | 0.05% | 0.01% | 0.05% | -0.48% | 0.09% | -0.08% | 0.03% | |
| CAD | 0.01% | -0.04% | -0.05% | -0.54% | 0.04% | -0.13% | -0.02% | |
| AUD | 0.53% | 0.45% | 0.48% | 0.54% | 0.53% | 0.40% | 0.51% | |
| JPY | -0.04% | -0.09% | -0.10% | -0.04% | -0.57% | -0.12% | -0.06% | |
| NZD | 0.13% | 0.09% | 0.09% | 0.12% | -0.45% | 0.13% | 0.13% | |
| CHF | 0.02% | -0.01% | -0.03% | 0.02% | -0.52% | 0.07% | -0.11% |
The heat map shows percentage changes of major currencies against each other. The base currency is picked from the left column, while the quote currency is picked from the top row. For example, if you pick the Euro from the left column and move along the horizontal line to the Japanese Yen, the percentage change displayed in the box will represent EUR (base)/JPY (quote).
Australian Dollar FAQs
One of the most significant factors for the Australian Dollar (AUD) is the level of interest rates set by the Reserve Bank of Australia (RBA). Because Australia is a resource-rich country another key driver is the price of its biggest export, Iron Ore. The health of the Chinese economy, its largest trading partner, is a factor, as well as inflation in Australia, its growth rate, and Trade Balance. Market sentiment – whether investors are taking on more risky assets (risk-on) or seeking safe havens (risk-off) – is also a factor, with risk-on positive for AUD.
The Reserve Bank of Australia (RBA) influences the Australian Dollar (AUD) by setting the level of interest rates that Australian banks can lend to each other. This influences the level of interest rates in the economy as a whole. The main goal of the RBA is to maintain a stable inflation rate of 2-3% by adjusting interest rates up or down. Relatively high interest rates compared to other major central banks support the AUD, and the opposite for relatively low. The RBA can also use quantitative easing and tightening to influence credit conditions, with the former AUD-negative and the latter AUD-positive.
China is Australia’s largest trading partner so the health of the Chinese economy is a major influence on the value of the Australian Dollar (AUD). When the Chinese economy is doing well it purchases more raw materials, goods and services from Australia, lifting demand for the AUD, and pushing up its value. The opposite is the case when the Chinese economy is not growing as fast as expected. Positive or negative surprises in Chinese growth data, therefore, often have a direct impact on the Australian Dollar and its pairs.
Iron Ore is Australia’s largest export, accounting for $118 billion a year according to data from 2021, with China as its primary destination. The price of Iron Ore, therefore, can be a driver of the Australian Dollar. Generally, if the price of Iron Ore rises, AUD also goes up, as aggregate demand for the currency increases. The opposite is the case if the price of Iron Ore falls. Higher Iron Ore prices also tend to result in a greater likelihood of a positive Trade Balance for Australia, which is also positive of the AUD.
The Trade Balance, which is the difference between what a country earns from its exports versus what it pays for its imports, is another factor that can influence the value of the Australian Dollar. If Australia produces highly sought after exports, then its currency will gain in value purely from the surplus demand created from foreign buyers seeking to purchase its exports versus what it spends to purchase imports. Therefore, a positive net Trade Balance strengthens the AUD, with the opposite effect if the Trade Balance is negative.
- The Japanese Yen fails to lure buyers in the wake of the divergent BoJ-Fed policy expectations.
- A positive risk tone also undermines the JPY, though intervention fears help limit further losses.
- Traders also seem reluctant ahead of this week’s key central bank event risk and US macro data.
The Japanese Yen (JPY) continues with its struggle to register any meaningful recovery and languishes near a multi-decade low against its American counterpart during the Asian session on Wednesday. Traders now seem reluctant and opt to wait for the crucial Bank of Japan (BoJ) policy decision on Friday. Apart from this, investors this week will confront the release of the Advance Q1 GDP report and the Personal Consumption Expenditures (PCE) Price Index from the US on Thursday and Friday, respectively. The combination of key central bank event risk and important US macro data will play a key role in determining the next leg of a directional move for the USD/JPY pair.
In the meantime, expectations that the gap in interest rates between the US and Japan will stay wide, along with a generally positive risk tone, continue to undermine the safe-haven JPY. However, speculations that Japanese authorities will intervene to prop up the domestic currency hold back the JPY bears from placing aggressive bets. Furthermore, the US Dollar (USD) hangs near its lowest level in over a week touched in the aftermath of disappointing US PMIs on Tuesday and turns out to be another factor that contributes to capping the USD/JPY pair. That said, hawkish Federal Reserve (Fed) expectations should act as a tailwind for the buck and limit the downside for the currency pair.
Daily Digest Market Movers: Japanese Yen seems vulnerable amid BoJ’s uncertainty rate outlook
- The Bank of Japan's cautious approach, indicating that accommodative financial conditions will be maintained for an extended period, fails to assist the Japanese Yen in registering any meaningful recovery from a multi-decade low.
- Hopes that the Iran-Israel conflict will not escalate further ease geopolitical tensions in the Middle East and remain supportive of a generally positive risk tone, which turns out to be another factor undermining the safe-haven JPY.
- The JPY bulls shrugged off a survey by the Finance Ministry, showing that about 70% of companies in Japan will raise pay scale in the fiscal year 2024 and that about 40% of firms were struggling with labor shortages even after raising wages.
- The recent verbal warnings from Japanese officials that they would intervene in the markets to stem any further weakness in the domestic currency hold back bearish traders from placing fresh bets and help limit deeper losses.
- Investors keenly await the outcome of the highly-anticipated two-day BoJ policy meeting on Friday for cues on when the central bank will raise interest rates again, which, in turn, will determine the near-term trajectory for the JPY.
- The US Dollar is pressured by weaker US PMI figures for April released on Tuesday, indicating that the economic upturn lost momentum at the start of the second quarter, and contributes to keeping a lid on the USD/JPY pair.
- The S&P Global Composite Purchasing Managers Index (PMI) fell to 50.9 in April's flash estimate, suggesting that the business activity in the US private sector continued to expand, albeit at a softer pace than in the previous month.
- Meanwhile, the S&P Global Manufacturing PMI dropped to 49.9 from 51.9 in April, highlighting a contraction in business activity, while the gauge for the services sector declined to 50.9 from March's final reading of 51.7.
- Investors, however, seem convinced that the Federal Reserve is unlikely to begin its rate-cutting cycle in June and have also scaled back their expectations about the total number of rate cuts in 2024 to less than two.
- Traders now look to Wednesday's release of the US Durable Goods Orders, though the focus remains on the Advance Q1 GDP and the Personal Consumption Expenditures (PCE) Price Index on Thursday and Friday, respectively.
Technical Analysis: USD/JPY might consolidate further amid overbought RSI on the daily chart
From a technical perspective, the range-bound price action witnessed over the past week or so could be categorized as a bullish consolidation phase against the backdrop of the recent blowout rally from the March swing low. However, the Relative Strength Index (RSI) on the daily chart is flashing overbought conditions and warrants some caution.
This, in turn, suggests that the USD/JPY pair is more likely to extend its consolidative price move or witness a modest pullback before the next leg up. That said, any meaningful corrective slide is likely to find decent support near the 154.55-154.45 region ahead of the 154.00 mark. The latter should act as a key pivotal point, which if broken could drag spot prices back towards last Friday's low, around the 153.60-153.55 area.
On the flip side, the multi-decade high, just ahead of the 155 psychological mark, might continue to offer some resistance to the USD/JPY pair. A sustained strength beyond the latter will be seen as a fresh trigger for bullish traders and set the stage for an extension of a nearly two-month-old upward trajectory.
Japanese Yen FAQs
The Japanese Yen (JPY) is one of the world’s most traded currencies. Its value is broadly determined by the performance of the Japanese economy, but more specifically by the Bank of Japan’s policy, the differential between Japanese and US bond yields, or risk sentiment among traders, among other factors.
One of the Bank of Japan’s mandates is currency control, so its moves are key for the Yen. The BoJ has directly intervened in currency markets sometimes, generally to lower the value of the Yen, although it refrains from doing it often due to political concerns of its main trading partners. The current BoJ ultra-loose monetary policy, based on massive stimulus to the economy, has caused the Yen to depreciate against its main currency peers. This process has exacerbated more recently due to an increasing policy divergence between the Bank of Japan and other main central banks, which have opted to increase interest rates sharply to fight decades-high levels of inflation.
The BoJ’s stance of sticking to ultra-loose monetary policy has led to a widening policy divergence with other central banks, particularly with the US Federal Reserve. This supports a widening of the differential between the 10-year US and Japanese bonds, which favors the US Dollar against the Japanese Yen.
The Japanese Yen is often seen as a safe-haven investment. This means that in times of market stress, investors are more likely to put their money in the Japanese currency due to its supposed reliability and stability. Turbulent times are likely to strengthen the Yen’s value against other currencies seen as more risky to invest in.
On Wednesday, the People’s Bank of China (PBoC) set the USD/CNY central rate for the trading session ahead at 7.1048 as compared to the previous day's fix of 7.1059 and 7.2363 Reuters estimates.
A survey by the Finance Ministry showed on Monday that about 70% of companies in Japan will raise pay scale in fiscal year 2024, per Japan Times.
Additional takeaways
“The proportion of companies planning to raise their pay scales stood at 70.7%, up by 6.3 percentage points from the previous year.”
“Companies at which pay-scale hikes and regular pay increases will total 5% or more came to 36.5%, nearly doubling from the previous year.”
“50.2% of small and medium-sized firms said that they had been unable to pass on rising labor costs in their product and service prices.”
“The survey also showed that about 40% of firms were struggling with labor shortages even after raising wages.”
Market reaction
At the time of press, the USD/JPY pair was down 0.03% on the day at 154.80.
Japanese Yen FAQs
The Japanese Yen (JPY) is one of the world’s most traded currencies. Its value is broadly determined by the performance of the Japanese economy, but more specifically by the Bank of Japan’s policy, the differential between Japanese and US bond yields, or risk sentiment among traders, among other factors.
One of the Bank of Japan’s mandates is currency control, so its moves are key for the Yen. The BoJ has directly intervened in currency markets sometimes, generally to lower the value of the Yen, although it refrains from doing it often due to political concerns of its main trading partners. The current BoJ ultra-loose monetary policy, based on massive stimulus to the economy, has caused the Yen to depreciate against its main currency peers. This process has exacerbated more recently due to an increasing policy divergence between the Bank of Japan and other main central banks, which have opted to increase interest rates sharply to fight decades-high levels of inflation.
The BoJ’s stance of sticking to ultra-loose monetary policy has led to a widening policy divergence with other central banks, particularly with the US Federal Reserve. This supports a widening of the differential between the 10-year US and Japanese bonds, which favors the US Dollar against the Japanese Yen.
The Japanese Yen is often seen as a safe-haven investment. This means that in times of market stress, investors are more likely to put their money in the Japanese currency due to its supposed reliability and stability. Turbulent times are likely to strengthen the Yen’s value against other currencies seen as more risky to invest in.
| Index | Change, points | Closed | Change, % |
|---|---|---|---|
| NIKKEI 225 | 113.55 | 37552.16 | 0.3 |
| Hang Seng | 317.24 | 16828.93 | 1.92 |
| KOSPI | -6.42 | 2623.02 | -0.24 |
| ASX 200 | 34.3 | 7683.5 | 0.45 |
| DAX | 276.85 | 18137.65 | 1.55 |
| CAC 40 | 65.42 | 8105.78 | 0.81 |
| Dow Jones | 263.71 | 38503.69 | 0.69 |
| S&P 500 | 59.95 | 5070.55 | 1.2 |
| NASDAQ Composite | 245.33 | 15696.64 | 1.59 |
- EUR/USD hovers around 1.0700 on Wednesday amid the weaker US Dollar.
- The Eurozone flash PMI showed the economy gained recovery momentum in April.
- S&P Global suggested US business activity continue to expand in April, albeit at a softer pace than in March.
The EUR/USD pair holds above the 1.0700 psychological barrier during the early Asian session on Wednesday. The weaker-than-expected US PMI data for April drags the Greenback lower and creates a tailwind for EUR/USD. Investors will take more cues from Germany’s IFO business sentiment index and Expectations, along with the US March Durable Goods Orders.
Overall business activity in the Eurozone expanded at its fastest pace in almost a year in April, with a robust rebound in the bloc's major service sector, according to the HCOB's latest Purchasing Managers Index (PMI) survey released on Tuesday. The HCOB Eurozone PMI Composite improved to 51.4 in April from March’s reading of 50.3, better than the estimation of 50.8. The reading registered the highest level in nine months.
Meanwhile, the bloc’s Services PMI hit a fresh eleven-month high, rising to 52.9 in April from 51.5 in March, beating market expectations of 51.8. The Eurozone Manufacturing PMI came in at 45.6 in April, compared to the 46.1 reading in March, weaker than the 46.5 expected. In response to the data, the Euro (EUR) attracts some buyers against the Greenback. However, the dovish stance of the European Central Bank (ECB) might limit the major pair’s upside.
The ECB policymakers emphasized the need to cut interest rates multiple times this year, even though elevated US inflation delays a pivot to looser policy by the US Federal Reserve (Fed) and tensions in the Middle East keep oil prices high. The ECB President Christine Lagarde suggested that the central bank may cut its deposit rate from a record-high 4% in June, but has kept its options open for further action.
On Tuesday, the US preliminary S&P Global Composite PMI, which tracks both the manufacturing and services sectors, fell to 50.9 in April from the previous reading of 52.1. Meanwhile, the Manufacturing PMI dropped to 49.9 in April from 51.9 in the previous reading, weaker than the estimation of 52.0. The Services PMI decreased to 50.9, compared to 51.7 prior, worse than the 52.0 expected. The reports indicated that business activity in the United States continued to expand in April, albeit at a softer pace than in March. The downbeat data weighs on the US Dollar (USD) and caps the upside of EUR/USD.
| Pare | Closed | Change, % |
|---|---|---|
| AUDUSD | 0.64854 | 0.53 |
| EURJPY | 165.655 | 0.45 |
| EURUSD | 1.07013 | 0.45 |
| GBPJPY | 192.651 | 0.75 |
| GBPUSD | 1.24467 | 0.77 |
| NZDUSD | 0.59319 | 0.19 |
| USDCAD | 1.36617 | -0.26 |
| USDCHF | 0.91155 | -0.03 |
| USDJPY | 154.782 | -0.02 |
FOREIGN EXCHANGE MARKET NEWS
CURRENCY MARKET DEFINITION
The concept of currency market has several definitions:
- Currency market is the sphere of economic relations that are manifested in the purchase and sale of currency values (foreign currency, securities in foreign currency), as well as operations related to the investment of capital in foreign currency;
- Currency market is a financial center where currency purchase and sale transactions based on supply and demand for them are concentrated;
- Curency market is a whole of authorized banks, investment companies, brokerages, exchanges, and foreign banks that perform foreign exchange operations.
- Currency market is a whole of communications systems that link banks in different countries that conduct international currency transactions.
Simply put, currency market is the market where currency transactions are made, that is, the currency of one country is exchanged for the currency of another country at a certain exchange rate. The exchange rate is the relative price of currencies of two countries or the currency of one country expressed in another country's monetary units.
Currency market is part of the global financial market, where many operations related to the global movement of capital take place.
TYPES OF MARKETS. RUSSIAN AND INTERNATIONAL CURRENCY MARKETS
There are international and domestic currency markets.
Domestic currency market — is a market within a single country.
The international currency market — is a global market that covers currency markets of all countries in the world. It does not have a specific site where trading is carried out. All operations within it are carried out through a system of cable and satellite channels that link the world's regional currency markets. Regional markets today include the Asian (with centers in Tokyo, Hong Kong, Singapore, and Melbourne), the European (London, Frankfurt am Main, and Zurich), and the American (New York, Chicago, and Los Angeles) markets.
Currency trading on the international currency market is carried out on the basis of market exchange rates, which are set on the basis of supply and demand in the market and under the influence of various macroeconomic data. Forex is the international currency market.
Currency markets can also be divided into exchange and over-the-counter markets. Exchange currency market is an organized market where trading is carried out through an exchange—a special company that sets trading rules and provides all the conditions for organizing trading under these rules.
Over-the-counter currency market — is a market where there are no certain trading rules, and purchase and sale operations are not linked to a specific place of trade, as opposed to the case of an exchange.
As a rule, an over-the-counter currency market is organized by special companies that provide services for the purchase and sale of currencies, which may or may not be members of the currency exchange. Trading operations in this market are now carried out mainly via the Internet.
The over-the-counter currency market is much larger than the exchange market in terms of trading volume. The Forex international over-the-counter currency market is considered the most liquid in the world. It operates around the clock in all financial centers of the world (from New York to Tokyo).
CURRENCY MARKET FUNCTIONS
Currency market— is the most important platform for ensuring the normal course of all global economic processes.
The main macroeconomic functions of the currency market are:
- creating conditions for the subjects of foreign exchange relations to make timely international current and capital payments and thereby promoting the development of foreign trade;
- providing conditions and mechanisms for the implementation of monetary and economic policy of the state;
- diversifying foreign exchange reserves;
- forming the exchange rate under the influence of supply and demand;
NEWS IMPACT
Various currencies are the main trading tool in the currency market. Exchange rates are formed under the influence of supply and demand in the market.
In addition to that, currency rates are influenced by many fundamental factors related to the global economic situation, events in national economies, and political decisions.
News about these factors can be found in various sources:
- Reports showing a country´s level of economic development.
The more stable an economy is developing, the more stable its currency is. Accordingly, it is possible to predict how the currency will behave in the near future, based on statistical data published in official sources of countries with a certain regularity.
This data includes:
- GDP
- unemployment;
- return on equity;
- consumer price index;
- industrial price index;
- propensity to consume;
- salaries outside of the agricultural sector;
- residential construction, etc.
Interest rate level, set by national authorities regulating credit policy, is an equally important indicator. In the European Union, this is ECB–the European Central Bank, in the US, this is the Federal Reserve System, in Japan—the Bank of Japan, in the UK—the Bank of England, in Switzerland—the Swiss national Bank, etc.
The interest rate level is determined at meetings of the national central bank. Then, the decision on the rate is published in official sources. If the central bank of a country reduces the interest rate, the money supply in the country increases, and the national currency depreciates against other world currencies. If the interest rate increases, the national currency will strengthen.
- Speeches of country leaders, leading economists and analysts.
A speech or even a separate statement by a country's leader can reverse a trend. Speeches on these topics may change the currency exchange rate:
- analysis of the situation on the currency market;
- changes in monetary or economic policy;
- adoption of a budget policy;
- forecasts of the economic situation, etc.
All this news is published in various sources. Major international news is more or less easy to find in Russian, but news related to the domestic economic policy and the economy of foreign countries is much less common in the Russian press. Mostly, such news is published by the national media and in the language of the country where the news is published.
It is very difficult for one person to follow all the news at once, and they are likely to miss some important event that can turn the whole situation on the market upside down. Guided by our main principle—to create the best trading conditions for our customers—we try to select the most important news from all over the world and publish them on our website.
The TeleTRADE Department of Analytics monitors news on most national and international news sources on a daily basis and identifies those that can potentially affect exchange rates. These are the main news items that are included in our news feed.
In addition, all our clients have free access to the Dow Jones news feed. This is a joint project of Dow Jones Newswires, the world's largest news agency, and the leading Russian news agency Prime-TASS. The news feed is created specifically for currency traders and those who are interested in getting information about the world's currency markets.


© 2000-2024. All rights reserved.
This site is managed by Teletrade D.J. LLC 2351 LLC 2022 (Euro House, Richmond Hill Road, Kingstown, VC0100, St. Vincent and the Grenadines).
The information on this website is for informational purposes only and does not constitute any investment advice.
The company does not serve or provide services to customers who are residents of the US, Canada, Iran, The Democratic People's Republic of Korea, Yemen and FATF blacklisted countries.
Making transactions on financial markets with marginal financial instruments opens up wide possibilities and allows investors who are willing to take risks to earn high profits, carrying a potentially high risk of losses at the same time. Therefore you should responsibly approach the issue of choosing the appropriate investment strategy, taking the available resources into account, before starting trading.
Use of the information: full or partial use of materials from this website must always be referenced to TeleTrade as the source of information. Use of the materials on the Internet must be accompanied by a hyperlink to teletrade.org. Automatic import of materials and information from this website is prohibited.
Please contact our PR department if you have any questions or need assistance at pr@teletrade.global.
transfers