- Analytics
- News and Tools
- Market News
Market Trading News and Research from 26 April 2024
FX option expiries for Apr 26 NY cut at 10:00 Eastern Time, via DTCC, can be found below
EUR/USD: EUR amounts
- 1.0600 1.6b
- 1.0610 800m
- 1.0645 2.2b
- 1.0680 814m
- 1.0700 987m
- 1.0750 1.6b
- 1.0780 1.1b
GBP/USD: GBP amounts
- 1.2365 685m
- 1.2430 1.1b
- 1.2500 726m
USD/JPY: USD amounts
- 153.50 672m
- 154.00 712m
- 155.00 1.5b
- 156.50 531m
USD/CHF: USD amounts
- 0.9100 565m
AUD/USD: AUD amounts
- 0.6400 469m
- 0.6500 462m
USD/CAD: USD amounts
- 1.3560 400m
- 1.3775 396m
NZD/USD: NZD amounts
- 0.5940 386m
- 0.6100 605m
- USD/CHF trades in positive territory near 0.9130 on Friday.
- The US economy expanded at the slowest pace in two years, below the consensus.
- The escalating Middle East tensions might boost the safe-haven CHF.
The USD/CHF pair trades on a stronger note around 0.9130 during the early European session on Friday. The modest rebound of the US Dollar (USD) provides some support to the pair. Traders prefer to wait on the sideline ahead of the Swiss National Bank’s (SNB) Chairman Jordan speech, followed by the final reading of the US March Personal Consumption Expenditures Price Index (PCE) on Friday.
The US advance estimate of Gross Domestic Product (GDP) number grew far less than estimated in the first quarter of 2024, according to the Bureau of Economic Analysis on Thursday. The US economy grew at an annualized pace of 1.6% during the period, missing the expectation of 2.5% growth and coming in lower than fourth quarter GDP, which was revised up to 3.4%. The Greenback attracted some sellers after the data was released.
Nonetheless, a surprising upside in the quarterly Personal Consumption Expenditure (PCE) inflation measure suggested that the US Federal Reserve (Fed) would not cut interest rates before September. The PCE figure rose at an annualized rate of 3.4% in Q1, compared to the 1.8% pace recorded in Q4 2023. The recent inflation data dampened the hope for June rate cuts, and investors forecast one cut this year, down from three cuts just a few weeks ago. This, in turn, might cap the downside for the Greenback in the near term.
On the Swiss front, Switzerland’s ZEW Survey Expectations rose to 17.6 in April from the previous reading of 11.5, the Centre for European Economic Research revealed on Wednesday. Furthermore, the rising geopolitical tensions in the Middle East, particularly in Israel and Iran, might boost safe-haven asset flows, benefiting the Swiss Franc (CHF).
Speaking at the post-policy meeting press conference on Friday, Bank of Japan (BoJ) Governor Kazuo Ueda said that the Bank “will adjust the degree of monetary easing if underlying inflation rate rises,” adding that “easy financial conditions will be maintained for the time being.”
The BoJ kept the interest rate on hold at 0% following the April meeting.
Additional quotes
Japan's economy has recovered moderately, although some weakness has been seen.
Must pay due attention to financial, FX market moves, impact on Japan's economy, prices.
Monetary policy conduct depends on future economic, price, financial conditions.
Economic outlook, risk overshoot may also be a reason for policy change.
Monetary policy is not aimed to control FX rates directly.
If FX fluctuations affect underlying inflation, that could be a consideration for monetary policy.
Although main reason for FY2024 inflation outlook upgrade is higher crude price, weak Yen had impact to some extent.
Likelihood of achieving 2% inflation target is gradually rising.
Reduction of JGB buying in future is in sight.
Not want to use reduction of JGB buying as a proactive monetary policy tool.
Will carry out appropriate short-term rate adjustment, taking effect of BoJ’s JGB holding on long-term yield into consideration.
FX's impact on inflation rates is usually tentative.
Chance of prolonged weak Yen is not zero.
We can preemptively judge if weak Yen affects underlying inflation, spring wage talks next year.
No change to JGB buying amount from March.
Future reduction of JGB buying will be decided at policy board.
more to come ....
Market reaction
USD/JPY rises back to test 156.00 following these comments. The pair was last seen 0.25% higher on the day at 156.03.
Bank of Japan FAQs
The Bank of Japan (BoJ) is the Japanese central bank, which sets monetary policy in the country. Its mandate is to issue banknotes and carry out currency and monetary control to ensure price stability, which means an inflation target of around 2%.
The Bank of Japan has embarked in an ultra-loose monetary policy since 2013 in order to stimulate the economy and fuel inflation amid a low-inflationary environment. The bank’s policy is based on Quantitative and Qualitative Easing (QQE), or printing notes to buy assets such as government or corporate bonds to provide liquidity. In 2016, the bank doubled down on its strategy and further loosened policy by first introducing negative interest rates and then directly controlling the yield of its 10-year government bonds.
The Bank’s massive stimulus has caused the Yen to depreciate against its main currency peers. This process has exacerbated more recently due to an increasing policy divergence between the Bank of Japan and other main central banks, which have opted to increase interest rates sharply to fight decades-high levels of inflation. The BoJ’s policy of holding down rates has led to a widening differential with other currencies, dragging down the value of the Yen.
A weaker Yen and the spike in global energy prices have led to an increase in Japanese inflation, which has exceeded the BoJ’s 2% target. Still, the Bank judges that the sustainable and stable achievement of the 2% target has not yet come in sight, so any sudden change in the current policy looks unlikely.
- USD/CAD loses ground due to higher crude Oil prices on Friday.
- WTI Oil price appreciates due to geopolitical risks associated with a potential Israeli invasion of the Rafah city.
- The lower US labor data has offset concerns regarding the sluggish GDP (Q1).
USD/CAD extends its losses for the second consecutive day, trading around 1.3640 during the Asian session on Friday. The Canadian Dollar (CAD) receives support from higher US crude Oil prices, contributing to the weakening of the USD/CAD pair.
West Texas Intermediate (WTI) crude Oil price edges higher to near $83.80 per barrel, supported by potential geopolitical risks stemming from a possible Israeli invasion of the southern Gaza city of Rafah.
On the data front, recent Canadian Retail Sales data for February highlighted economic deceleration. Additionally, domestic annual inflation in Canada stood at 2.9% in March, below expectations, indicating the potential for lower underlying inflation. This scenario may lead the Bank of Canada to consider interest rate cuts, which could limit the gains of the Canadian Dollar.
In contrast, US labor data offset sluggish GDP growth, dampening expectations for Federal Reserve interest rate cuts. The US Gross Domestic Product Annualized (Q1) expanded at a slower pace of 1.6% compared to the previous reading of 3.4%, falling short of market expectations of 2.5%. The slowdown in the US economy suggests potential challenges or deceleration in various sectors. Looking ahead, market attention is now focused on the US Personal Consumption Expenditures (PCE) Price Index data for March, scheduled for release on Friday.
Additionally, the US Initial Jobless Claims for the week ending on April 19 saw a significant decrease, dropping by 5,000 to 207,000. This figure marks the lowest level seen in two months and exceeds both market expectations of 214,000 and the previous reading of 212,000. The unexpected decline in jobless claims indicates a strengthening labor market, implying reduced layoffs and potentially increased hiring activity.
- The core Personal Consumption Expenditures Price Index is set to rise 0.3% MoM and 2.6% YoY in March.
- Markets see a strong chance of the Federal Reserve keeping the policy rate unchanged in June.
- The market reaction to the data could remain short-lived.
The core Personal Consumption Expenditures (PCE) Price Index, the US Federal Reserve’s (Fed) preferred inflation measure, will be published on Friday by the US Bureau of Economic Analysis (BEA) at 12:30 GMT.
What to expect in the Federal Reserve’s preferred PCE inflation report?
The core PCE Price Index, which excludes volatile food and energy prices, is seen as the more influential measure of inflation in terms of Fed positioning. The index is forecast to rise 0.3% on a monthly basis in March, matching February’s increase. March core PCE is also projected to grow at an annual pace of 2.6%, while the headline PCE inflation is forecast to tick up to 2.6% (YoY) from 2.5%.
The Federal Reserve’s revised Summary of Economic Projections (SEP), also known as the dot plot – published alongside the policy statement after the March meeting – showed that policymakers expect the annual core PCE inflation to be at 2.6% at the end of 2024, up from the 2.4% forecast seen in the December’s SEP.
On Thursday, the BEA reported that the core PCE Price Index rose 3.4% on a quarterly basis in the first quarter, at a much stronger pace than the 1.8% increase seen in the last quarter of 2023. The initial market reaction to this data helped the US Dollar (USD) gather strength against its rivals. Since the quarterly figures were already unveiled, markets are likely to pay little to no attention to the monthly PCE inflation numbers.
Previewing the PCE Price Index data, “another firm increase in March CPI inflation will likely result in a still firm 0.25% m/m gain for the core PCE — though we flag that the risk to our forecast is to the upside,” said TD Securities analysts in a weekly report and added:
“The PCE's supercore likely rebounded to 0.30% m/m after a modest 0.18% gain in February. Separately, personal spending likely ended the quarter on a strong note, expanding again at a solid pace in March.”
When will the PCE inflation report be released, and how could it affect EUR/USD?
The PCE inflation data is slated for release at 12:30 GMT. The monthly core PCE Price Index gauge is the most-preferred inflation reading by the Fed, as it’s not distorted by base effects and provides a clear view of underlying inflation by excluding volatile items. Investors, therefore, pay close attention to the monthly core PCE figure.
The CME Group FedWatch Tool shows that markets are currently pricing in a higher-than-80% probability that the Fed will leave the policy rate unchanged at 5.25%-5.5% in June. Monthly PCE data for March, however, are unlikely to influence the market expectation in a significant way, especially following the release of the quarterly data. Nevertheless, in case the monthly core PCE Price Index rises less than forecast, the immediate reaction could trigger a short-lasting USD weakness. On the other hand, the market positioning suggests that there isn’t a lot of room left for further USD strength if the data surprise to the upside.
FXStreet Analyst Eren Sengezer offers a brief technical outlook for EUR/USD and explains:
“The 200-day Simple Moving Average (SMA) and the 50-day SMA form a strong resistance for EUR/USD at 1.0800. As long as this level stays intact as resistance, technical sellers could look to retain control. On the downside, 1.0650 (static level) aligns as interim support before next support at 1.0600 (2024 low set on April 16). In case EUR/USD manages to stabilize above 1.0800, buyers could remain interested and open the door for an extended rebound toward 1.0900 (psychological level, static level) and 1.0950 (static level from March).
Economic Indicator
Personal Consumption Expenditures - Price Index (YoY)
The Personal Consumption Expenditures (PCE), released by the US Bureau of Economic Analysis on a monthly basis, measures the changes in the prices of goods and services purchased by consumers in the United States (US). The YoY reading compares prices in the reference month to a year earlier. Price changes may cause consumers to switch from buying one good to another and the PCE Deflator can account for such substitutions. This makes it the preferred measure of inflation for the Federal Reserve. Generally, a high reading is bullish for the US Dollar (USD), while a low reading is bearish.
Read more.Last release: Fri Mar 29, 2024 12:30
Frequency: Monthly
Actual: 2.5%
Consensus: 2.5%
Previous: 2.4%
Source: US Bureau of Economic Analysis
US Dollar FAQs
The US Dollar (USD) is the official currency of the United States of America, and the ‘de facto’ currency of a significant number of other countries where it is found in circulation alongside local notes. It is the most heavily traded currency in the world, accounting for over 88% of all global foreign exchange turnover, or an average of $6.6 trillion in transactions per day, according to data from 2022. Following the second world war, the USD took over from the British Pound as the world’s reserve currency. For most of its history, the US Dollar was backed by Gold, until the Bretton Woods Agreement in 1971 when the Gold Standard went away.
The most important single factor impacting on the value of the US Dollar is monetary policy, which is shaped by the Federal Reserve (Fed). The Fed has two mandates: to achieve price stability (control inflation) and foster full employment. Its primary tool to achieve these two goals is by adjusting interest rates. When prices are rising too quickly and inflation is above the Fed’s 2% target, the Fed will raise rates, which helps the USD value. When inflation falls below 2% or the Unemployment Rate is too high, the Fed may lower interest rates, which weighs on the Greenback.
In extreme situations, the Federal Reserve can also print more Dollars and enact quantitative easing (QE). QE is the process by which the Fed substantially increases the flow of credit in a stuck financial system. It is a non-standard policy measure used when credit has dried up because banks will not lend to each other (out of the fear of counterparty default). It is a last resort when simply lowering interest rates is unlikely to achieve the necessary result. It was the Fed’s weapon of choice to combat the credit crunch that occurred during the Great Financial Crisis in 2008. It involves the Fed printing more Dollars and using them to buy US government bonds predominantly from financial institutions. QE usually leads to a weaker US Dollar.
Quantitative tightening (QT) is the reverse process whereby the Federal Reserve stops buying bonds from financial institutions and does not reinvest the principal from the bonds it holds maturing in new purchases. It is usually positive for the US Dollar.
- NZD/USD remains steady due to risk appetite improvements for risk-sensitive currencies.
- The gains of the US Dollar could be limited due to the lower US Treasury yields.
- New Zealand’s ANZ-Roy Morgan Consumer Confidence decreased to 82.1 in April, reaching its lowest level since 2008.
The NZD/USD pair showed positive movement, trading around 0.5960 during the Asian session on Friday. The New Zealand Dollar (NZD), known for its sensitivity to risk sentiment, gained momentum as risk appetite improved, supporting the NZD/USD pair. However, the pair trimmed some of its intraday gains due to a rebound in the US Dollar (USD).
The US Dollar Index (DXY), which measures the USD against six major currencies, edges up to near 105.70, although its gains may be limited by a downward correction in US Treasury yields, contributing to the USD's weakness.
On Thursday, mixed preliminary data from the United States (US) put pressure on the Greenback. The US Gross Domestic Product Annualized (Q1) expanded at a slower pace of 1.6% compared to the previous reading of 3.4%, falling short of market expectations of 2.5%. This slowdown suggests potential headwinds or slowdowns in various sectors of the economy.
However, US consumer prices have shown resilience, with the Personal Consumption Expenditures (QoQ) Price Index for Q1 increasing at a 3.7% annual rate. This exceeded both market expectations of 3.4% and the previous reading of 2.0%, indicating prevailing inflationary pressures that could influence Federal Reserve (Fed) monetary policy decisions.
On the Kiwi's side, Friday's ANZ-Roy Morgan Consumer Confidence slipped to 82.1 in April, from the previous reading of 86.4. This has marked its lowest level since 2008. Despite this decline, New Zealand's consumer confidence remains relatively elevated. Additionally, Stats NZ reported a trade surplus in March, driven by exports reaching a 10-month high while imports fell to a 2-month low. The decrease in imports reflects a sluggish economy, as both households and businesses grapple with the impact of high interest rates.
Looking ahead, market attention is now focused on the US Personal Consumption Expenditures (PCE) Price Index data for March, slated for release on Friday. This data is expected to garner significant interest from investors as they assess its implications for inflationary pressures and potential effects on US monetary policy.
- EUR/USD meets with some supply amid the emergence of some USD buying on Friday.
- Bets that the Fed will keep rates higher for longer amid sticky inflation underpin the USD.
- Traders, however, seem reluctant and look to the US PCE Price Index for a fresh impetus.
The EUR/USD pair edges lower during the Asian session on Friday and moves away from a two-week high, around the 1.0740 area touched the previous day. Spot prices currently trade around the 1.0725-1.0720 region and remain at the mercy of the US Dollar (USD) price dynamics ahead of the crucial US data.
The US Personal Consumption Expenditures (PCE) Price Index data is due for release later during the North American session and will be looked upon for cues about the Federal Reserve's (Fed) rate cut path. This, in turn, will play a key role in influencing the near-term USD price dynamics. In the meantime, growing acceptance that the US central bank will keep interest rates higher for longer lends some support to the Greenback and exerts some downward pressure on the EUR/USD pair.
Investors have pushed back their expectations about the timing of the first rate cut by the Fed to September. The bets were reaffirmed by data released on Thursday, which showed that the underlying inflation rose more than expected in the first quarter. This helps offset a deceleration in the economic growth to a 1.6% annualized rate during the January-March quarter – marking the weakest reading since mid-2022 – and keeps the US Treasury bond yields elevated, underpinning the USD.
Apart from this, bets that the European Central Bank (ECB) will start cutting interest rates in June, amid a faster-than-anticipated fall in the Eurozone inflation, suggests that the path of least resistance for the EUR/USD pair is to the downside. That said, it will still be prudent to wait for strong follow-through selling before confirming that the recent recovery from the 1.0600 mark, or the YTD low has run its course traders await the key US inflation data.
- EUR/JPY gains ground near 167.20 amid the weaker JPY on Friday.
- The BoJ kept interest rates steady around zero on Friday.
- ECB’s Nagel said he would be in favor of a rate cut in June.
The EUR/JPY cross drifts higher to 167.20, its highest level since 2008, during the Asian trading hours on Friday. The uptick of the cross is supported by the weaker Japanese Yen (JPY) after the Bank of Japan (BoJ) announced its policy decision.
The Bank of Japan (BoJ) board members decided to leave the key interest rate unchanged at 0% at its April policy meeting on Friday, as widely expected. The Japanese central bank hiked rates for the first time since 2007 in its March meeting, ending Japan’s negative interest rate era that began in 2016.
Furthermore, the BoJ provided new forecasts predicting that inflation would remain close to its 2% target over the next three years, indicating that it is prepared to raise borrowing rates later this year. The central bank added it would continue to purchase government bonds in accordance with guidance decided in March to acquire around 6 trillion yen ($38.45 billion) per month. Following the meeting, the Japanese Yen (JPY) attracts some sellers against the Euro (EUR).
The recent consumer inflation in Tokyo declined sharply in April. The Statistics Bureau of Japan reported on Friday that the headline Tokyo Consumer Price Index (CPI) for April rose 1.8% YoY, compared to the previous reading of a 2.6% rise. Meanwhile, the Tokyo CPI ex Fresh Food, Energy increased 1.8% YoY versus 2.7% expected and the previous reading of 2.9% rise. The softer inflation in Tokyo also weighs on the safe-haven JPY.
On the Euro front, European Central Bank (ECB) policymaker Joachim Nagel said on Wednesday that he would be in favor of a rate cut in June, adding that such a step would not necessarily be followed by a series of rate cuts. The ECB’s Fabio Panetta said small interest rate cuts will stem the risk of prolonged economic stagnation in the euro area.
- Gold price lacks any firm intraday direction and is influenced by a combination of diverging forces.
- The weaker US GDP print and a rise in US inflation benefit the metal amid subdued USD demand.
- Hawkish Fed expectations cap the upside as traders await the release of the US PCE Price Index.
Gold price (XAU/USD) struggles to capitalize on the previous day's modest gains and oscillates in a narrow range during the Asian session on Friday amid mixed fundamental cues. The US GDP report released on Thursday pointed to a significant loss of growth momentum at the start of 2024 and an unwelcome pickup in inflation. This, along with the subdued US Dollar (USD) price action, acts as a tailwind for the precious metal, which is considered as a hedge against inflation. The upside, however, remains capped in the wake of hawkish Federal Reserve (Fed) expectations.
Investors seem convinced that the US central bank will keep interest rates higher for longer amid sticky inflation. This remains supportive of elevated US Treasury bond yields and lends support to the Greenback. Apart from this, a positive tone around the equity markets further contributes to keeping a lid on the safe-haven Gold price. Traders also seem reluctant and prefer to wait for the release of the US Personal Consumption Expenditures (PCE) Price Index for cues about the Fed's rate-cut path, which should determine the next leg of a directional move for the XAU/USD.
Daily Digest Market Movers: Gold price traders await more cues about the Fed’s rate-cut path before placing directional bets
- The US GDP report released on Thursday showed a sharp deceleration in economic growth and stubborn inflation, which, in turn, is seen as a key factor lending support to the Gold price.
- According to the data published by the US Commerce Department, the world’s largest economy grew by 1.6% at an annualized rate in the first quarter, marking the weakest reading since mid-2022.
- Additional details of the report revealed that underlying inflation rose more than expected, by 3.7%, in the first quarter, reaffirming bets that the Federal Reserve will keep rates higher for longer.
- The yield on the benchmark 10-year US government bond shot to the highest level in more than five months in reaction to the mixed data and acts as a headwind for the non-yielding yellow metal.
- This, along with easing fears about a further escalation of geopolitical tensions in the Middle East, undermines the safe-haven precious metal and should contribute to capping the upside.
- The US Dollar bulls, meanwhile, prefer to wait for more cues about the Fed’s rate cut path, putting the focus squarely on the release of the Personal Consumption Expenditures (PCE) Price Index.
- The crucial inflation data will play a key role in influencing the Fed’s future policy decisions and driving the USD demand, which should help in determining the near-term trajectory for the commodity.
Technical Analysis: Gold price consolidates in a range, $2,300 holds the key for bulls and should act as a strong base
From a technical perspective, the XAU/USD, so far, has been struggling to make it through the 100-period Simple Moving Average (SMA) on the daily chart. The said barrier is currently pegged near the $2,345 region and should now act as a key pivotal point amid mixed oscillators on the daily chart. Meanwhile, a sustained strength beyond will be seen as a fresh trigger for bullish traders and lift the Gold price to the next relevant hurdle near the $2,371-2,372 region. The subsequent move up could extend further towards the $2,400 round figure en route to the all-time peak, around the $2,431-2,432 area touched earlier this month.
On the flip side, bearish traders are likely to wait for some follow-through selling and acceptance below the $2,300 mark before placing fresh bets. The Gold price might then extend the corrective decline further towards the $2,260-2,255 intermediate support before eventually dropping to the $2,225 area and the $2,200-2,190 region, representing the 50-day Simple Moving Average (SMA).
Gold FAQs
Gold has played a key role in human’s history as it has been widely used as a store of value and medium of exchange. Currently, apart from its shine and usage for jewelry, the precious metal is widely seen as a safe-haven asset, meaning that it is considered a good investment during turbulent times. Gold is also widely seen as a hedge against inflation and against depreciating currencies as it doesn’t rely on any specific issuer or government.
Central banks are the biggest Gold holders. In their aim to support their currencies in turbulent times, central banks tend to diversify their reserves and buy Gold to improve the perceived strength of the economy and the currency. High Gold reserves can be a source of trust for a country’s solvency. Central banks added 1,136 tonnes of Gold worth around $70 billion to their reserves in 2022, according to data from the World Gold Council. This is the highest yearly purchase since records began. Central banks from emerging economies such as China, India and Turkey are quickly increasing their Gold reserves.
Gold has an inverse correlation with the US Dollar and US Treasuries, which are both major reserve and safe-haven assets. When the Dollar depreciates, Gold tends to rise, enabling investors and central banks to diversify their assets in turbulent times. Gold is also inversely correlated with risk assets. A rally in the stock market tends to weaken Gold price, while sell-offs in riskier markets tend to favor the precious metal.
The price can move due to a wide range of factors. Geopolitical instability or fears of a deep recession can quickly make Gold price escalate due to its safe-haven status. As a yield-less asset, Gold tends to rise with lower interest rates, while higher cost of money usually weighs down on the yellow metal. Still, most moves depend on how the US Dollar (USD) behaves as the asset is priced in dollars (XAU/USD). A strong Dollar tends to keep the price of Gold controlled, whereas a weaker Dollar is likely to push Gold prices up.
- The Australian Dollar remains firmer due to the hawkish sentiment surrounding RBA’s rate trajectory.
- The Australian Dollar gains in response to the Aussie 10-year yield hitting a 21-week high of 4.59%.
- The rebound of the US Dollar could be attributed to a shift in market sentiment toward risk-off.
The Australian Dollar (AUD) continues its upward trend for the fifth consecutive session on Friday. The Australian Dollar (AUD) gains momentum against the US Dollar (USD) amid growing support for a hawkish stance from the Reserve Bank of Australia (RBA). This sentiment is strengthened by the reassessment by TD Securities, pushing back the anticipated rate cut by the RBA to February 2025 from November.
The Australian Dollar strengthened further on the back of rising yields in Australian government bonds, with the 10-year yield hitting a 21-week high of 4.59%. This surge is attributed to the recent release of Australia's Consumer Price Index (CPI) data on Wednesday, which surpassed expectations and triggered a hawkish sentiment surrounding the RBA.
The US Dollar Index (DXY), which measures the performance of the US Dollar (USD) against six major currencies, rebounds, potentially influenced by a shift toward risk-off sentiment. However, this gain could be limited due to the downward correction in US Treasury yields, which contributed to the weakening of the Greenback.
Despite mixed preliminary data released from the United States (US) on Thursday, including higher-than-expected Core Personal Consumption Expenditures and lower-than-expected Gross Domestic Product Annualized for the first quarter, the US Dollar remained subdued.
Market attention now turns to the US Personal Consumption Expenditures (PCE) Price Index data for March, scheduled for release on Friday. This data is anticipated to draw significant focus as investors gauge its implications for inflationary pressures and potential impacts on US monetary policy.
Daily Digest Market Movers: Australian Dollar appreciates due to the hawkish RBA
- In the first quarter, the US Gross Domestic Product Annualized (Q1) expanded at a slower pace, growing by 1.6% compared to the previous reading of 3.4%. This figure fell short of market expectations, which anticipated a growth rate of 2.5%. The deceleration in GDP growth suggests potential headwinds or slowdowns in various sectors of the economy.
- US consumer prices have demonstrated resilience, with the latest data indicating that the Personal Consumption Expenditures (QoQ) Price Index for Q1 increased at a 3.7% annual rate. This surpassed both market expectations of 3.4% and the previous reading of 2.0%. The persistent upward movement in consumer prices may indicate ongoing inflationary pressures, which could influence monetary policy decisions by the Federal Reserve.
- The US Initial Jobless Claims for the week ending on April 19 experienced a significant decrease, falling by 5,000 to 207,000. This figure marks the lowest level seen in two months and surpasses both market expectations of 214,000 and the previous reading of 212,000. This unexpected decline in jobless claims indicates a strengthening labor market, suggesting reduced layoffs and potentially increased hiring activity.
- According to the CME FedWatch Tool, the likelihood of the Federal Reserve's (Fed) interest rates remaining unchanged in the June meeting has risen to 85.2%, up from Wednesday’s 83.5%.
- Luci Ellis, the chief economist at Westpac and former Assistant Governor (Economic) at the Reserve Bank of Australia, notes that inflation slightly exceeded expectations in the March quarter. Westpac anticipates that the Board will keep interest rates unchanged in May and has adjusted their forecasted date for the first rate cut from September to November this year.
- In March, the Consumer Price Index (CPI) indicator in Australia rose to 3.5% YoY. While this figure exceeded expectations of 3.4%, it represented the highest level in four months. The uptick was primarily driven by faster increases in housing and transport prices.
- Excluding volatile items and travel, the monthly Australian CPI indicator climbed to 4.1% in March, up from a 3.9% gain in February. Despite this rise, inflation continues to remain outside the Reserve Bank of Australia's target range of 2-3%, indicating ongoing challenges in achieving the desired level of price stability.
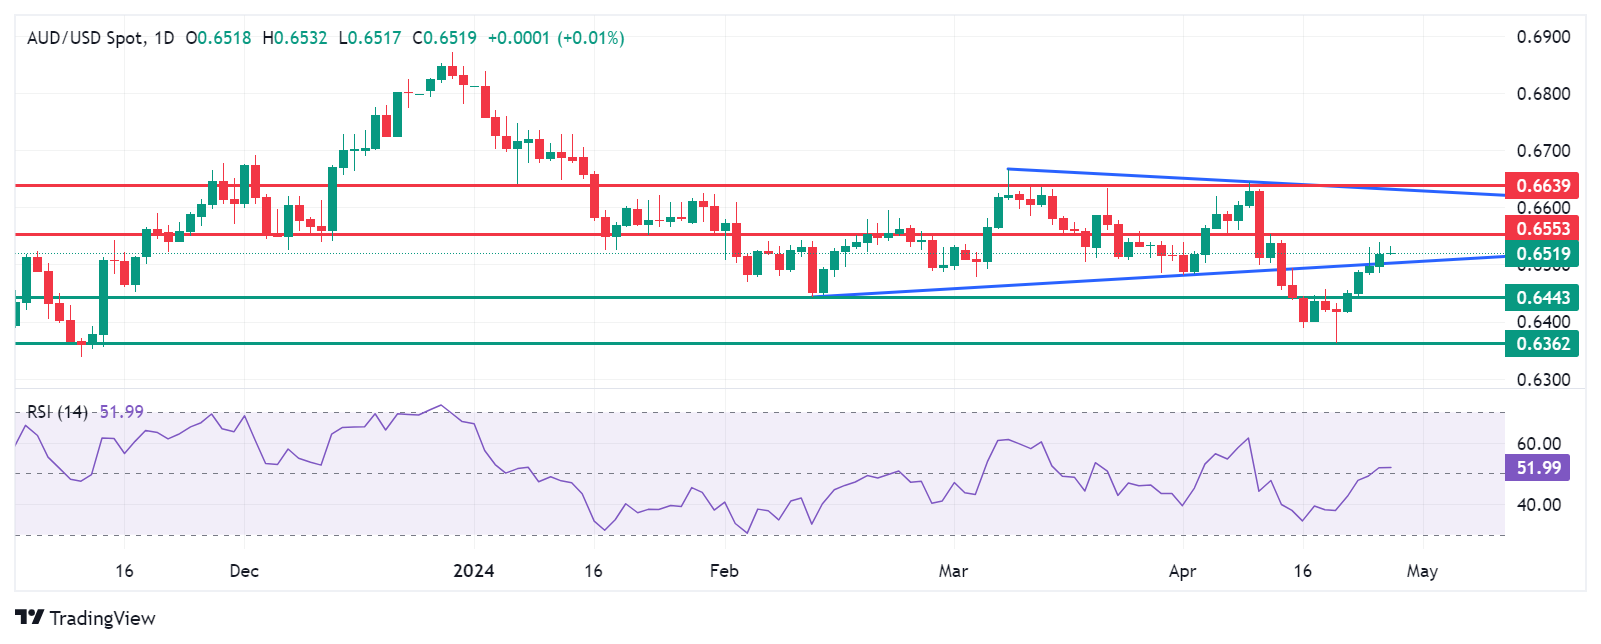
Technical Analysis: Australian Dollar holds position above 0.6500
The Australian Dollar trades around 0.6520 on Friday. The pair has breached into a symmetrical triangle pattern, with the 14-day Relative Strength Index (RSI) above the 50-level, supporting this bullish outlook.
The AUD/USD pair could target the pullback resistance at the level of 0.6553. A breakthrough above the latter could lead the pair to approach the psychological level of 0.6600 and aim for the triangle's upper boundary near 0.6639.
On the downside, immediate support is expected around the psychological level of 0.6500. A break below this level may lead to further downside momentum, with the next significant support region around 0.6443, following further support at April’s low of 0.6362.
AUD/USD: Daily Chart
Australian Dollar price this week
The table below shows the percentage change of the Australian Dollar (AUD) against listed major currencies this week. The Australian Dollar was the strongest against the Japanese Yen.
| USD | EUR | GBP | CAD | AUD | JPY | NZD | CHF | |
| USD | -0.59% | -0.99% | -0.60% | -1.47% | 0.90% | -0.93% | 0.24% | |
| EUR | 0.59% | -0.40% | -0.01% | -0.88% | 1.48% | -0.34% | 0.83% | |
| GBP | 0.98% | 0.40% | 0.39% | -0.49% | 1.87% | 0.05% | 1.22% | |
| CAD | 0.60% | 0.01% | -0.38% | -0.86% | 1.49% | -0.33% | 0.84% | |
| AUD | 1.45% | 0.88% | 0.49% | 0.88% | 2.33% | 0.53% | 1.71% | |
| JPY | -0.91% | -1.49% | -1.90% | -1.51% | -2.38% | -1.84% | -0.66% | |
| NZD | 0.91% | 0.35% | -0.06% | 0.34% | -0.54% | 1.80% | 1.18% | |
| CHF | -0.24% | -0.84% | -1.24% | -0.84% | -1.73% | 0.66% | -1.18% |
The heat map shows percentage changes of major currencies against each other. The base currency is picked from the left column, while the quote currency is picked from the top row. For example, if you pick the Euro from the left column and move along the horizontal line to the Japanese Yen, the percentage change displayed in the box will represent EUR (base)/JPY (quote).
Australian Dollar FAQs
One of the most significant factors for the Australian Dollar (AUD) is the level of interest rates set by the Reserve Bank of Australia (RBA). Because Australia is a resource-rich country another key driver is the price of its biggest export, Iron Ore. The health of the Chinese economy, its largest trading partner, is a factor, as well as inflation in Australia, its growth rate and Trade Balance. Market sentiment – whether investors are taking on more risky assets (risk-on) or seeking safe-havens (risk-off) – is also a factor, with risk-on positive for AUD.
The Reserve Bank of Australia (RBA) influences the Australian Dollar (AUD) by setting the level of interest rates that Australian banks can lend to each other. This influences the level of interest rates in the economy as a whole. The main goal of the RBA is to maintain a stable inflation rate of 2-3% by adjusting interest rates up or down. Relatively high interest rates compared to other major central banks support the AUD, and the opposite for relatively low. The RBA can also use quantitative easing and tightening to influence credit conditions, with the former AUD-negative and the latter AUD-positive.
China is Australia’s largest trading partner so the health of the Chinese economy is a major influence on the value of the Australian Dollar (AUD). When the Chinese economy is doing well it purchases more raw materials, goods and services from Australia, lifting demand for the AUD, and pushing up its value. The opposite is the case when the Chinese economy is not growing as fast as expected. Positive or negative surprises in Chinese growth data, therefore, often have a direct impact on the Australian Dollar and its pairs.
Iron Ore is Australia’s largest export, accounting for $118 billion a year according to data from 2021, with China as its primary destination. The price of Iron Ore, therefore, can be a driver of the Australian Dollar. Generally, if the price of Iron Ore rises, AUD also goes up, as aggregate demand for the currency increases. The opposite is the case if the price of Iron Ore falls. Higher Iron Ore prices also tend to result in a greater likelihood of a positive Trade Balance for Australia, which is also positive of the AUD.
The Trade Balance, which is the difference between what a country earns from its exports versus what it pays for its imports, is another factor that can influence the value of the Australian Dollar. If Australia produces highly sought after exports, then its currency will gain in value purely from the surplus demand created from foreign buyers seeking to purchase its exports versus what it spends to purchase imports. Therefore, a positive net Trade Balance strengthens the AUD, with the opposite effect if the Trade Balance is negative.
- Indian Rupee trades on a positive note on the weaker USD on Friday.
- The uptick in INR is bolstered by interbank USD sales and easing Middle East tensions.
- The final reading of the US March Personal Consumption Expenditures Price Index (PCE) will be the highlight on Friday.
Indian Rupee (INR) extends the rally on Friday, bolstered by interbank US Dollar (USD) sales. The softer USD against key rivals overseas and easing geopolitical tensions in the Middle East also supported the local currency. However, the recovery in crude oil prices and foreign capital outflows might weigh on the INR. Additionally, a hawkish repricing of US Federal Reserve (Fed) rate cut expectations amid elevated inflation will continue to boost the USD and cap the pair’s downside.
Market players will keep an eye on the final reading of the US March Personal Consumption Expenditures Price Index (PCE), which might offer some hints about the inflation trajectory in the US and point to the Federal Reserve's (Fed) next move. Apart from this, India’s general election, which started on 19 April and will run until 1 June, will be closely watched.
Daily Digest Market Movers: Indian Rupee remains firm amid global challenges
- The Indian Rupee was the least volatile major currency among its emerging market peers and a few advanced economies in the financial year 2023–24, according to the Monthly Economic Review report of the Department of Economic Affairs under the Ministry of Finance.
- The report added that India’s foreign exchange reserves reached an all-time high in March 2024, sufficient to cover 11 months of projected imports and more than 100% of total external debt.
- The first estimate of US Gross Domestic Product (GDP) grew by 1.6% on an annualized basis in the first quarter (Q1) of 2024, compared to a 3.4% growth in Q4 2023, below the market consensus of 2.5%.
- The US Personal Consumption Expenditures Prices (PCE) rose at an annualized rate of 3.4% in Q1, nearly double the 1.8% pace recorded in Q4 2023.
- HSBC analysts expect the Fed to leave its policy rate unchanged in May and said that economic growth and core inflation data in the coming months will likely impact policy in June and beyond.
Technical analysis: USD/INR maintains a constructive outlook in the longer term
The Indian Rupee trades stronger on the day. The positive outlook of USD/INR remains unchanged on the daily chart as the pair is above the key 100-day Exponential Moving Average (EMA). However, the 14-day Relative Strength Index (RSI) holds in bearish territory around 48.00, suggesting the potential decline cannot be ruled out.
The first downside target of USD/INR will emerge near the confluence of the 100-day EMA and a low of April 10 in the 83.10–83.15 region. A decisive break below this level will see a drop to a low of January 15 at 82.78, followed by a low of March 16 at 82.65. On the upside, the immediate resistance level is seen near a high of April 15 at 83.50. Further north, the next hurdle is located near an all-time high of 83.72, en route to the 84.00 psychological level.
US Dollar price today
The table below shows the percentage change of US Dollar (USD) against listed major currencies today. US Dollar was the weakest against the New Zealand Dollar.
| USD | EUR | GBP | CAD | AUD | JPY | NZD | CHF | |
| USD | 0.04% | 0.04% | -0.03% | -0.03% | -0.04% | -0.06% | 0.02% | |
| EUR | -0.02% | -0.01% | -0.05% | -0.08% | -0.06% | -0.10% | -0.01% | |
| GBP | -0.04% | 0.00% | -0.05% | -0.09% | -0.08% | -0.12% | -0.01% | |
| CAD | 0.02% | 0.05% | 0.05% | -0.04% | 0.00% | -0.07% | 0.04% | |
| AUD | 0.03% | 0.09% | 0.09% | 0.04% | 0.04% | -0.03% | 0.08% | |
| JPY | 0.04% | 0.07% | 0.07% | 0.02% | 0.00% | -0.03% | 0.06% | |
| NZD | 0.06% | 0.12% | 0.12% | 0.08% | 0.03% | 0.04% | 0.11% | |
| CHF | -0.01% | 0.01% | 0.01% | -0.04% | -0.07% | -0.05% | -0.09% |
The heat map shows percentage changes of major currencies against each other. The base currency is picked from the left column, while the quote currency is picked from the top row. For example, if you pick the Euro from the left column and move along the horizontal line to the Japanese Yen, the percentage change displayed in the box will represent EUR (base)/JPY (quote).
Indian Rupee FAQs
The Indian Rupee (INR) is one of the most sensitive currencies to external factors. The price of Crude Oil (the country is highly dependent on imported Oil), the value of the US Dollar – most trade is conducted in USD – and the level of foreign investment, are all influential. Direct intervention by the Reserve Bank of India (RBI) in FX markets to keep the exchange rate stable, as well as the level of interest rates set by the RBI, are further major influencing factors on the Rupee.
The Reserve Bank of India (RBI) actively intervenes in forex markets to maintain a stable exchange rate, to help facilitate trade. In addition, the RBI tries to maintain the inflation rate at its 4% target by adjusting interest rates. Higher interest rates usually strengthen the Rupee. This is due to the role of the ‘carry trade’ in which investors borrow in countries with lower interest rates so as to place their money in countries’ offering relatively higher interest rates and profit from the difference.
Macroeconomic factors that influence the value of the Rupee include inflation, interest rates, the economic growth rate (GDP), the balance of trade, and inflows from foreign investment. A higher growth rate can lead to more overseas investment, pushing up demand for the Rupee. A less negative balance of trade will eventually lead to a stronger Rupee. Higher interest rates, especially real rates (interest rates less inflation) are also positive for the Rupee. A risk-on environment can lead to greater inflows of Foreign Direct and Indirect Investment (FDI and FII), which also benefit the Rupee.
Higher inflation, particularly, if it is comparatively higher than India’s peers, is generally negative for the currency as it reflects devaluation through oversupply. Inflation also increases the cost of exports, leading to more Rupees being sold to purchase foreign imports, which is Rupee-negative. At the same time, higher inflation usually leads to the Reserve Bank of India (RBI) raising interest rates and this can be positive for the Rupee, due to increased demand from international investors. The opposite effect is true of lower inflation.
| Raw materials | Closed | Change, % |
|---|---|---|
| Silver | 27.404 | 0.88 |
| Gold | 2331.4 | 0.59 |
| Palladium | 986.13 | -1.19 |
- AUD/JPY extends its winning streak after the lower-than-expected Tokyo CPI data released on Friday.
- The Australian 10-year Government Bond Yield has reached a 21-week high of 4.59%.
- Tokyo CPI has fallen below the Bank of Japan's (BoJ) 2% target for the second time this year.
AUD/JPY extends its winning streak for the fifth consecutive session on Friday. The Australian Dollar (AUD) finds support from increasing bids for a hawkish stance for the Reserve Bank of Australia’s (RBA) monetary policy. The revision by TD Securities indicates a delay in the expected rate cut by the Reserve Bank of Australia (RBA) until February 2025 instead of November. This boosts the Australian Dollar (AUD) and consequently supports the AUD/JPY cross.
Australia’s Consumer Price Index (CPI) data on Wednesday, surpassing expectations, is also playing a role in an increase in Australian government bond yields as traders price out expectations regarding interest rate cuts by the RBA in 2024. The Australian 10-year Government Bond Yield has reached a 21-week high of 4.59%, indicating a significant upward trend.
The Japanese Yen (JPY) depreciated following the release of Japan's Tokyo Consumer Price Index (CPI), which came in well below expectations early Friday. This print marks the second time this year that inflation has fallen below the Bank of Japan's (BoJ) 2% target, reducing pressure on the central bank to raise interest rates again. As a result, market sentiment is shifting towards the expectation that the BoJ will abstain from implementing rate hikes during its meeting on Friday.
Daily Digest Market Movers: AUD/JPY gains ground after weaker Tokyo’s CPI data
- Tokyo Consumer Price Index rose 1.8% YoY in April, well below the previous print of 2.6%. Markets were broadly expecting Tokyo inflation to hold steady over the period. The Core CPI fell sharply to 1.6% year-on-year, marking its lowest level since March 2022 and falling well below forecasts of 2.2%.
- SocGen's assessment of the potential for USD/JPY to test the Japanese Ministry of Finance's intervention limits due to persistent US rate expectations and recent market dynamics suggests a significant focus on the interplay between US economic data and currency movements.
- On Friday, a report from Reuters said that the Bank of Japan (BOJ) is expected to project that inflation will remain close to its 2% target in the coming years and signal its preparedness to raise interest rates from their near-zero levels. This stance by the BOJ is aimed at preventing yen depreciation and discouraging market participants from pushing the currency to fresh 34-year lows.
- Jiji news agency reported on Thursday that the Bank of Japan (BOJ) might reduce its bond purchases appears to be exerting a more significant influence on the market sentiment compared to the lower-than-expected Tokyo Consumer Price Index (CPI) data released today.
- According to Luci Ellis, Westpac's chief economist and former Assistant Governor (Economic) at the Reserve Bank of Australia, inflation slightly surpassed expectations in the March quarter. They anticipate the Board will maintain interest rates in May and have revised the projected date for the initial rate reduction from September to November this year.
- According to analysts at Barrenjoey Capital Partners, a leading Australian investment banking firm, advised to utilize the trimmed mean to rank Australia's inflation. Australia's six-month annualized rate of trimmed mean inflation, standing at 3.6%, is notably the highest worldwide, surpassing even the United States' 3.2% six-month annualized rate of trimmed mean inflation.
- Australia’s Consumer Price Index (CPI) rose by 1.0% QoQ in the first quarter of 2024, against the expected 0.8% and 0.6% prior. CPI (YoY) increased by 3.6% compared to the forecast of 3.4% for Q1 and 4.1% prior. Australia’s Monthly Consumer Price Index (YoY) rose by 3.5% in March, against the market expectations and the previous reading of 3.4%.
- According to the Japan Times, the proportion of Japanese companies intending to increase their pay scales reached 70.7%, marking a rise of 6.3 percentage points from the previous year. Additionally, the number of companies planning to implement pay-scale hikes and regular pay increases totaling 5% or more amounted to 36.5%, nearly doubling from the previous year. This could provide support for the Yen.
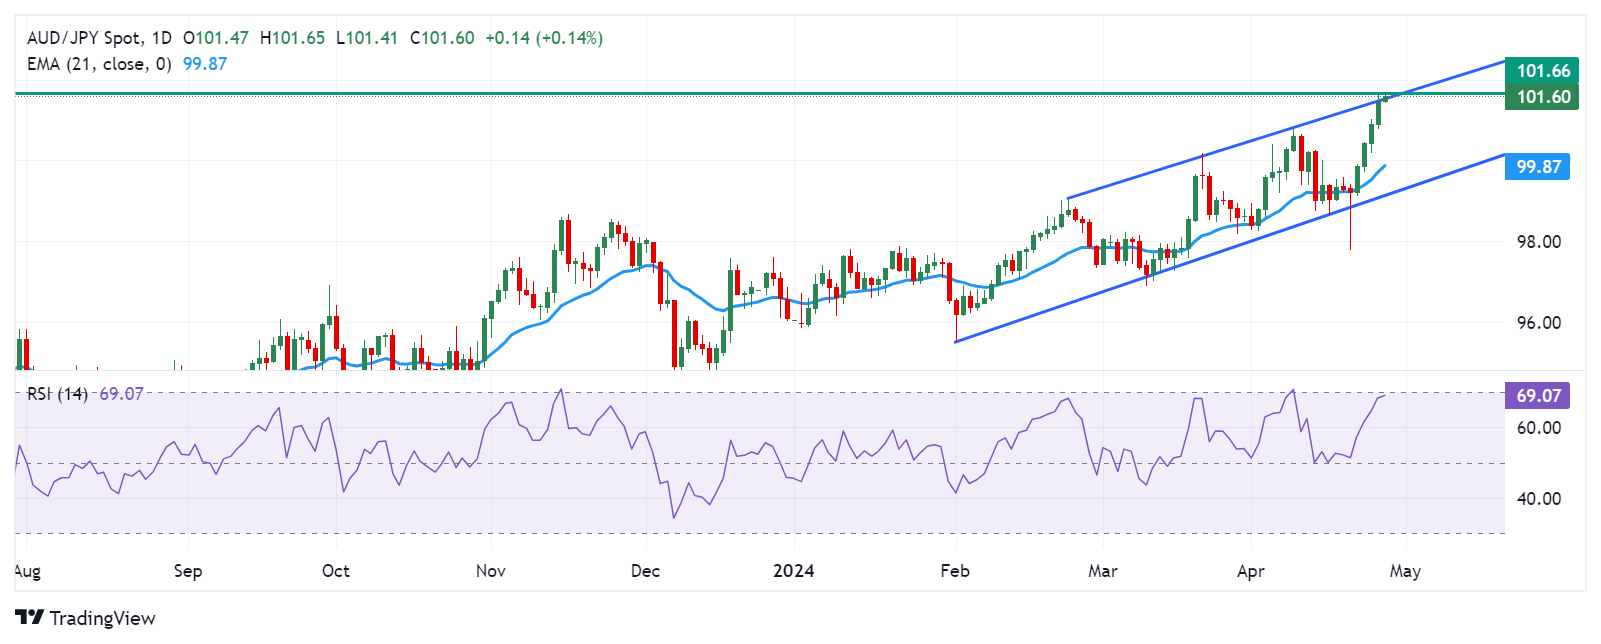
Technical Analysis: AUD/JPY hovers around the major level of 101.50
The AUD/JPY trades around 101.50 on Friday, testing the upper boundary of the daily ascending channel, trading around a fresh five-month high of 101.66. Additionally, the 14-day Relative Strength Index (RSI) is trending above the 50-level, strengthening the bullish sentiment. The immediate resistance is seen at the psychological level of 102.00.
On the downside, immediate support for the AUD/JPY pair could be found at the psychological level of 101.00. If the pair breaches below this level, it suggests a bearish sentiment may prevail and might lead the AUD/JPY cross to a further decline toward the psychological level of 100.00, followed by the 21-day Exponential Moving Average (EMA) at the level of 99.87. Further depreciation will likely test the lower boundary of the ascending channel around the level of 99.00.
AUD/JPY: Daily Chart
Australian Dollar price today
The table below shows the percentage change of the Australian Dollar (AUD) against listed major currencies today. The Australian Dollar was the strongest against the Swiss Franc.
| USD | EUR | GBP | CAD | AUD | JPY | NZD | CHF | |
| USD | 0.00% | 0.02% | -0.04% | -0.10% | 0.01% | -0.13% | 0.05% | |
| EUR | 0.00% | 0.01% | -0.02% | -0.10% | 0.00% | -0.13% | 0.05% | |
| GBP | -0.01% | -0.02% | -0.04% | -0.12% | 0.00% | -0.17% | 0.04% | |
| CAD | 0.03% | 0.03% | 0.03% | -0.08% | 0.03% | -0.13% | 0.06% | |
| AUD | 0.10% | 0.10% | 0.12% | 0.08% | 0.11% | -0.05% | 0.16% | |
| JPY | -0.01% | -0.01% | -0.01% | -0.04% | -0.12% | -0.15% | 0.04% | |
| NZD | 0.13% | 0.15% | 0.16% | 0.12% | 0.04% | 0.16% | 0.21% | |
| CHF | -0.06% | -0.06% | -0.03% | -0.09% | -0.15% | -0.05% | -0.19% |
The heat map shows percentage changes of major currencies against each other. The base currency is picked from the left column, while the quote currency is picked from the top row. For example, if you pick the Euro from the left column and move along the horizontal line to the Japanese Yen, the percentage change displayed in the box will represent EUR (base)/JPY (quote).
Australian Dollar FAQs
One of the most significant factors for the Australian Dollar (AUD) is the level of interest rates set by the Reserve Bank of Australia (RBA). Because Australia is a resource-rich country another key driver is the price of its biggest export, Iron Ore. The health of the Chinese economy, its largest trading partner, is a factor, as well as inflation in Australia, its growth rate and Trade Balance. Market sentiment – whether investors are taking on more risky assets (risk-on) or seeking safe-havens (risk-off) – is also a factor, with risk-on positive for AUD.
The Reserve Bank of Australia (RBA) influences the Australian Dollar (AUD) by setting the level of interest rates that Australian banks can lend to each other. This influences the level of interest rates in the economy as a whole. The main goal of the RBA is to maintain a stable inflation rate of 2-3% by adjusting interest rates up or down. Relatively high interest rates compared to other major central banks support the AUD, and the opposite for relatively low. The RBA can also use quantitative easing and tightening to influence credit conditions, with the former AUD-negative and the latter AUD-positive.
China is Australia’s largest trading partner so the health of the Chinese economy is a major influence on the value of the Australian Dollar (AUD). When the Chinese economy is doing well it purchases more raw materials, goods and services from Australia, lifting demand for the AUD, and pushing up its value. The opposite is the case when the Chinese economy is not growing as fast as expected. Positive or negative surprises in Chinese growth data, therefore, often have a direct impact on the Australian Dollar and its pairs.
Iron Ore is Australia’s largest export, accounting for $118 billion a year according to data from 2021, with China as its primary destination. The price of Iron Ore, therefore, can be a driver of the Australian Dollar. Generally, if the price of Iron Ore rises, AUD also goes up, as aggregate demand for the currency increases. The opposite is the case if the price of Iron Ore falls. Higher Iron Ore prices also tend to result in a greater likelihood of a positive Trade Balance for Australia, which is also positive of the AUD.
The Trade Balance, which is the difference between what a country earns from its exports versus what it pays for its imports, is another factor that can influence the value of the Australian Dollar. If Australia produces highly sought after exports, then its currency will gain in value purely from the surplus demand created from foreign buyers seeking to purchase its exports versus what it spends to purchase imports. Therefore, a positive net Trade Balance strengthens the AUD, with the opposite effect if the Trade Balance is negative.
Following his meeting with US Secretary of State Antony Blinken early Friday, China’s Foreign Minister Wang Yi said that the Sino-US “relationship has stabilized but negative factors are building.”
Additional comments
Sliding into conflict with the US would be a lose-lose situation.
We urge the US not to interfere with China's internal affairs.
In response, Blinken said that “there is no substitute for face-to-face diplomacy,” adding that “we need to avoid miscalculations.”
Blinken said that he “hopes the US and China can make progress on agreements, citing fentanyl, military-to-military ties and AI risks.”
Market reaction
At the press time, AUD/USD is holding higher ground near 0.6530, unperturbed by these comments. The spot is up 0.21% on the day.
Australian Dollar FAQs
One of the most significant factors for the Australian Dollar (AUD) is the level of interest rates set by the Reserve Bank of Australia (RBA). Because Australia is a resource-rich country another key driver is the price of its biggest export, Iron Ore. The health of the Chinese economy, its largest trading partner, is a factor, as well as inflation in Australia, its growth rate and Trade Balance. Market sentiment – whether investors are taking on more risky assets (risk-on) or seeking safe-havens (risk-off) – is also a factor, with risk-on positive for AUD.
The Reserve Bank of Australia (RBA) influences the Australian Dollar (AUD) by setting the level of interest rates that Australian banks can lend to each other. This influences the level of interest rates in the economy as a whole. The main goal of the RBA is to maintain a stable inflation rate of 2-3% by adjusting interest rates up or down. Relatively high interest rates compared to other major central banks support the AUD, and the opposite for relatively low. The RBA can also use quantitative easing and tightening to influence credit conditions, with the former AUD-negative and the latter AUD-positive.
China is Australia’s largest trading partner so the health of the Chinese economy is a major influence on the value of the Australian Dollar (AUD). When the Chinese economy is doing well it purchases more raw materials, goods and services from Australia, lifting demand for the AUD, and pushing up its value. The opposite is the case when the Chinese economy is not growing as fast as expected. Positive or negative surprises in Chinese growth data, therefore, often have a direct impact on the Australian Dollar and its pairs.
Iron Ore is Australia’s largest export, accounting for $118 billion a year according to data from 2021, with China as its primary destination. The price of Iron Ore, therefore, can be a driver of the Australian Dollar. Generally, if the price of Iron Ore rises, AUD also goes up, as aggregate demand for the currency increases. The opposite is the case if the price of Iron Ore falls. Higher Iron Ore prices also tend to result in a greater likelihood of a positive Trade Balance for Australia, which is also positive of the AUD.
The Trade Balance, which is the difference between what a country earns from its exports versus what it pays for its imports, is another factor that can influence the value of the Australian Dollar. If Australia produces highly sought after exports, then its currency will gain in value purely from the surplus demand created from foreign buyers seeking to purchase its exports versus what it spends to purchase imports. Therefore, a positive net Trade Balance strengthens the AUD, with the opposite effect if the Trade Balance is negative.
- WTI recovers to $83.60 in Friday’s early Asian session.
- The expectation that the Fed might delay rate cuts weighs on the black gold.
- The concern over oil supply disruptions amid renewed geopolitical tensions lifts the black gold.
Western Texas Intermediate (WTI), the US crude oil benchmark, is trading around $83.60 on Friday. The black gold edges higher as the market weighed the weaker-than-expected US economic growth data against a potential geopolitical risk from a looming Israeli invasion of the southern Gaza city of Rafah.
WTI prices face some sell-off following the GDP report from the Commerce Department on Thursday. The US economy expanded at its slowest pace in nearly two years in the first quarter (Q1) of 2024 as inflation rose at a faster pace. The advanced US GDP grew by 1.6% on an annualized basis in the first quarter (Q1) in 2024, compared to a 3.4% growth in Q4 2023. This reading came in below the market estimation of 2.5%. Additionally, the inflation in the United States remains elevated and it might trigger the speculation that the Federal Reserve will not cut interest rates before September.
However, WTI prices recover and hold positive ground after Treasury Secretary Janet Yellen said that US economic growth was likely stronger than suggested by weaker-than-expected quarterly data.
Apart from this, the concern over oil supply disruption amid the escalating geopolitical tensions boosts the black gold. Israel launched airstrikes on Rafah as the country made preparations to invade the city, per Reuters.
The worries about the largest drawdown in US commercial crude stockpiles since mid-January also lift the WTI prices. The Energy Information Administration (EIA) reported that crude inventories for the week ending April 19 fell by 6.368 million barrels from the previous reading of 2.735 million barrels built.
- The Japanese Yen struggles to register any recovery amid dovish BoJ expectations.
- The lack of action by Japanese authorities and softer Tokyo CPI also exert pressure.
- Traders keenly await the crucial BoJ decision ahead of the US PCE Price Index data.
The Japanese Yen (JPY) languishes near a multi-decade low against its American counterpart during the Asian session on Friday as traders keenly await the outcome of the highly-anticipated Bank of Japan (BoJ) policy meeting. After the historic decision in March to raise short-term interest rates for the first time in 17 years, the central bank is widely expected to leave policy settings and bond purchase amounts unchanged amid signs that inflation in Japan is cooling. This puts the market focus squarely on the quarterly inflation and growth forecasts, which will play a key role in influencing the near-term JPY price dynamics.
In the meantime, the lack of any decisive action by Japanese authorities to support the domestic currency fails to provide any respite to the JPY bulls. Meanwhile, the US Dollar (USD) hangs near a two-week low touched on Thursday in reaction to data showing a sharp slowdown in the US economic growth, which, in turn, caps the upside for the USD/JPY pair. That said, an unwelcome pickup in inflation reaffirmed market bets that the Federal Reserve (Fed) will keep interest rates higher for longer, which should act as a tailwind for the currency pair ahead of the US Personal Consumption Expenditures (PCE) Price Index.
Daily Digest Market Movers: Japanese Yen bulls remain on the sidelines ahead of BoJ and the key US macro data
- Government data showed on Friday that consumer inflation in Tokyo decelerated sharply in April and dashed hopes for any hawkish signals from the Bank of Japan, undermining the Japanese Yen.
- The headline Tokyo Consumer Price Index (CPI) rose 1.8% YoY in April, while core CPI (ex-Fresh Food, Energy) increased by 1.8% YoY during the reported month, both missing consensus estimates.
- A core CPI gauge that excludes both fresh food and energy prices and is closely watched by the BoJ as a gauge of underlying inflation fell below the 2% target for the first time since September 2022.
- From the US, the Commerce Department reported on Thursday that Gross Domestic Product grew at a 1.6% annualized rate in the January-March period, marking the weakest reading since mid-2022.
- This pointed to a significant loss of momentum at the start of 2024, though was offset by a rise in the underlying inflation, which reaffirmed bets that the Federal Reserve will keep rates higher for longer.
- A Jiji report indicated that the BoJ might buy fewer bonds, pushing Japan’s five-year bond yield to the highest level since April 2011, albeit does little to provide any meaningful boost to the JPY.
- Japan's Finance Minister Shunichi Suzuki reiterated that he is closely monitoring FX fluctuations and that he will prepare to take full steps on the currency, though declined to comment on details of the policy.
- Meanwhile, traders now seem reluctant and prefer to wait for the crucial BoJ policy decision, which will be followed by the release of the US Personal Consumption Expenditures (PCE) Price Index.
Technical Analysis: USD/JPY is likely to confront stiff resistance near 156.00 amid overbought RSI on the daily chart
From a technical perspective, momentum beyond the overnight swing high, around the 155.75 zone, has the potential to lift the USD/JPY pair to the 156.00 mark. The latter should act as a strong barrier and cap the upside amid the extremely overbought Relative Strength Index (RSI) on the daily chart, which, in turn, warrants some caution for bullish traders.
On the flip side, the 155.35-155.30 region is likely to protect the immediate downside ahead of the 155.00 psychological mark. This is closely followed by a short-term trading range resistance breakpoint, around the 154.70 area, below which the USD/JPY pair could drop to the 154.00 round figure en route to last Friday's swing low, around the 153.60-153.55 zone.
Japanese Yen FAQs
The Japanese Yen (JPY) is one of the world’s most traded currencies. Its value is broadly determined by the performance of the Japanese economy, but more specifically by the Bank of Japan’s policy, the differential between Japanese and US bond yields, or risk sentiment among traders, among other factors.
One of the Bank of Japan’s mandates is currency control, so its moves are key for the Yen. The BoJ has directly intervened in currency markets sometimes, generally to lower the value of the Yen, although it refrains from doing it often due to political concerns of its main trading partners. The current BoJ ultra-loose monetary policy, based on massive stimulus to the economy, has caused the Yen to depreciate against its main currency peers. This process has exacerbated more recently due to an increasing policy divergence between the Bank of Japan and other main central banks, which have opted to increase interest rates sharply to fight decades-high levels of inflation.
The BoJ’s stance of sticking to ultra-loose monetary policy has led to a widening policy divergence with other central banks, particularly with the US Federal Reserve. This supports a widening of the differential between the 10-year US and Japanese bonds, which favors the US Dollar against the Japanese Yen.
The Japanese Yen is often seen as a safe-haven investment. This means that in times of market stress, investors are more likely to put their money in the Japanese currency due to its supposed reliability and stability. Turbulent times are likely to strengthen the Yen’s value against other currencies seen as more risky to invest in.
On Friday, the People’s Bank of China (PBoC) set the USD/CNY central rate for the trading session ahead at 7.1056 as compared to the previous day's fix of 7.1058 and 7.2396 Reuters estimates.
Japan’s five-year bond yield rose to the highest level since April 2011 ahead of the Bank of Japan (BoJ) interest rate decision on Friday, per A Jiji. The yield advanced 2.5 basis points (bps) to 0.523% in the early Asian session on Friday.
The Bank of Japan (BoJ) is expected to leave its short-term rate target unchanged in the range between 0% and 0.1% on Friday, following the conclusion of its two-day monetary policy review meeting for April.
Market reaction
At the time of writing, USD/JPY is trading 0.02% lower on the day to trade at 155.62.
Japanese Yen FAQs
The Japanese Yen (JPY) is one of the world’s most traded currencies. Its value is broadly determined by the performance of the Japanese economy, but more specifically by the Bank of Japan’s policy, the differential between Japanese and US bond yields, or risk sentiment among traders, among other factors.
One of the Bank of Japan’s mandates is currency control, so its moves are key for the Yen. The BoJ has directly intervened in currency markets sometimes, generally to lower the value of the Yen, although it refrains from doing it often due to political concerns of its main trading partners. The current BoJ ultra-loose monetary policy, based on massive stimulus to the economy, has caused the Yen to depreciate against its main currency peers. This process has exacerbated more recently due to an increasing policy divergence between the Bank of Japan and other main central banks, which have opted to increase interest rates sharply to fight decades-high levels of inflation.
The BoJ’s stance of sticking to ultra-loose monetary policy has led to a widening policy divergence with other central banks, particularly with the US Federal Reserve. This supports a widening of the differential between the 10-year US and Japanese bonds, which favors the US Dollar against the Japanese Yen.
The Japanese Yen is often seen as a safe-haven investment. This means that in times of market stress, investors are more likely to put their money in the Japanese currency due to its supposed reliability and stability. Turbulent times are likely to strengthen the Yen’s value against other currencies seen as more risky to invest in.
- GBP/USD snaps the three-day winning streak near 1.2502 in Friday’s early Asian session.
- The US economy grew at a slower pace of 1.6% in Q1 2024, compared to 3.4% in the previous reading.
- The expectation that the BoE will cut rates before the US Fed might exert some selling pressure on the GBP.
The GBP/USD pair trades on a weaker note around 1.2502 during the early Asian trading hours on Friday. The modest rebound of the US Dollar (USD) weighs on the major pair despite weaker US GDP growth numbers. The US Personal Consumption Expenditures (PCE) Price Index data on Friday will be in the spotlight.
On Thursday, the US economy grew at a slower pace of 1.6% in the first quarter (Q1) of 2024, compared to 3.4% in the previous reading. This figure came in weaker than the market expectation of 2.5%. However, prices have remained sticky, with the data on Thursday revealing the Personal Consumption Expenditures Price Index in Q1 climbing at a 3.4% annual rate, above the Fed's 2% target. The Greenback has dropped to two-week lows near mid-105.00 after the release of weaker-than-expected Q1 GDP growth and a hotter-than-expected inflation reading.
According to the CME FedWatch tool, financial markets have priced in less than 10% odds that the US Federal Reserve (Fed) will cut interest rates in June, while the probability of a September rate cut dropping below 58%. Investors will take more cues from another inflation report on Friday. The US PCE is expected to show an increase of 0.3% MoM in both headline and core PCE figures. On an annual basis, the headline PCE and Core PCE figures are estimated to show a rise of 2.6% and 2.7% YoY, respectively.
On the GBP’s front, the Bank of England (BoE) Governor Andrew Bailey and other BoE policymakers stated that inflation in the United Kingdom dropped in line with the central bank's expectations and the risk of elevated inflation had reduced, paving the way for a rate cut. The market anticipates that the UK central bank will wait until next quarter to lower borrowing costs, and it will begin before the US Fed. This, in turn, might cap the upside of the Pound Sterling (GBP).
| Index | Change, points | Closed | Change, % |
|---|---|---|---|
| NIKKEI 225 | -831.6 | 37628.48 | -2.16 |
| Hang Seng | 83.27 | 17284.54 | 0.48 |
| KOSPI | -47.13 | 2628.62 | -1.76 |
| DAX | -171.42 | 17917.28 | -0.95 |
| CAC 40 | -75.21 | 8016.65 | -0.93 |
| Dow Jones | -375.12 | 38085.8 | -0.98 |
| S&P 500 | -23.21 | 5048.42 | -0.46 |
| NASDAQ Composite | -100.99 | 15611.76 | -0.64 |
| Pare | Closed | Change, % |
|---|---|---|
| AUDUSD | 0.6518 | 0.35 |
| EURJPY | 166.915 | 0.52 |
| EURUSD | 1.07292 | 0.3 |
| GBPJPY | 194.619 | 0.62 |
| GBPUSD | 1.25104 | 0.41 |
| NZDUSD | 0.59455 | 0.2 |
| USDCAD | 1.36546 | -0.37 |
| USDCHF | 0.91212 | -0.29 |
| USDJPY | 155.574 | 0.22 |
Japanese Finance Minister Shunichi Suzuki said on Friday that he is closely monitoring foreign exchange (FX) fluctuations. Suzuki further stated that he will prepare to take full steps on the currency. However, he declined to comment on forex and policy details.
Key quotes
“Declines to comment on forex and policy details.”
“We will take all necessary measures when needed.”
“He is closely monitoring currency fluctuations.”
“There are positive and negative elements of weak yen.”
“Prepared to Take Full Steps on FX.”
“Concerned about negative effects of weak yen.”
Market reaction
At the time of writing, USD/JPY is trading 0.02% lower on the day to trade at 155.72.
Japanese Yen FAQs
The Japanese Yen (JPY) is one of the world’s most traded currencies. Its value is broadly determined by the performance of the Japanese economy, but more specifically by the Bank of Japan’s policy, the differential between Japanese and US bond yields, or risk sentiment among traders, among other factors.
One of the Bank of Japan’s mandates is currency control, so its moves are key for the Yen. The BoJ has directly intervened in currency markets sometimes, generally to lower the value of the Yen, although it refrains from doing it often due to political concerns of its main trading partners. The current BoJ ultra-loose monetary policy, based on massive stimulus to the economy, has caused the Yen to depreciate against its main currency peers. This process has exacerbated more recently due to an increasing policy divergence between the Bank of Japan and other main central banks, which have opted to increase interest rates sharply to fight decades-high levels of inflation.
The BoJ’s stance of sticking to ultra-loose monetary policy has led to a widening policy divergence with other central banks, particularly with the US Federal Reserve. This supports a widening of the differential between the 10-year US and Japanese bonds, which favors the US Dollar against the Japanese Yen.
The Japanese Yen is often seen as a safe-haven investment. This means that in times of market stress, investors are more likely to put their money in the Japanese currency due to its supposed reliability and stability. Turbulent times are likely to strengthen the Yen’s value against other currencies seen as more risky to invest in.
FOREIGN EXCHANGE MARKET NEWS
CURRENCY MARKET DEFINITION
The concept of currency market has several definitions:
- Currency market is the sphere of economic relations that are manifested in the purchase and sale of currency values (foreign currency, securities in foreign currency), as well as operations related to the investment of capital in foreign currency;
- Currency market is a financial center where currency purchase and sale transactions based on supply and demand for them are concentrated;
- Curency market is a whole of authorized banks, investment companies, brokerages, exchanges, and foreign banks that perform foreign exchange operations.
- Currency market is a whole of communications systems that link banks in different countries that conduct international currency transactions.
Simply put, currency market is the market where currency transactions are made, that is, the currency of one country is exchanged for the currency of another country at a certain exchange rate. The exchange rate is the relative price of currencies of two countries or the currency of one country expressed in another country's monetary units.
Currency market is part of the global financial market, where many operations related to the global movement of capital take place.
TYPES OF MARKETS. RUSSIAN AND INTERNATIONAL CURRENCY MARKETS
There are international and domestic currency markets.
Domestic currency market — is a market within a single country.
The international currency market — is a global market that covers currency markets of all countries in the world. It does not have a specific site where trading is carried out. All operations within it are carried out through a system of cable and satellite channels that link the world's regional currency markets. Regional markets today include the Asian (with centers in Tokyo, Hong Kong, Singapore, and Melbourne), the European (London, Frankfurt am Main, and Zurich), and the American (New York, Chicago, and Los Angeles) markets.
Currency trading on the international currency market is carried out on the basis of market exchange rates, which are set on the basis of supply and demand in the market and under the influence of various macroeconomic data. Forex is the international currency market.
Currency markets can also be divided into exchange and over-the-counter markets. Exchange currency market is an organized market where trading is carried out through an exchange—a special company that sets trading rules and provides all the conditions for organizing trading under these rules.
Over-the-counter currency market — is a market where there are no certain trading rules, and purchase and sale operations are not linked to a specific place of trade, as opposed to the case of an exchange.
As a rule, an over-the-counter currency market is organized by special companies that provide services for the purchase and sale of currencies, which may or may not be members of the currency exchange. Trading operations in this market are now carried out mainly via the Internet.
The over-the-counter currency market is much larger than the exchange market in terms of trading volume. The Forex international over-the-counter currency market is considered the most liquid in the world. It operates around the clock in all financial centers of the world (from New York to Tokyo).
CURRENCY MARKET FUNCTIONS
Currency market— is the most important platform for ensuring the normal course of all global economic processes.
The main macroeconomic functions of the currency market are:
- creating conditions for the subjects of foreign exchange relations to make timely international current and capital payments and thereby promoting the development of foreign trade;
- providing conditions and mechanisms for the implementation of monetary and economic policy of the state;
- diversifying foreign exchange reserves;
- forming the exchange rate under the influence of supply and demand;
NEWS IMPACT
Various currencies are the main trading tool in the currency market. Exchange rates are formed under the influence of supply and demand in the market.
In addition to that, currency rates are influenced by many fundamental factors related to the global economic situation, events in national economies, and political decisions.
News about these factors can be found in various sources:
- Reports showing a country´s level of economic development.
The more stable an economy is developing, the more stable its currency is. Accordingly, it is possible to predict how the currency will behave in the near future, based on statistical data published in official sources of countries with a certain regularity.
This data includes:
- GDP
- unemployment;
- return on equity;
- consumer price index;
- industrial price index;
- propensity to consume;
- salaries outside of the agricultural sector;
- residential construction, etc.
Interest rate level, set by national authorities regulating credit policy, is an equally important indicator. In the European Union, this is ECB–the European Central Bank, in the US, this is the Federal Reserve System, in Japan—the Bank of Japan, in the UK—the Bank of England, in Switzerland—the Swiss national Bank, etc.
The interest rate level is determined at meetings of the national central bank. Then, the decision on the rate is published in official sources. If the central bank of a country reduces the interest rate, the money supply in the country increases, and the national currency depreciates against other world currencies. If the interest rate increases, the national currency will strengthen.
- Speeches of country leaders, leading economists and analysts.
A speech or even a separate statement by a country's leader can reverse a trend. Speeches on these topics may change the currency exchange rate:
- analysis of the situation on the currency market;
- changes in monetary or economic policy;
- adoption of a budget policy;
- forecasts of the economic situation, etc.
All this news is published in various sources. Major international news is more or less easy to find in Russian, but news related to the domestic economic policy and the economy of foreign countries is much less common in the Russian press. Mostly, such news is published by the national media and in the language of the country where the news is published.
It is very difficult for one person to follow all the news at once, and they are likely to miss some important event that can turn the whole situation on the market upside down. Guided by our main principle—to create the best trading conditions for our customers—we try to select the most important news from all over the world and publish them on our website.
The TeleTRADE Department of Analytics monitors news on most national and international news sources on a daily basis and identifies those that can potentially affect exchange rates. These are the main news items that are included in our news feed.
In addition, all our clients have free access to the Dow Jones news feed. This is a joint project of Dow Jones Newswires, the world's largest news agency, and the leading Russian news agency Prime-TASS. The news feed is created specifically for currency traders and those who are interested in getting information about the world's currency markets.


© 2000-2024. All rights reserved.
This site is managed by Teletrade D.J. LLC 2351 LLC 2022 (Euro House, Richmond Hill Road, Kingstown, VC0100, St. Vincent and the Grenadines).
The information on this website is for informational purposes only and does not constitute any investment advice.
The company does not serve or provide services to customers who are residents of the US, Canada, Iran, The Democratic People's Republic of Korea, Yemen and FATF blacklisted countries.
Making transactions on financial markets with marginal financial instruments opens up wide possibilities and allows investors who are willing to take risks to earn high profits, carrying a potentially high risk of losses at the same time. Therefore you should responsibly approach the issue of choosing the appropriate investment strategy, taking the available resources into account, before starting trading.
Use of the information: full or partial use of materials from this website must always be referenced to TeleTrade as the source of information. Use of the materials on the Internet must be accompanied by a hyperlink to teletrade.org. Automatic import of materials and information from this website is prohibited.
Please contact our PR department if you have any questions or need assistance at pr@teletrade.global.
transfers