- Analytics
- News and Tools
- Market News
Market Trading News and Research from 25 April 2024
The continuation of the downward bias hurt the Greenback and prompted the USD Index (DXY) to recede to multi-day lows following disheartening GDP readings and higher inflation prints, all prior to Friday’s release of PCE data.
Here is what you need to know on Friday, April 26:
The USD Index (DXY) revisited the mid-105.00s amidst rising yields and the dominating appetite for the risk complex. On April 26, inflation readings measured by the PCE will be at the centre of the debate, seconded by Personal Income, Personal Spending, and the final Michigan Consumer Sentiment for the month of April.
EUR/USD advanced further north of the 1.0700 barrier amidst the persistent selling pressure around the US Dollar. There will be no data releases in the euro docket at the end of the week.
GBP/USD extended further its weekly recovery and reclaimed the area well past 1.2500 the figure. The GfK Consumer Confidence gauge is only expected on April 26.
USD/JPY maintained its bullish mood well in place and rose to fresh tops around 155.75 prior to the BoJ gathering. The BoJ meets and releases its Quarterly Outlook Report on April 26.
AUD/USD traded with gains for the fourth consecutive session and flirted once again with the key 200-day SMA near 0.6530. The Australian calendar will be empty on April 26.
Extra losses sparked the second day in a row of losses in WTI prices in response to the resurgence of demand fears and the likelihood of a tighter-for-longer Fed.
Gold advanced decently after three straight daily declines on the back of rising geopolitical jitters and higher-than-expected US inflation. Silver, in the meantime, seems to have embarked on a consolidative range underpinned by the $27.00 region so far.
- Mexican Peso depreciates by over 0.5% against US Dollar, reacting to unexpected inflation reacceleration in the US.
- US GDP growth for Q1 2024 falls short of forecasts at 1.6%, but a sharp increase in core PCE inflation to 3.7% boosts US yields.
- The rise in US yields and recalibrated Fed rate cut expectations drove USD/MXN to a weekly high of 17.38.
The Mexican Peso (MXN) fell during the North American session on Thursday, depreciating more than 0.5% against the US Dollar following the release of the Gross Domestic Product (GDP) in the United States (US) for the first quarter of 2024, which was weaker than expected. At the same time, the US Bureau of Economic Analysis (BEA) revealed that inflation for the same period increased sharply, spurring a jump in US Treasury yields, and weighed on the Mexican currency. At the time of writing, the USD/MXN trades at 17.18 after bouncing off a daily low of 17.01.
Thursday’s main driver for the Mexican Peso was US data. GDP for the first quarter missed estimates of 2.5% QoQ and expanded by 1.6%. By itself, that warranted US Dollar weakness, but digging deeper into the US BEA report, the core Personal Consumption Expenditure (PCE) price index for Q1 on a quarterly basis rose by 3.7%, higher than the expected 3.4% and up from 2%.
Market participants ditched the Mexican Peso as the USD/MXN rallied sharply, refreshing weekly highs at 17.38. US Treasury yields skyrocketed, while investors had priced out interest rate cuts by the US Federal Reserve (Fed) in 2024.
The data spooked investors of the emerging market currency. Speculation that the interest rate differential between Mexico and the US would likely shrink has spurred outflows from the Peso toward the Greenback.
Daily digest market movers: Mexican Peso depreciates as US inflation picks up
- Mexico’s inflation report on Wednesday capped the USD/MXN advance. Even though mid-month inflation rose by 4.63% YoY, above March’s reading and estimates of 4.48%, the Core readings slowed sharply to 4.39% YoY as projected, down from 4.69%. Despite being a mixed reading, core prices are beginning to cool down, depicting a clear downtrend in inflation.
- Citibanamex Survey showed that most analysts expect Banxico to hold rates unchanged at the May meeting. The median foresees a rate cut in June, while they estimate the main reference rate to end at 10.00%, up from 9.63% previously.
- Banxico Governor Victoria Rodriguez Ceja said that service inflation is not slowing as expected. She added that the Peso’s strength has helped to temper inflationary pressure and lower imported goods. She emphasized that Banxico would remain data-dependent.
- Mexico’s economy is faring well as Economic Activity expanded in February compared to January’s data. Figures increased by 1.4% MoM and 4.4% YoY in the second month of the year, up from January’s 0.9% and 1.9% expansion, respectively.
- Other data in the US showed that the labor market remains tight as Initial Jobless Claims for the week ending April 20 missed estimates of 214K, coming at 207K, less than the previous reading.
- Data from the Chicago Board of Trade (CBOT) suggests that traders expect the Fed funds rate to finish 2024 at 5.035%, up from 4.98% on Wednesday.
Technical analysis: Mexican Peso on backfoot as USD/MXN rallies toward 200-day SMA
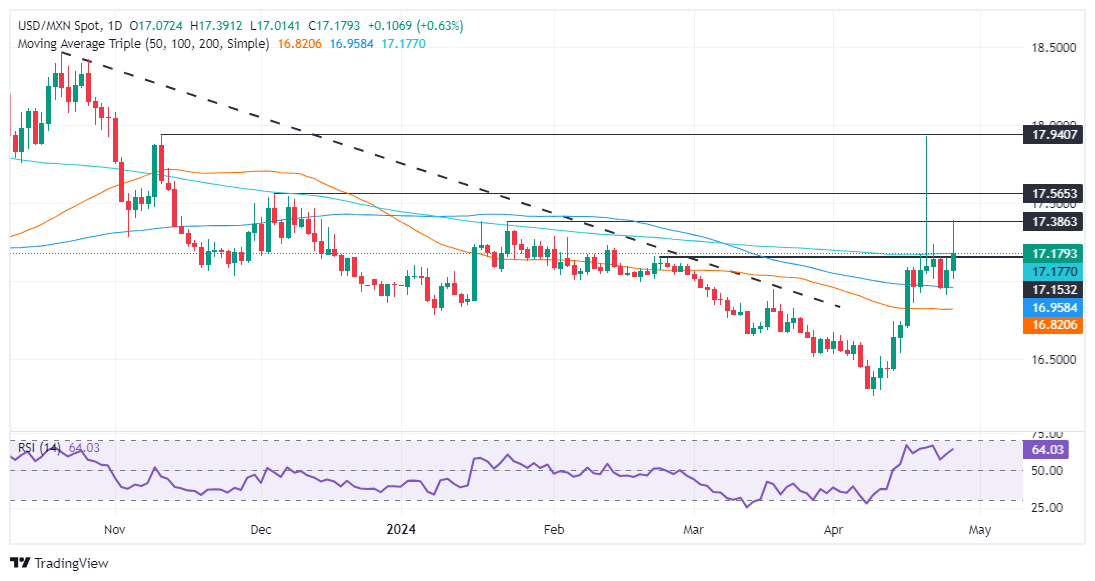
The Mexican Peso downtrend continues as the USD/MXN has cleared the 200-day Simple Moving Average (SMA) at 17.16. The rally was capped at the January 23 swing high of 17.38. The exotic pair has retreated since then.
If USD/MXN sellers drag spot prices below the 200-day SMA, look for a retest of the 17.00 figure. Subsequent losses are seen, once cleared, with the next support being the 50-day SMA at 16.81 before challenging last year’s low of 16.62.
On the other hand, if buyers achieve a daily close above the 200-day SMA, look for another test of 17.38. A breach of the latter will expose the 18.00 figure, followed by the year-to-date (YTD) high at 17.92.
Mexican Peso FAQs
The Mexican Peso (MXN) is the most traded currency among its Latin American peers. Its value is broadly determined by the performance of the Mexican economy, the country’s central bank’s policy, the amount of foreign investment in the country and even the levels of remittances sent by Mexicans who live abroad, particularly in the United States. Geopolitical trends can also move MXN: for example, the process of nearshoring – or the decision by some firms to relocate manufacturing capacity and supply chains closer to their home countries – is also seen as a catalyst for the Mexican currency as the country is considered a key manufacturing hub in the American continent. Another catalyst for MXN is Oil prices as Mexico is a key exporter of the commodity.
The main objective of Mexico’s central bank, also known as Banxico, is to maintain inflation at low and stable levels (at or close to its target of 3%, the midpoint in a tolerance band of between 2% and 4%). To this end, the bank sets an appropriate level of interest rates. When inflation is too high, Banxico will attempt to tame it by raising interest rates, making it more expensive for households and businesses to borrow money, thus cooling demand and the overall economy. Higher interest rates are generally positive for the Mexican Peso (MXN) as they lead to higher yields, making the country a more attractive place for investors. On the contrary, lower interest rates tend to weaken MXN.
Macroeconomic data releases are key to assess the state of the economy and can have an impact on the Mexican Peso (MXN) valuation. A strong Mexican economy, based on high economic growth, low unemployment and high confidence is good for MXN. Not only does it attract more foreign investment but it may encourage the Bank of Mexico (Banxico) to increase interest rates, particularly if this strength comes together with elevated inflation. However, if economic data is weak, MXN is likely to depreciate.
As an emerging-market currency, the Mexican Peso (MXN) tends to strive during risk-on periods, or when investors perceive that broader market risks are low and thus are eager to engage with investments that carry a higher risk. Conversely, MXN tends to weaken at times of market turbulence or economic uncertainty as investors tend to sell higher-risk assets and flee to the more-stable safe havens.
- Canadian Dollar trapped near familiar levels, gives mixed performance.
- Canada absent from the economic calendar until next week’s GDP.
- US GDP comes in soft, but PCE hints at still high inflation.
The Canadian Dollar (CAD) spread on Thursday, giving a mixed performance and sticking close to familiar technical levels after US data printed in both directions early in the US market session. US Gross Domestic Product (GDP) eased more than expected, a boon for investors looking for rate cuts from the US Federal Reserve (Fed). However, inflation continues to be a major sticking point for rate cut hopes after US Personal Consumption Expenditure (PCE) inflation climbed even higher than expected.
Canada is absent from the economic calendar for the remainder of the trading week. The next piece of useful Canadian economic data will be next Tuesday’s Canadian MoM GDP for February. Canada’s S&P Global Manufacturing Purchasing Managers Index (PMI) will also print next Wednesday.
Daily digest market movers: Canadian Dollar lacks momentum after US data fails to deliver clean picture
- Annualized US GDP for the first quarter eased to 1.6%, declining from the previous 3.4% and falling well short of the forecast of 2.5%.
- Read more: US GDP expands less that expected in Q1
- Rapidly slowing GDP is a welcome boon for investors desperate for rate cuts from Fed. However, US PCE inflation in Q1 rose to 3.7%, vaulting over forecast of 3.4% and accelerating from previous 2.0%.
- Rising inflation will keep Fed hobbled on rate cuts, markets churn on mixed print.
- Friday’s US PCE Price Index will draw additional attention after Thursday’s gloomy bellwether.
- March’s MoM US PCE Price Index is expected to hold steady at 0.3%, while the YoY figure is expected to tick down to 2.6% from 2.8%.
Canadian Dollar price today
The table below shows the percentage change of Canadian Dollar (CAD) against listed major currencies today. Canadian Dollar was the strongest against the Japanese Yen.
| USD | EUR | GBP | CAD | AUD | JPY | NZD | CHF | |
| USD | -0.15% | -0.24% | -0.06% | -0.10% | 0.22% | 0.00% | -0.04% | |
| EUR | 0.17% | -0.05% | 0.11% | 0.07% | 0.39% | 0.16% | 0.13% | |
| GBP | 0.23% | 0.08% | 0.17% | 0.15% | 0.47% | 0.21% | 0.20% | |
| CAD | 0.11% | -0.06% | -0.13% | -0.01% | 0.30% | 0.09% | 0.05% | |
| AUD | 0.10% | -0.05% | -0.12% | 0.04% | 0.31% | 0.09% | 0.06% | |
| JPY | -0.21% | -0.35% | -0.44% | -0.28% | -0.31% | -0.22% | -0.26% | |
| NZD | 0.04% | -0.12% | -0.20% | -0.04% | -0.07% | 0.25% | 0.02% | |
| CHF | 0.04% | -0.12% | -0.20% | -0.04% | -0.05% | 0.28% | 0.01% |
The heat map shows percentage changes of major currencies against each other. The base currency is picked from the left column, while the quote currency is picked from the top row. For example, if you pick the Euro from the left column and move along the horizontal line to the Japanese Yen, the percentage change displayed in the box will represent EUR (base)/JPY (quote).
Technical analysis: Canadian Dollar trades steady but mixed
The Canadian Dollar (CAD) is getting pushed into the middle on Thursday, trading flat to within a quarter of a percent across the major currency board during the US market session. The CAD sees a meager tenth of a percent gain against the US Dollar (USD). The Japanese Yen (JPY) is down a quarter of a percent against the Canadian Dollar as the market’s worst-performing currency on the day.
The CAD continues to trade within a tight range near the 1.3700 handle against the US Dollar, and the USD/CAD has priced in a near-term price floor near 1.3660. A topside break is hampered by the 200-hour Exponential Moving Average (EMA) at 1.3710, and a heavy supply zone rests just below current price action below 1.3600.
USD/CAD hourly chart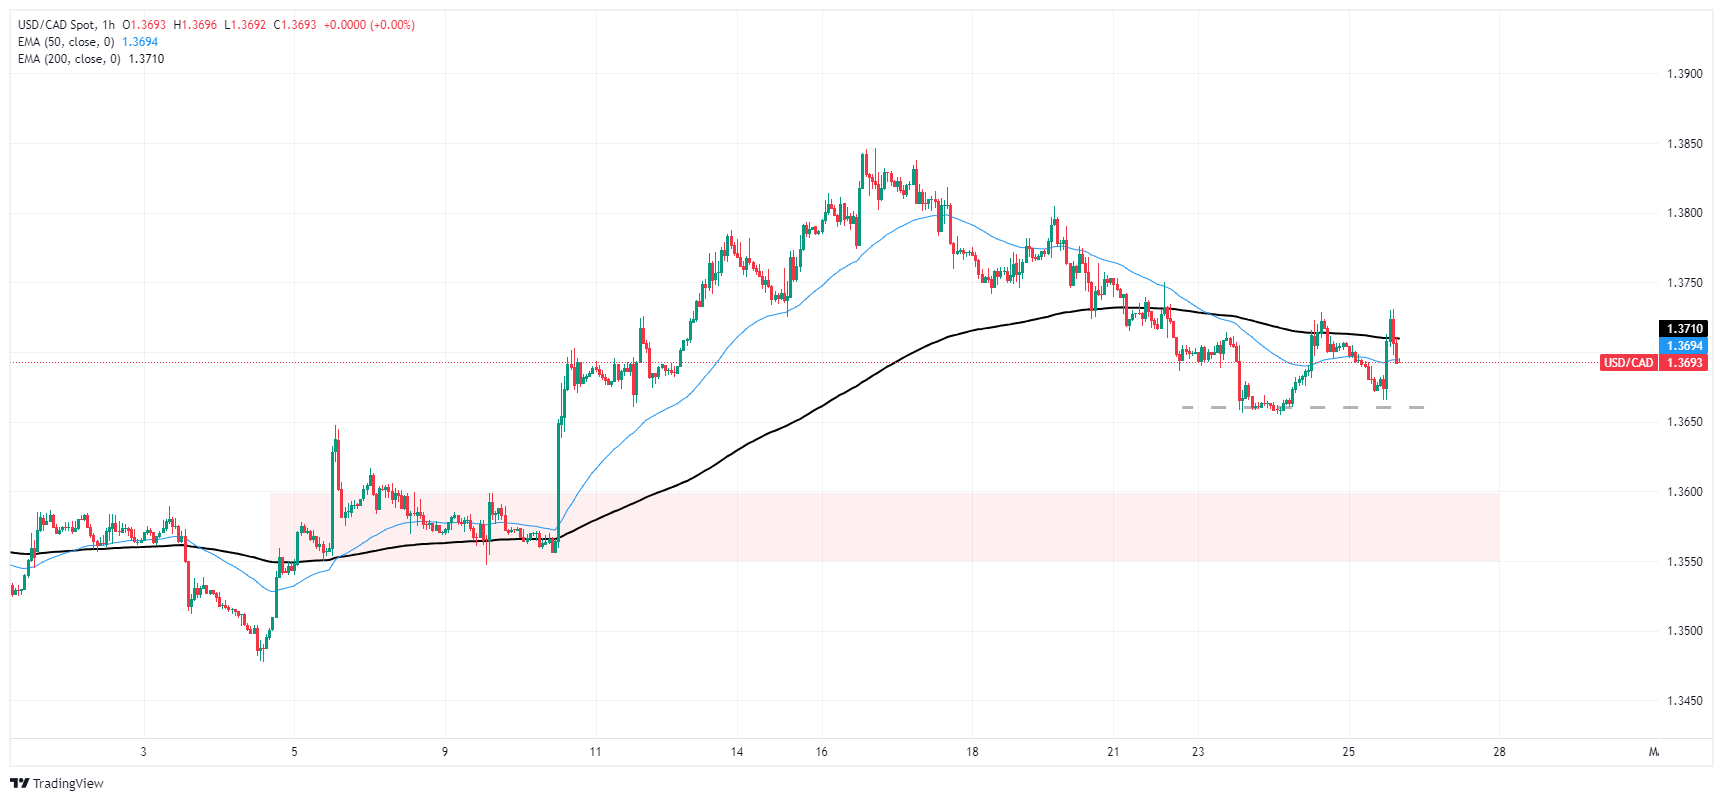
USD/CAD daily chart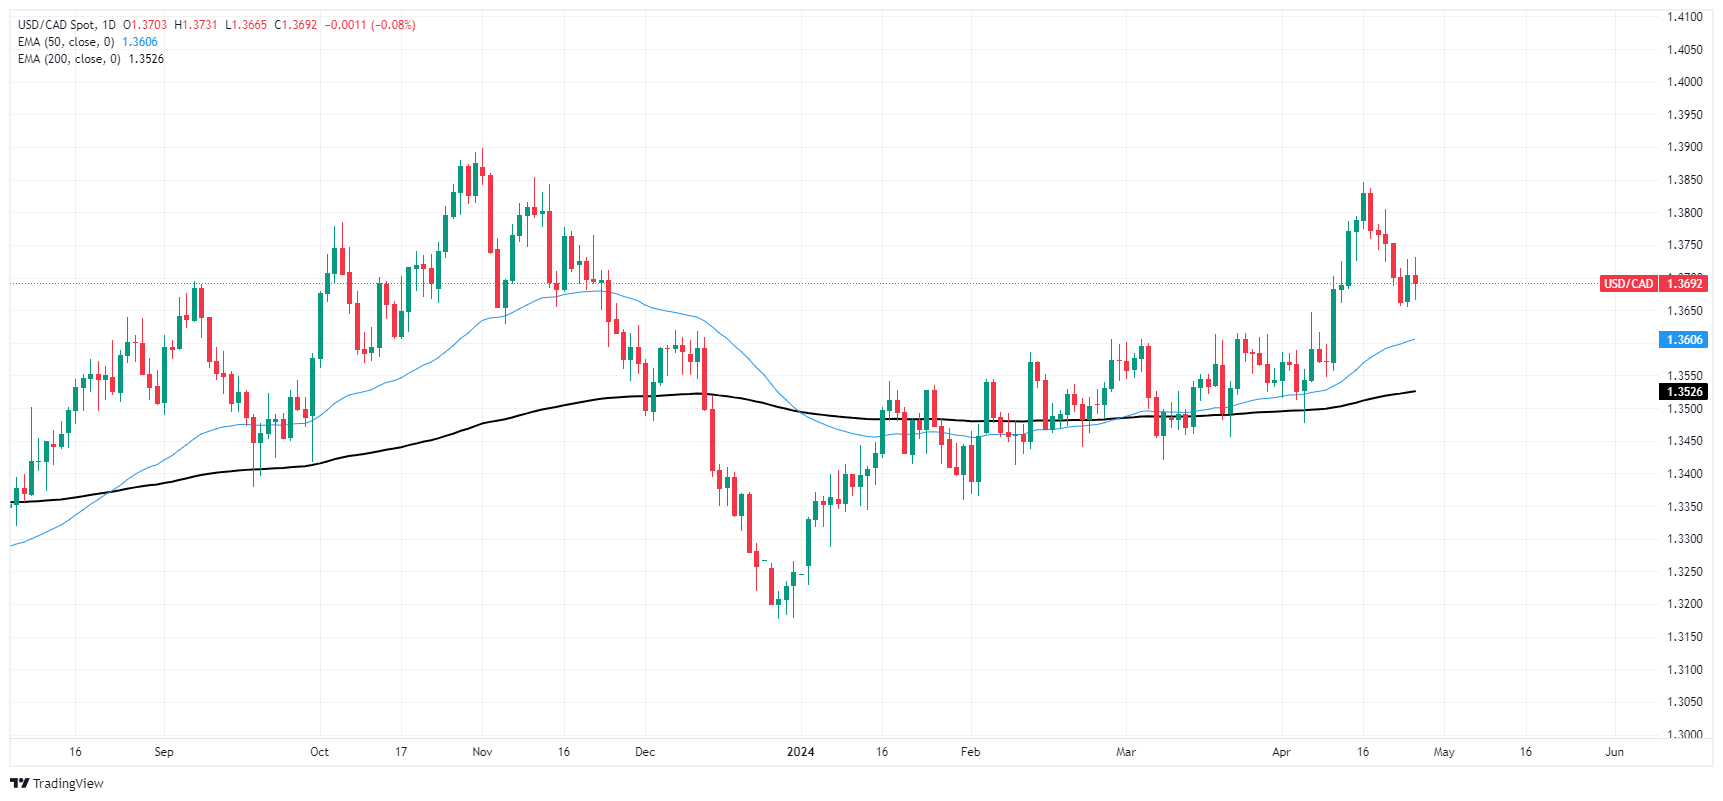
Canadian Dollar FAQs
The key factors driving the Canadian Dollar (CAD) are the level of interest rates set by the Bank of Canada (BoC), the price of Oil, Canada’s largest export, the health of its economy, inflation and the Trade Balance, which is the difference between the value of Canada’s exports versus its imports. Other factors include market sentiment – whether investors are taking on more risky assets (risk-on) or seeking safe-havens (risk-off) – with risk-on being CAD-positive. As its largest trading partner, the health of the US economy is also a key factor influencing the Canadian Dollar.
The Bank of Canada (BoC) has a significant influence on the Canadian Dollar by setting the level of interest rates that banks can lend to one another. This influences the level of interest rates for everyone. The main goal of the BoC is to maintain inflation at 1-3% by adjusting interest rates up or down. Relatively higher interest rates tend to be positive for the CAD. The Bank of Canada can also use quantitative easing and tightening to influence credit conditions, with the former CAD-negative and the latter CAD-positive.
The price of Oil is a key factor impacting the value of the Canadian Dollar. Petroleum is Canada’s biggest export, so Oil price tends to have an immediate impact on the CAD value. Generally, if Oil price rises CAD also goes up, as aggregate demand for the currency increases. The opposite is the case if the price of Oil falls. Higher Oil prices also tend to result in a greater likelihood of a positive Trade Balance, which is also supportive of the CAD.
While inflation had always traditionally been thought of as a negative factor for a currency since it lowers the value of money, the opposite has actually been the case in modern times with the relaxation of cross-border capital controls. Higher inflation tends to lead central banks to put up interest rates which attracts more capital inflows from global investors seeking a lucrative place to keep their money. This increases demand for the local currency, which in Canada’s case is the Canadian Dollar.
Macroeconomic data releases gauge the health of the economy and can have an impact on the Canadian Dollar. Indicators such as GDP, Manufacturing and Services PMIs, employment, and consumer sentiment surveys can all influence the direction of the CAD. A strong economy is good for the Canadian Dollar. Not only does it attract more foreign investment but it may encourage the Bank of Canada to put up interest rates, leading to a stronger currency. If economic data is weak, however, the CAD is likely to fall.
- US Q1 GDP reveals reduced expansion at 1.6% YoY.
- On the positive side, weekly Jobless Claims come in strong.
- Friday’s PCE data from March will dictate the pace of DXY in the short term.
The US Dollar Index (DXY) is seen trading mildly down at 105.75 on Thursday and struggling to gain more ground following its extended rally in April. The Index weakened following Gross Domestic Product (GDP) data from Q1, but losses may be limited after strong labor market data was reported during the European session.
The US economy remains resilient but is expected to grow at a slower pace due to inflation and higher interest rates. The Federal Reserve (Fed) remains firm on its stance and seems to not want to rush to start easing and market hawkish adjustments provide a cushion to the USD. Personal Consumption Expenditures (PCE) data from March will likely affect those investors’ expectations.
Daily digest market movers: DXY down after GDP data
- The Bureau of Economic Analysis’s (BEA) initial estimate revealed a 1.6% YoY annualized expansion in the US Gross Domestic Product (GDP) for January-March.
- GDP figures were below market predictions of a 2.5% annual rise, lagging behind 3.4% YoY growth in Q4 2023.
- The US Department of Labor showed a decrease of 5K in Initial Jobless Claims for the week ending April 20, resulting in a total of 207K Initial Jobless Claims.
- The weekly decline in Initial Jobless Claims surpassed market forecasts, which projected 214K claims, a clear improvement from the prior week's total of 212K.
- Regarding expectations on the Fed, markets bet on 20% odds of a June rate cut. A potential Fed rate cut in July or even September isn't fully assumed either, pointing to strong confidence in ongoing US economic performance that justifies the delay of the easing cycle.
DXY technical analysis: DXY shifts into neutral gear, bears lurk despite bullish undertones
The indicators on the daily chart portray a mixed stance for the DXY. The flat position of the Relative Strength Index (RSI) in positive territory resonates with stagnant buying momentum. Moreover, the decreasing green bars of the Moving Average Convergence Divergence (MACD) reflect a fading bullish sentiment, signaling potential weakness in the near future.
US Dollar FAQs
The US Dollar (USD) is the official currency of the United States of America, and the ‘de facto’ currency of a significant number of other countries where it is found in circulation alongside local notes. It is the most heavily traded currency in the world, accounting for over 88% of all global foreign exchange turnover, or an average of $6.6 trillion in transactions per day, according to data from 2022. Following the second world war, the USD took over from the British Pound as the world’s reserve currency. For most of its history, the US Dollar was backed by Gold, until the Bretton Woods Agreement in 1971 when the Gold Standard went away.
The most important single factor impacting on the value of the US Dollar is monetary policy, which is shaped by the Federal Reserve (Fed). The Fed has two mandates: to achieve price stability (control inflation) and foster full employment. Its primary tool to achieve these two goals is by adjusting interest rates. When prices are rising too quickly and inflation is above the Fed’s 2% target, the Fed will raise rates, which helps the USD value. When inflation falls below 2% or the Unemployment Rate is too high, the Fed may lower interest rates, which weighs on the Greenback.
In extreme situations, the Federal Reserve can also print more Dollars and enact quantitative easing (QE). QE is the process by which the Fed substantially increases the flow of credit in a stuck financial system. It is a non-standard policy measure used when credit has dried up because banks will not lend to each other (out of the fear of counterparty default). It is a last resort when simply lowering interest rates is unlikely to achieve the necessary result. It was the Fed’s weapon of choice to combat the credit crunch that occurred during the Great Financial Crisis in 2008. It involves the Fed printing more Dollars and using them to buy US government bonds predominantly from financial institutions. QE usually leads to a weaker US Dollar.
Quantitative tightening (QT) is the reverse process whereby the Federal Reserve stops buying bonds from financial institutions and does not reinvest the principal from the bonds it holds maturing in new purchases. It is usually positive for the US Dollar.
- EUR/JPY surges to levels not seen since August 2008, capitalizing on a broader Yen weakness.
- Technical indicators suggest potential for further advances after clearing resistance at 165.30, towards the 169.47 high of August 2008.
- Downside risks remain once EUR/JPY retreats below the recent high of 166.22.
The Euro rallied to a near 16-year high against the Japanese Yen, hitting levels last seen in August 2008, with the latter remaining the laggard in the FX space. Data from the United States (US) prompted investors to buy the Greenback, which sent USD/JPY to refresh multi-year highs. Therefore, the EUR/JPY followed suit and trades at 166.67, gaining more than 0.20%.
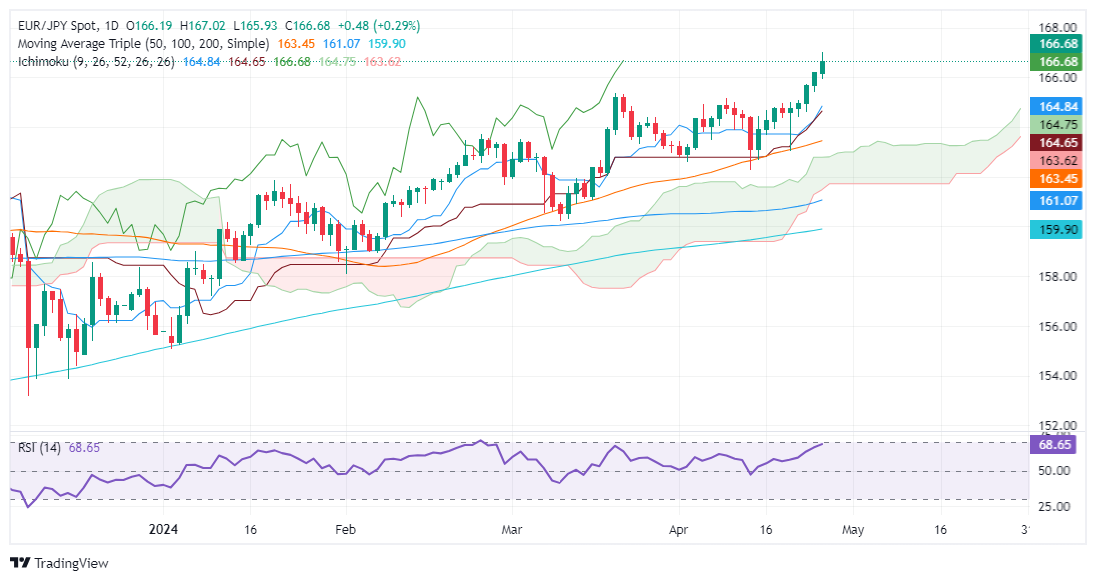
EUR/JPY Price Analysis: Technical outlook
The EUR/JPY is bullish-biased after consolidating since mid-March below the 165.30s area, previously guarded by March’s 20 high at 165.33. The uptrend resumed toward the 166.00 mark, yet once buyers cleared that hurdle, extending the move to 167.00.
Nevertheless, the EUR/JPY has retreated as buyers take a breather. The momentum its on their side, as shown by the Relative Strength Index (RSI) standing at 68.80, shy of signaling the pair is overbought.
If buyers clear 167.00, that will exacerbate a rally to challenge August’s 2008 monthly high at 169.47, ahead of the psychological 170.00 barrier.
On the other hand, if sellers drag the exchange rate below 166.22 April 24 daily high, that could open the door to sliding toward the March 20 high of 165.33. Subsequent losses beyond this support target the confluence of the Tenkan and Kijun-Sen at 164.83/64.
EUR/JPY Price Action – Daily Chart
- AUD/USD falls back down below 0.6500 after US Q1 GDP data reveals persistent price pressures.
- The pair reverses the strong rally that has characterized price action over the past week.
- The Fed is now seen not cutting interest rates till September whilst the consensus for the RBA is November.
AUD/USD trades back below 0.6500 on Thursday, after peaking at 0.6539 earlier in the day. The sudden decline comes after the release of US first quarter GDP data which showed persistent price pressures within the US economy despite an overall slowdown in economic growth.
US preliminary Gross Domestic Product Annualized rose 1.7% in Q1 which was below estimates of 2.5% and the previous quarter's 3.4% reading, according to data from the US Bureau of Economic Analysis, on Thursday.
Yet the US Dollar noted gains across the board following the data, as a key gauge of inflation in the GDP data – the preliminary Gross Domestic Product Price Index for Q1 – showed a rise of 3.1% in prices, which was substantially higher than the 1.7% of the previous quarter.
The GDP price index data suggests stubbornly high inflation in the US economy that will probably lead the Federal Reserve (Fed) to keep interest rates higher for longer. Higher interest rates are in turn positive for USD (negative for AUD/USD) since they attract great inflows of foreign capital.
In addition, the higher-than-expected Core Personal Consumption Expenditures in Q1, which is also a measure of inflation, showed a 3.7% rise QoQ compared to estimates of 3.4% and a previous reading of 2.0%.
After the release of the GDP data, a first interest-rate cut from the Federal Reserve is now not seen until September 2024, carrying a 58.2% probability.
Other relevant data for the US Dollar showed Initial Jobless Claims falling slightly to 207K from 212K when a rise to 214K had been expected, and Pending Home Sales coming in at 3.4% in March, easily beating estimates of 0.3% and February’s 1.6%.
AUD/USD rallied strongly on Wednesday following the release of stickier-than-expected Australian Consumer Price Index (CPI) data for Q1.
The CPI showed a 3.6% rise in Q1 instead of the 3.4% the market had expected. The price stickiness reflected in the data suggests the Reserve Bank of Australia (RBA) will be less likely to cut interest rates in the near-term.
The RBA is still seen as the last major G10 central bank to cut interest rates, according to analysts at Rabobank. A fact, that is providing a backdraught for AUD/USD.
The consensus is for the RBA to cut interest rates in November, however, some analysts, such as those at TD Securities have revised that view and now do not a first rate-cut until February 2025 .
- Silver price may have formed a Bear Flag pattern on the 4-hour chart.
- The pattern suggests a continuation of the bearish trend to targets substantially lower.
- Support from a relic of long-term support and resistance at $25.80 is likely to provide a floor for any sell-off.
Silver (XAG/USD) price may have formed a Bear Flag pattern on the 4-hour chart which bodes ill for the precious metal’s price going forward.
4-hour Chart
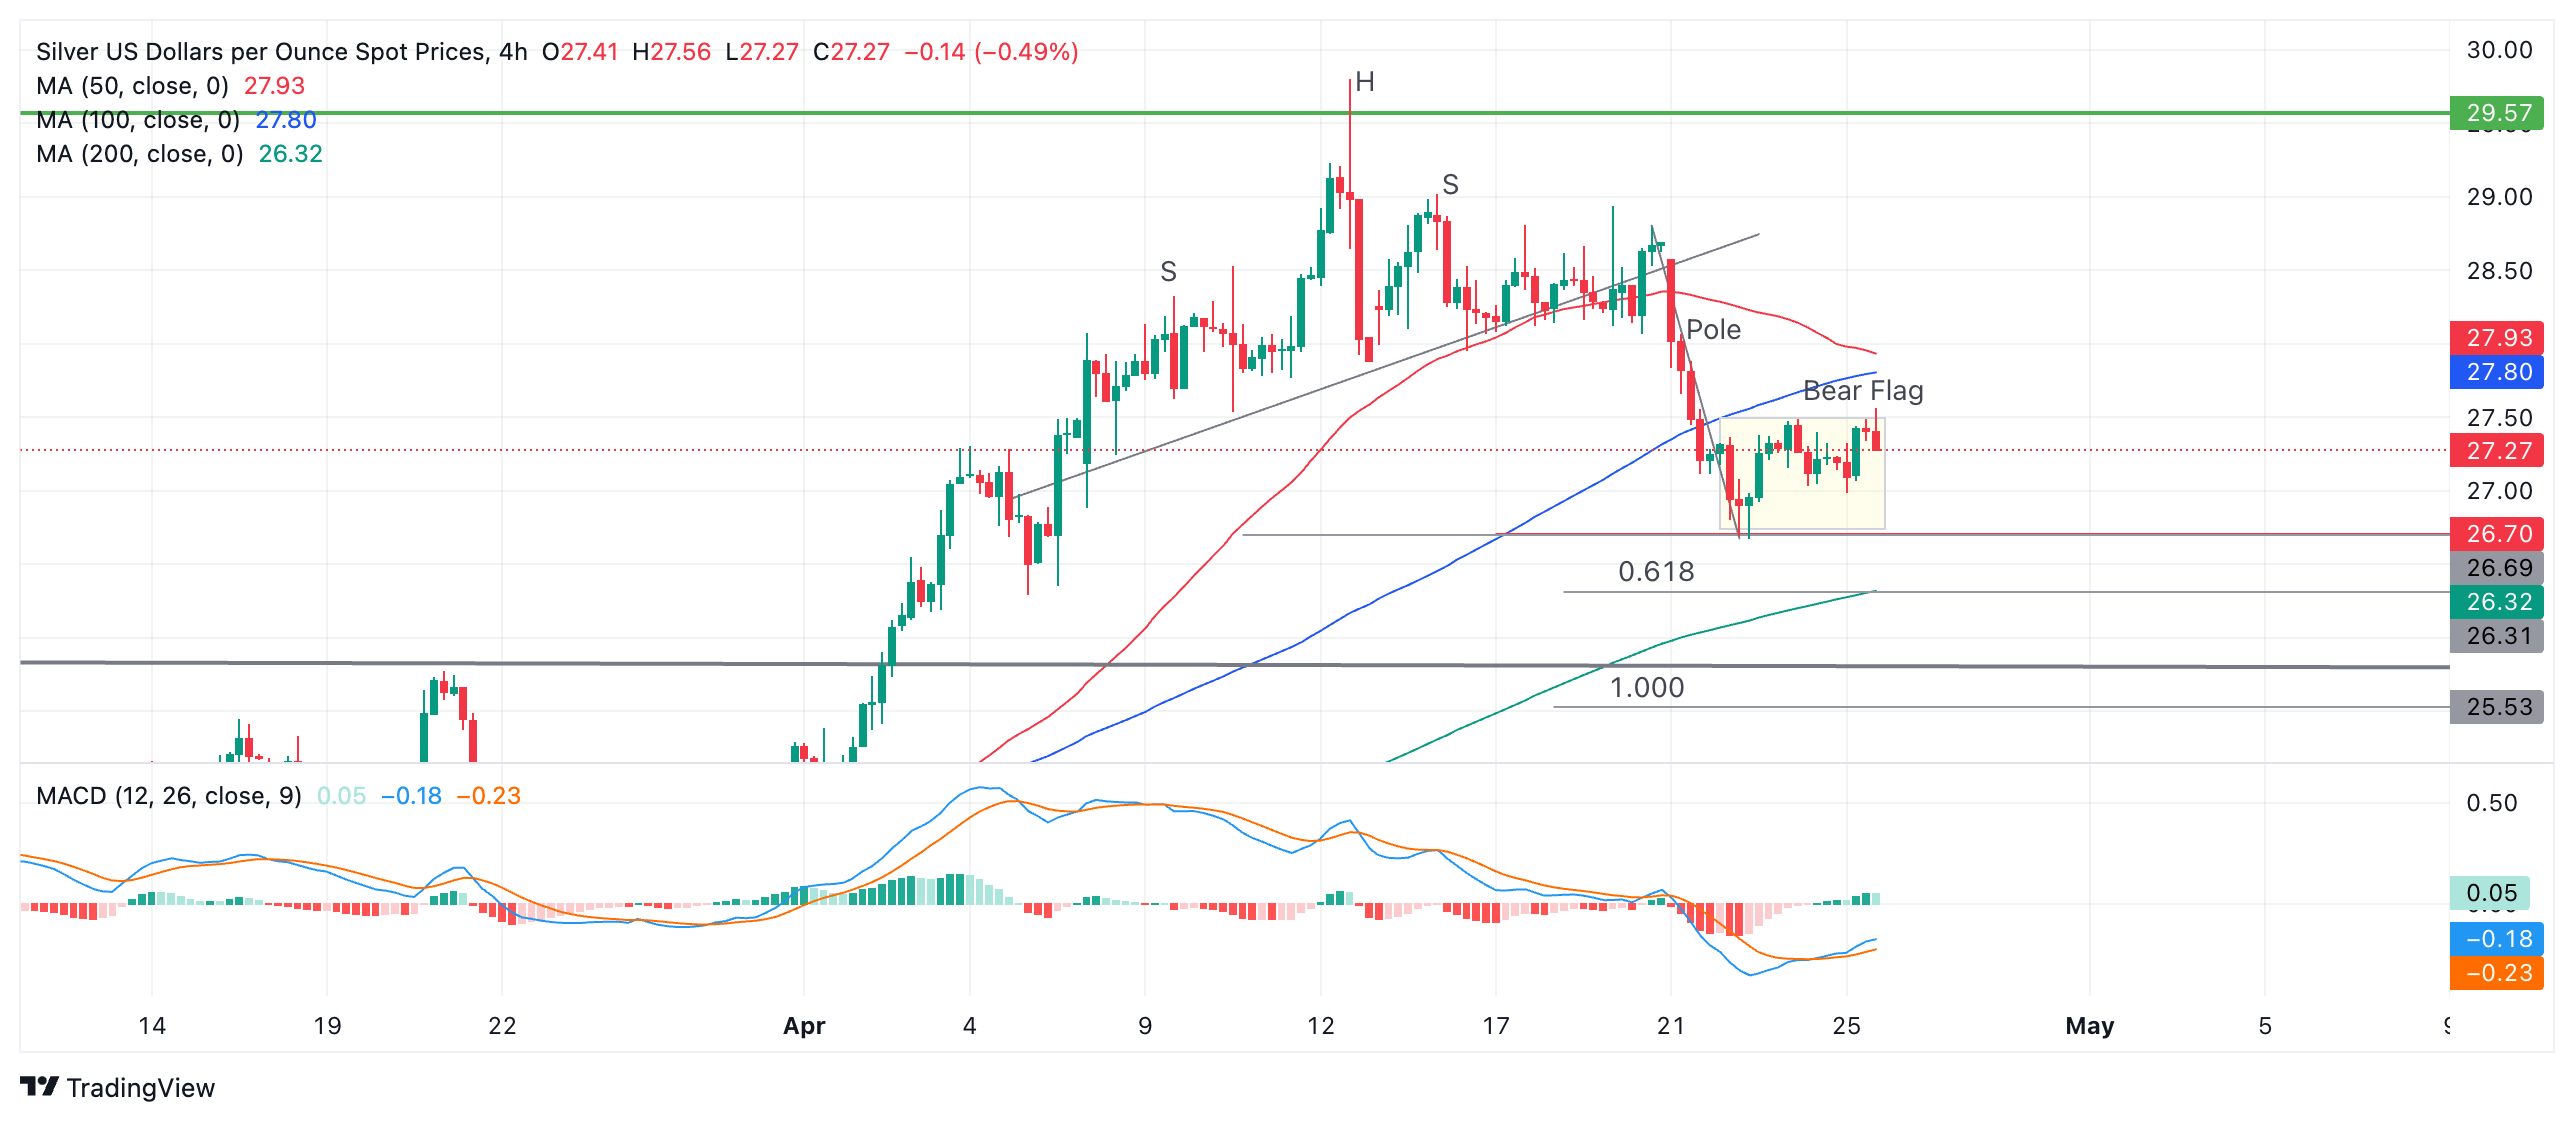
After forming a multiple shouldered Head and Shoulders (H&S) topping pattern at the $30.00 highs of mid-April, Silver price declined to the initial target for the pattern at $26.70. This target was the conservative estimate for the pattern, calculated by taking the height of the H&S and extrapolating the distance by its 0.618 Fibonacci ratio from the neckline underpinning the pattern lower.
After bouncing from a temporary floor at $26.70 Silver price has consolidated forming a rectangle pattern. Taken together with the prior sharp decline the whole formation resembles a Bear Flag pattern.
According to technical lore, the expected move down from a Bear Flag equals the length of the preceding “pole” or a Fibonacci ratio of the pole. In this case the pole is the decline that followed the completion of the H&S pattern.
The Fibonacci 0.618 ratio of the pole on Silver, when extrapolated lower, gives a conservative target at $26.31. If Silver price falls the whole length of the pole (Fib. 1.000), however, it will reach a more "optimistic" target of $25.53.
Tough support from a long-term upper range boundary line at $25.80, however, is likely to offer support before Silver price reaches the lower target for the Bear Flag.
A break below the $26.69 low of April 23 would be required to confirm a breakdown of the Bear Flag towards its targets.
- Initial Jobless Claims in the US decreased by 5,000 in the week ending April 20.
- US Dollar Index clings to modest daily gains above 105.50.
There were 207,000 initial jobless claims in the week ending April 20, the weekly data published by the US Department of Labor (DOL) showed on Thursday. This print followed the previous week's print of 212,000 and came in better than the market expectation of 214,000.
Further details of the publication revealed that the advance seasonally adjusted insured unemployment rate was 1.2% and the 4-week moving average stood at 213,250, a decrease of 1,250 from the previous week's unrevised average.
"The advance number for seasonally adjusted insured unemployment during the week ending April 13 was 1,781,000, a decrease of 15,000 from the previous week's revised level," the publication read.
Market reaction
The US Dollar Index clings to modest daily gains slightly below 106.00 after these data.
- Oil briefly spikes after US weekly EIA data showed a big decline in stockpiles.
- WTI Oil snaps $83, but faces resistance to break back above it again.
- The US Dollar Index retreats further, forming a bearish pattern.
Oil prices edge up on Thursday as traders digest the US Crude Inventory release, which was taken as bullish for near-term prices. Overall, the release showed a chunky draw of 6.368 million barrels, which puts the US inventory at its lowest level since January 19 by 453.6 million barrels. This might trigger some buying from the US Energy Department in order to build up stockpiles again ahead of the next heating season.
The US Dollar Index (DXY) has fallen in a bearish pattern. For a third day in a row, the index is posting lower highs and lower lows on the daily chart. This could point to a gruesome correction ahead, and with preliminary US Gross Domestic Product (GDP) release on Thursday and the Personal Consumption Expenditures (PCE) Price Index on Friday, catalysts are enough to trigger that breakdown.
Crude Oil (WTI) trades at $82.71 and Brent Crude at $87.11 at the time of writing.
Oil news and market movers: Restocking
- Fuel distillate Inventories (gasoil and jet fuel) at the Asian distribution hub of Singapore rose to the highest level since July 2021, according to official data released Thursday, Bloomberg reports.
- Chinese refiners are heading to Venezuela for cheap Oil. Venezuela is offering the discount after the US reimposed sanctions on the South American country.
- Some more details on the Crude stockpile number from the Energy Information Administration (EIA):
- US Gulf Coast refineries are processing the most crude since 2019 ahead of the summer driving season.
- The 6.368 million barrel drawdown in US crude inventories was unexpected – consensus was for a 1.6 million barrel buildup – as refineries ramp up Oil processing following maintenance and exports pick up.
- US Exports ticked above 5 million barrels a day amid robust outflow to Europe.
Oil Technical Analysis: US shooting itself in the foot
Oil prices are set for some buying pressure with US refiners and traders getting ready for the summer season. That always coincides with a lot of travel, be it via airspace (flights) or car (gasoline). With the recent chunky drawdown and nearly lowest level for the year in Crude stockpiles, refiners might ramp up prices.
With geopolitical tensions lingering and the US crude stockpile in low levels, the November 3 high at $83.34 and the $90 handle are the first key levels on the upside. One small barrier in the way is $89.64, the peak from October 20. In case of further escalating tensions, expect even September’s peak at $94 to become a possibility.
On the downside, the October 6 low at $80.63 is the next candidate as a pivotal support level. Below that level, the 55-day and the 200-day Simple Moving Averages (SMAs) at $80.37 and $79.67 should halt any further downturn.
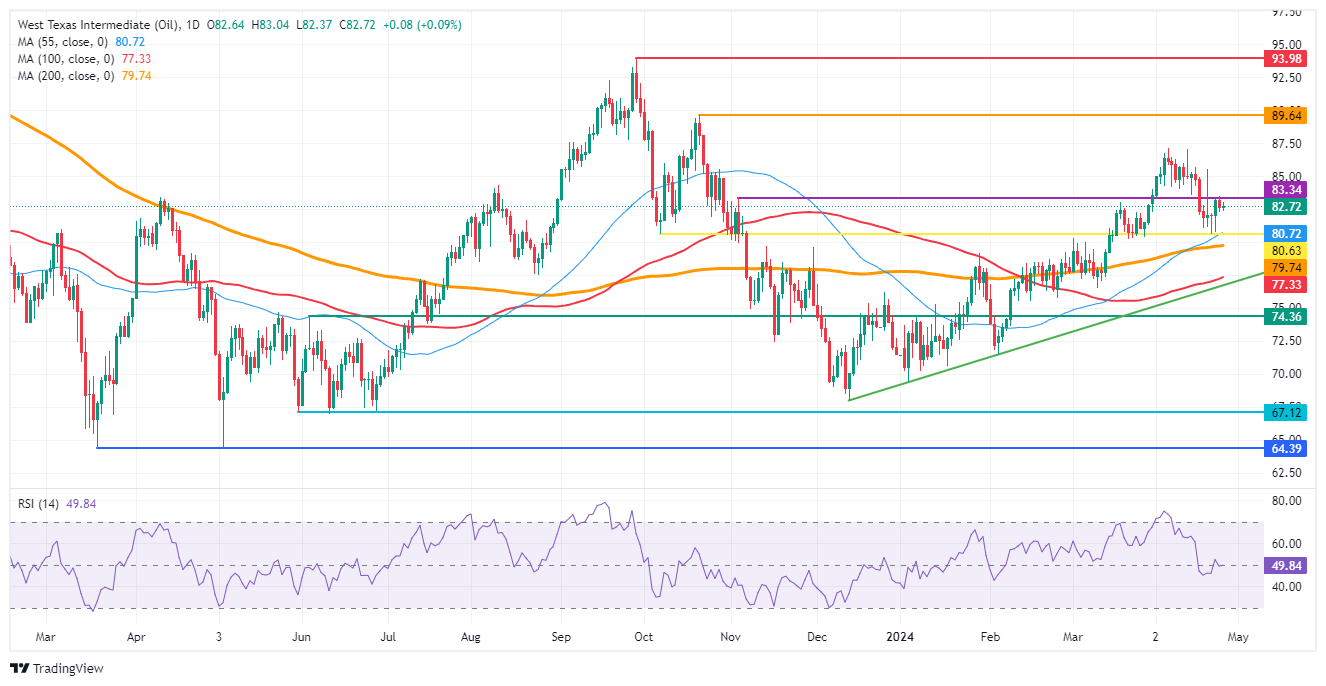
US WTI Crude Oil: Daily Chart
- The USD/JPY extends its uptrend despite verbal intervention from the Minister of Finance.
- The wide differential between US and Japanese interest rates is seen as a major factor contributing to the rise.
- The idea that a lot is already priced into the US Dollar could limit USD/JPY upside.
The USD/JPY trades higher on Thursday, rising into the mid 155.00s, on the back of a recent step-rise in US Treasury Bond yields as the pair shrugs off yet more verbal intervention from the Japanese Finance Minister (MOF) Sunichi Suzuki.
USD/JPY is pressured higher by the wide differential between US and Japanese interest rates, with the US Federal Reserve (Fed) setting the Fed Funds Rate at 5.25% - 5-50% and the Bank of Japan (BoJ) its cash rate at 0.0% - 0.1%. The huge advantage of parking capital in US Dollars (USD) compared to Japanese Yen (JPY) is a constant bullish factor for USD/JPY.
In a statement to Parliament on Thursday, Sunichi Suzuki reiterated the tired phrase that the Finance Ministry would be “watching FX market closely” and “will take appropriate measures” if the Yen depreciates further. Yet his attempts at verbal intervention seem to be losing force with each repetition as the pair pushed higher regardless. Analysts remain skeptical about the impact even of direct intervention on the pair.
“Even actual interventions, if they came, would hardly make a lasting impression on the market, because the MOF's firepower is limited,” says Antje Praefcke, FX Analyst at Commerzbank.
For any lasting effect on the valuation of the Yen, the MOF’s interventions would have to be accompanied by interest rate hikes from the BoJ.
“..interventions would have to be flanked by a credible monetary policy on the part of the BoJ, i.e. a regular cycle of interest rate hikes, in order to be convincing, otherwise they would just be "leaning against the wind" anyway. However, since we do not believe in a rate hike cycle, we simply lack the arguments for a rising JPY,” says Praefcke.
BoJ meeting on the radar
Approaching quickly down the road is the next BoJ policy meeting which is scheduled for 3.00 GMT on Friday morning, but the market does not expect a change in policy so soon after the BoJ hiked interest rates in March. At most Ueda and his team are expected to raise their inflation forecasts.
“The BOJ may raise slightly its 2024 core inflation projections implying greater room to tighten policy and can offer JPY near-term support,” says Brown Brothers Harriman (BBH) in a report.
Core inflation (ex fresh food) in March tracked at 2.6% versus the 2.4% forecast by the BoJ and “core of core” inflation (ex fresh food and energy) at 2.9% versus the 1.9% forecast by the bank.
Tokyo Consumer Price Index (CPI) data, released a few hours prior to the BoJ meeting, could impact deliberations, if it varies substantially from consensus. However, the overall view is that the BoJ is unlikely to actually alter policy much given trend inflation remains below its 2.0% target.
“We are sticking to our view that the BOJ tightening cycle will be modest because underlying inflation in Japan is trending lower. The swap market implies 25 bps of rate hikes in 2024 and 50 bps over the next two years,” says BBH.
US Dollar “already has a lot priced in” – Commerzbank
USD/JPY may be limited in its scope for upside, however, by the fact USD “already has a lot priced in”, according to analysts at Commerzbank.
This is particularly in regards to the acute shift in market expectations regarding the future course of interest rates in the US.
Since the Federal Reserve’s (Fed) March meeting markets have consistently pushed back the date when the Fed is expected to begin cutting interest rates.
This recalibration of the future path of interest rates has now been fully priced in, according to Commerzbank’s Praefcke, and in the absence of more catalysts, makes USD more vulnerable to “bad news” than “good news”.
“..a lot is already priced into the Dollar, such as a soft landing of the economy or a Fed that will only cut the key interest rate much later than previously thought,” says Praefcke.
“It is becoming increasingly difficult for the Dollar to benefit from facts and figures that underpin this expectation (a delay in future rate cuts); on the contrary, it tends to react sensitively when the market has doubts about its current expectation in the face of not-so-good data. The Dollar is gradually running out of steam, although it is currently the undisputed most popular currency and is likely to remain so,” adds the analyst.
If her view is valid it could color the FX market reaction to US first quarter GDP data out on Thursday. Even a better-than-expected result may not push USD/JPY that much higher, whilst a weaker-than-expected result could see the pair drop back more substantially.
- NZD/USD rises to 0.5960 as US Dollar exhibits a weak footing ahead of US Q1 GDP data.
- The consensus shows that the US economy expanded by 2.5% in the January-March period.
- The New Zealand Dollar moves higher on improved demand for risk-perceived currencies.
The NZD/USD pair extends its winning streak for the fourth trading session on Thursday. The Kiwi asset movers higher to 0.5960 as the US Dollar falls further amid concerns over United States economic outlook due to a sharp decline in new business inflows in April, showed by S&P Global preliminary PMI report. The US Dollar Index (DXY), which tracks the US Dollar’s value against six major currencies, drops to 10-day low near 105.50.
Downside move in the US Dollar has improved demand for risk-sensitive currencies. However, the market sentiment remains uncertain as investors turn attention to the preliminary US Q1 GDP data, which will be published at 12:30 GMT. The US economy is projected to have grown at a moderate pace of 2.5% against 3.4% growth witnessed in the final quarter of the last year.
Going forward, investors will also watch the US core Personal Consumption Expenditure Price Index (PCE) data for March, which is a Fed’s preferred inflation measure. The inflation measures is estimated to have grown steadily by 0.3% on a month-on-month basis. This will influence speculation for Federal reserve (Fed) rate cuts, which are currently anticipated from the September meeting.
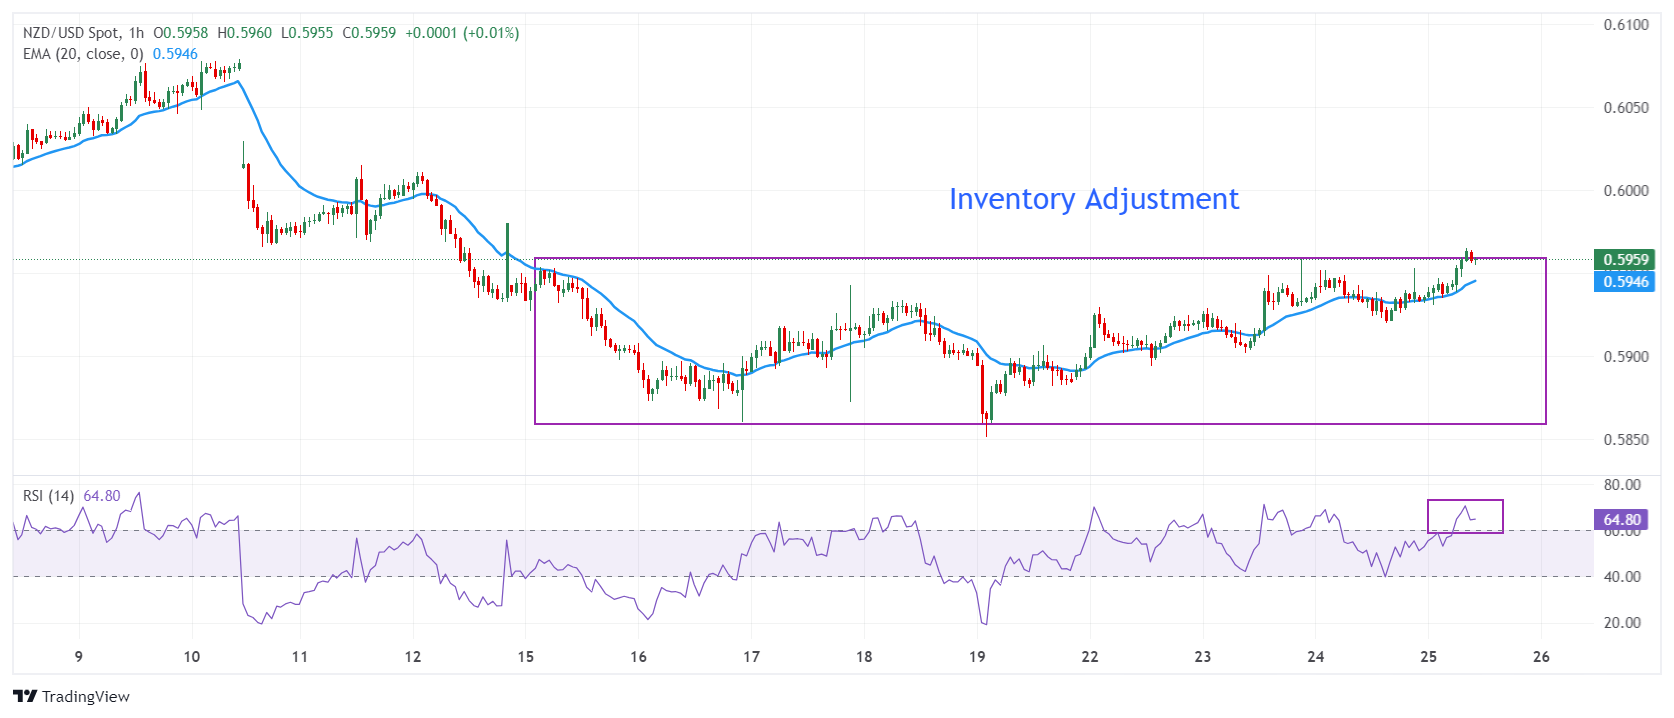
NZD/USD trades close to the upper-end of the inventory adjustment phase in which Kiwi positions are exchanged between institutional investors and retail participants. It is difficult to designate the phase as “accumulation” or “distribution” before a decisive break. The Kiwi asset is expected to deliver a decisive move after the release of the US Q1 GDP data.
Upward-sloping 20-period Exponential Moving Average (EMA) at 0.5947 signifies a bullish near-term appeal for the New Zealand Dollar.
The 14-period Relative Strength Index (RSI) rises above 60.00, suggesting a fresh upside momentum has been triggered.
Further upside above the psychological resistance of 0.6000 will drive the asset towards April 4 high around 0.6050 and the round-level resistance of 0.6100.
On the contrary, a fresh downside would appear if the asset breaks below April 16 low at 0.5860. This would drag the asset toward 8 September 2023 low at 0.5847, followed by the round-level support of 0.5900
NZD/USD hourly chart
- Gold price holds above $2,300 as the US Dollar drops ahead of preliminary US Q1 GDP data.
- The Fed may maintain the “higher for longer” interest rates argument even if GDP growth remains slower than expected.
- The easing of tensions in the Middle East has improved the demand for risky assets.
Gold price (XAU/USD) remains well-supported above the crucial support of $2,300 in Thursday’s European session. The precious metal finds some bids as the US Dollar falls further amid concerns over higher interest rates by the Federal Reserve (Fed), which have impacted economic activity as shown by the S&P Global preliminary PMI report for April.
The near-term outlook for Gold remains weak as Fed policymakers see no urgency for rate cuts due to higher inflationary pressures and tight labor market conditions. Also, safe-haven demand has weakened due to waning fears of widening Middle East conflict.
Meanwhile, upcoming US macro data such as Q1 Gross Domestic Product (GDP) and the core Personal Consumption Expenditure Price Index (PCE) data for March will guide the next move in the Gold price. A significant change in the above-mentioned economic indicators will likely force traders to reassess expectations for the timing of Fed rate cuts. Currently, financial markets anticipate the first cut in September.
Daily digest market movers: Gold price aims for firm footing ahead of US data
- Gold price edges higher above $2,320 as the US Dollar extends its correction. The US Dollar faces selling pressure as weak preliminary PMI numbers for April raised concerns over the US economic outlook. The survey signalled that new business inflows in April fell for the first time in six months.
- Investors will turn their attention to the US Q1 GDP data, a key indicator of the country’s economic performance. The consensus points to a moderate 2.5% expansion, cooling from the 3.4% growth in 2023’s last quarter. Though the world’s largest economy is expected to experience a slower growth rate, growth is expected to be the strongest among the Group of Seven (G7) economies.
- Although it refers to the period from January to March, an upbeat GDP growth rate would set a positive undertone for the US economic outlook and would allow Federal Reserve policymakers to keep the monetary policy stance restrictive for a longer period. This situation would help the US Dollar, and likely weigh on Gold. On the contrary US Dollar is not expected to be hit much by slower-than-expected GDP growth as it is unlikely to scrap the speculation for the Fed to achieve the so-called soft landing, in which the central bank achieves price stability without triggering a recession.
- The week is full of volatile events as the core PCE inflation data will follow the Q1 GDP data – the Fed’s preferred inflation measure – for March, which will be published on Friday. Core PCE inflation is expected to have grown steadily by 0.3% on month, with annual figures softening to 2.6% from the 2.8% recorded in February.
- The underlying inflation data will significantly influence the Fed’s interest rate outlook ahead of its next meeting on May 1. In the May policy meeting, the Fed is widely anticipated to keep interest rates unchanged in the range of 5.25%-5.50%.
Technical Analysis: Gold price trades above $2,300
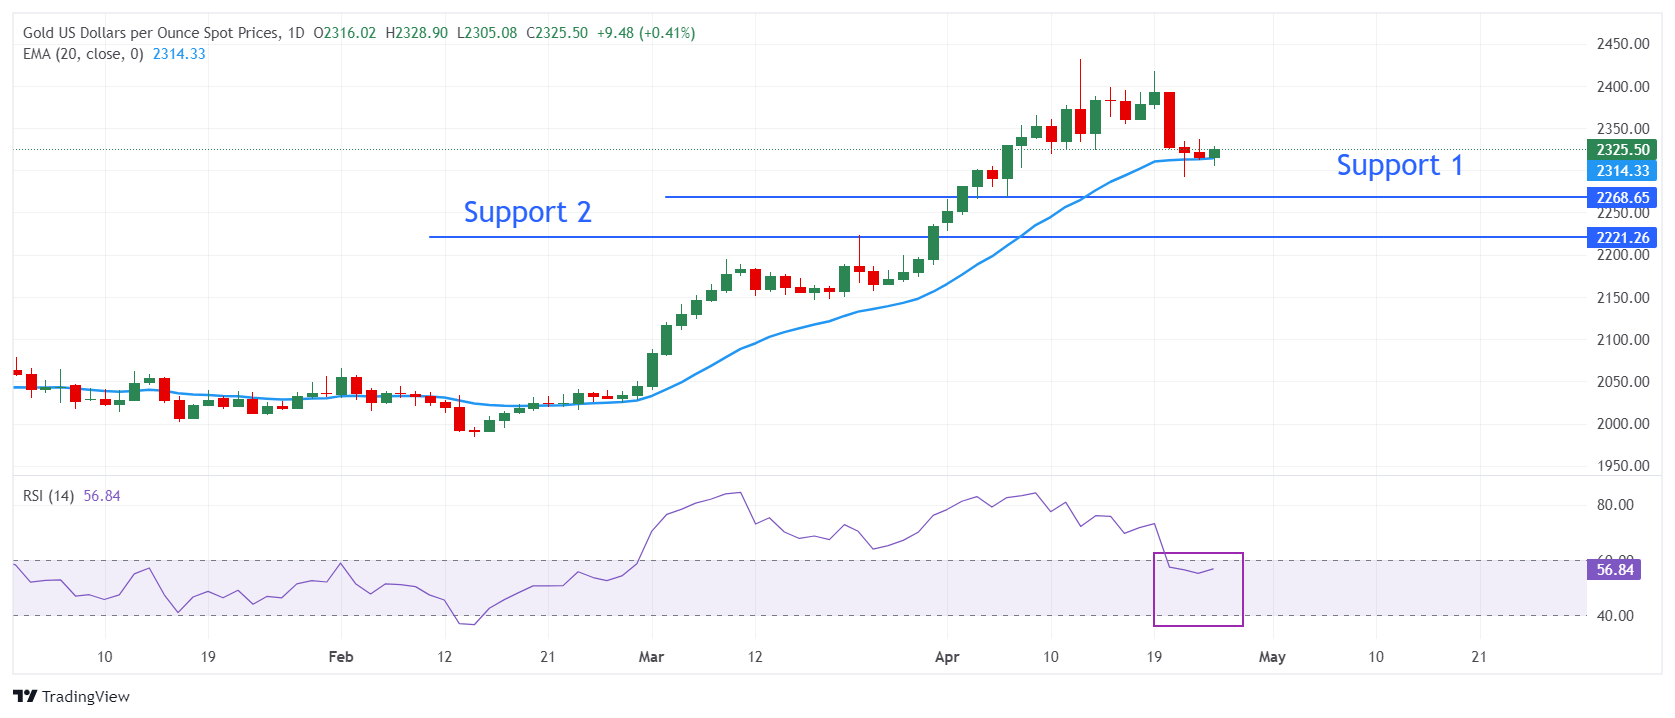
Gold price turns sideways above the round-level support of $2,300 ahead of crucial US data. The 20-day Exponential Moving Average (EMA) at $2,314 provides support to the precious metal, suggesting that the near-term upside remains intact.
On the downside, a three-week low near $2,265 and March 21 high at $2,223 will be major support zones for the Gold price.
The 14-period Relative Strength Index (RSI) falls below 60.00, suggesting that a bullish momentum is weakening. However, the upside bias is intact until the RSI sustains above 40.00.
Gold FAQs
Gold has played a key role in human’s history as it has been widely used as a store of value and medium of exchange. Currently, apart from its shine and usage for jewelry, the precious metal is widely seen as a safe-haven asset, meaning that it is considered a good investment during turbulent times. Gold is also widely seen as a hedge against inflation and against depreciating currencies as it doesn’t rely on any specific issuer or government.
Central banks are the biggest Gold holders. In their aim to support their currencies in turbulent times, central banks tend to diversify their reserves and buy Gold to improve the perceived strength of the economy and the currency. High Gold reserves can be a source of trust for a country’s solvency. Central banks added 1,136 tonnes of Gold worth around $70 billion to their reserves in 2022, according to data from the World Gold Council. This is the highest yearly purchase since records began. Central banks from emerging economies such as China, India and Turkey are quickly increasing their Gold reserves.
Gold has an inverse correlation with the US Dollar and US Treasuries, which are both major reserve and safe-haven assets. When the Dollar depreciates, Gold tends to rise, enabling investors and central banks to diversify their assets in turbulent times. Gold is also inversely correlated with risk assets. A rally in the stock market tends to weaken Gold price, while sell-offs in riskier markets tend to favor the precious metal.
The price can move due to a wide range of factors. Geopolitical instability or fears of a deep recession can quickly make Gold price escalate due to its safe-haven status. As a yield-less asset, Gold tends to rise with lower interest rates, while higher cost of money usually weighs down on the yellow metal. Still, most moves depend on how the US Dollar (USD) behaves as the asset is priced in dollars (XAU/USD). A strong Dollar tends to keep the price of Gold controlled, whereas a weaker Dollar is likely to push Gold prices up.
- The US Dollar is further losing its shine in early Thursday trading.
- Markets are fretting over US GDP and Jobless Claims data.
- The US Dollar Index enters trades in a bearish pattern, potentially signalling more downside ahead.
The US Dollar (USD) is receiving another hit on Thursday and doesn’t seem to need much more to fall against the canvas with a KO. The biggest reason behind the recent decline is the downbeat start of the earnings season in the US. Traders are starting to get worried about the string of earnings that paint a very mixed picture about the economy after META’s results were not well received. These reports come along with announcements of layoffs, adding to signs that the era of job tightness might be coming to an end.
On the economic data front, there is plenty of data to dive into on Thursday ahead of the earnings from Alphabet and Microsoft. The main data point is the preliminary US Gross Domestic Product (GDP) release for Q1. The main focus will be on the headline GDP and the Personal Consumption Expenditure (PCE) component. As per every week, the Jobless Claims are to be released as well, and will get an increased priority in coming weeks to see if those announced layoffs during recent earnings are materialising.
Daily digest market movers: GDP could be the last element before a correction
- A big slew of data is set to be released at 12:30 GMT:
- Weekly Jobless Claims:
- Initial Claims for the week ending on April 19 are expected to head to 214,000 from 212,000.
- Continuing Jobless Claims for the week ending on April 12 are expected to shrink to 1.810 million from 1.812 million.
- US Gross Domestic Product preliminary reading for Q1:
- Headline GDP is expected to shrink to 2.5% from 3.4%.
- Headline PCE was previously at 1.8%, with no forecast available.
- Core PCE is seen rising to 3.4% from 2%.
- GDP Price Index was at 1.7% in Q4 of 2023, with no forecast pencilled in.
- Wholesale Inventories are set to decline further to 0.2% in March from 0.5%.
- Weekly Jobless Claims:
- Monthly Pending Home Sales are expected to increase by 0.3% in March against the previous reading of 1.6%.
- The Kansas Fed Manufacturing Activity for April is set to be published at 14:30 GMT. The previous figure for March was at -9, with no forecast available for April data.
- Equities are looking unstable on Thursday, with Asian equities mixed. Japan closed in the red, with more than 1% losses. In Europe, both the German Dax and broader Stoxx 50 are in the red by 0.5%. Ahead of the US opening bell, the Nasdaq futures are down over 1%.
- The CME Fedwatch Tool suggests there is an 83.1% probability that June will still see no change to the Federal Reserve's feds fund rate. . Odds of a rate cut are broadly at 50%-50% for July, while for September the tool shows a 70% chance that rates will be lower than current levels.
- The benchmark 10-year US Treasury Note trades around 4.64% and keeps lingering around this level.
US Dollar Index Technical Analysis: Is this a turnaround?
The US Dollar Index (DXY) is forming a bearish pattern which often preceds a substantial correction in prices. For a third day in a row, lower highs and lower lows are being printed on the daily chart. This points to relentless selling and builds up pressure for more downside, which can only be halted by strong pivotal support levels.
On the upside, 105.88 (a pivotal level since March 2023) needs to be recovered again before targeting the April 16 high at 106.52. Further up and above the 107.00 round level, the DXY index could meet resistance at 107.35, the October 3 high.
On the downside, 105.12 and 104.60 should act as support ahead of the 55-day and the 200-day Simple Moving Averages (SMAs) at 104.37 and 104.07, respectively. If those levels are unable to hold, the 100-day SMA near 103.70 is the next best candidate.
GDP FAQs
A country’s Gross Domestic Product (GDP) measures the rate of growth of its economy over a given period of time, usually a quarter. The most reliable figures are those that compare GDP to the previous quarter e.g Q2 of 2023 vs Q1 of 2023, or to the same period in the previous year, e.g Q2 of 2023 vs Q2 of 2022. Annualized quarterly GDP figures extrapolate the growth rate of the quarter as if it were constant for the rest of the year. These can be misleading, however, if temporary shocks impact growth in one quarter but are unlikely to last all year – such as happened in the first quarter of 2020 at the outbreak of the covid pandemic, when growth plummeted.
A higher GDP result is generally positive for a nation’s currency as it reflects a growing economy, which is more likely to produce goods and services that can be exported, as well as attracting higher foreign investment. By the same token, when GDP falls it is usually negative for the currency. When an economy grows people tend to spend more, which leads to inflation. The country’s central bank then has to put up interest rates to combat the inflation with the side effect of attracting more capital inflows from global investors, thus helping the local currency appreciate.
When an economy grows and GDP is rising, people tend to spend more which leads to inflation. The country’s central bank then has to put up interest rates to combat the inflation. Higher interest rates are negative for Gold because they increase the opportunity-cost of holding Gold versus placing the money in a cash deposit account. Therefore, a higher GDP growth rate is usually a bearish factor for Gold price.
- The Mexican Peso falls as market sentiment turns negative.
- Equities are down after Meta shares tumbled on Q2 guidance and rising Middle East tensions.
- The Peso loses ground against the Euro after Bund yields spike on Bundesbank president’s comments.
The Mexican Peso (MXN), which is especially sensitive to risk aversion, trades overall lower on Thursday after weakening on souring market sentiment and rising geopolitical tensions. Still, the Peso is holding up against the US Dollar (USD), which sees renewed weakness ahead of the release of key US macroeconomic data.
Mexican Peso hit by negative risk sentiment
The Mexican Peso is losing ground due to a broad dip in market sentiment. Equities are down by 0.66% overnight and Meta’s stock tumbled 15% in after-hours trading on Wednesday despite better-than-expected earnings. The stock’s decline was put down to the company’s Q2 profit guidance, which came in at the lower end of projections, according to analysts at Deutsche Bank.
The Peso may also have been impacted by a notch-rise in geopolitical tensions, after Israel said they had struck around 40 Hezbollah targets in Lebanon.
“Currently, investors don’t appear as concerned as they were last week after Iran’s strikes…However, there are still nerves about the prospect of a further escalation, and the Israeli shekel (-0.26% against the US Dollar) lost ground after the headlines came through,” the Deutsche team wrote in a note on Thursday morning.
Mexican Peso weakens versus Euro
The Mexican Peso is down against the Euro on Thursday after benchmark German Bund yields spiked higher following comments from the President of the Bundesbank and European Central Bank (ECB) governing council member, Joachim Nagel.
Nagel said, on Wednesday, that although the ECB would still probably go ahead with a rate cut in June, further cuts down the road might not follow.
Continued stubborn wage-related inflation in the services sector was the main bugbear, said Nagel, who added that until inflation had come down in a sustainable manner the ECB could not commit to a “pre-commit to a particular rate path.”
Mexican Peso limps higher vs. US Dollar
The Mexican Peso (MXN) limps higher against the US Dollar (USD) in early trading on Thursday after a volatile midweek that saw the Peso eventually lose to the Greenback following better-than-expected US Durable Goods Orders on Wednesday.
The US Census Bureau revealed that Durable Goods Orders in the United States increased 2.6% MoM in March, up from a 0.7% rise previously, and beating estimates of 2.5%. The data provided something of an antidote to the poor performance of US Manufacturing and Services PMI data released on Tuesday.
USD/MXN traders will now look to preliminary US Q1 GDP data out at 12:30 GMT for guidance. If the data shows continued strong growth in the US economy, it could help restore the image of US exceptionalism that has helped propel the Greenback higher in most pairs over recent weeks.
Technical Analysis: USD/MXN corrects in short-term downtrend
USD/MXN corrects in its short-term downtrend but more weakness is probably eventually on the cards.
USD/MXN 4-hour Chart
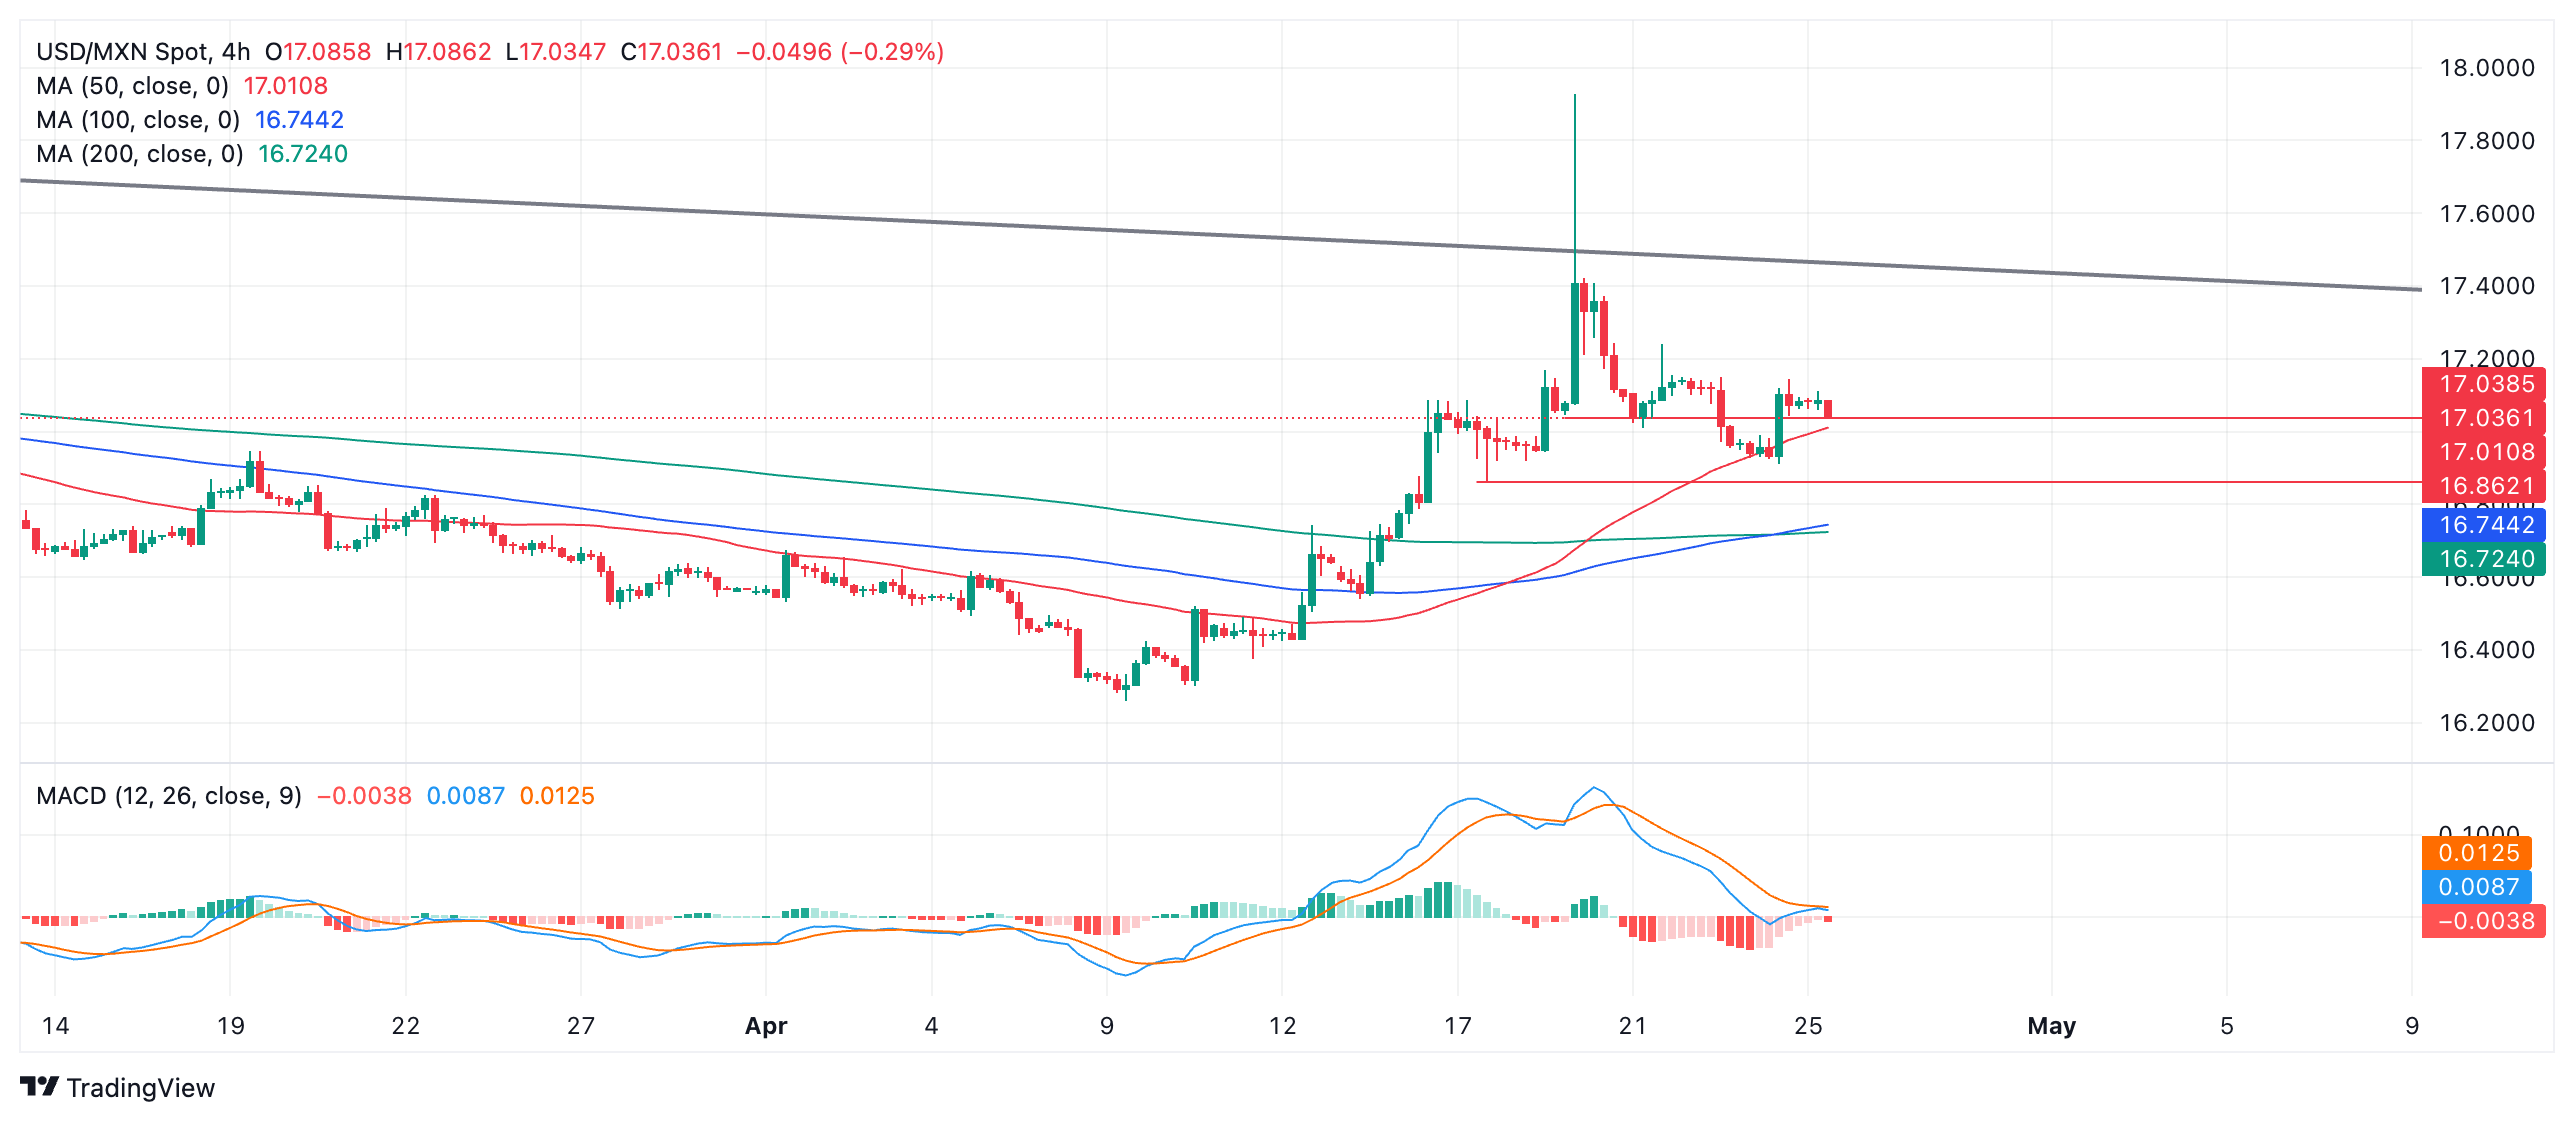
A break below Wednesday’s swing low at 16.91 would confirm further downside to the next key support level at April 17 low at 16.86, where a major Moving Average sits, providing dynamic support on a higher time frame chart. A decisive break below 16.86 could usher in further weakness to 16.50 and then the April 9 low at 16.26.
On the other side, a decisive break above the major trendline for the long-term downtrend at roughly 17.45 will be required to change the trend back to bullish, and activate an upside target at around 18.15.
A decisive break would be one characterized by a longer-than-average green daily candlestick that pierces above the trendline and closes near its high, or three green candlesticks in a row that pierce above the level.
Silver prices (XAG/USD) rose on Thursday, according to FXStreet data. Silver trades at $27.39 per troy ounce, up 0.84% from the $27.16 it cost on Wednesday.
Silver prices have increased by 7.54% since the beginning of the year.
| Unit measure | Today Price |
|---|---|
| Silver price per troy ounce | $27.39 |
| Silver price per gram | $0.88 |
The Gold/Silver ratio, which shows the number of troy ounces of Silver needed to equal the value of one troy ounce of Gold, stood at 84.93 on Thursday, down from 85.26 on Wednesday.
Investors might use this ratio to determine the relative valuation of Gold and Silver. Some may consider a high ratio as an indicator that Silver is undervalued – or Gold is overvalued – and might buy Silver or sell Gold accordingly. Conversely, a low ratio might suggest that Gold is undervalued relative to Silver.
Global Market Movers: Comex Silver price finds buyers near $27 as Dollar drops ahead of US data
- Silver price bounces back as US Dollar drops ahead of US Q1 GDP data.
- Weak S&P Global US preliminary PMI report for April casts doubts over the UK’s economic outlook.
- The US core PCE inflation data will significantly influence the Fed’s interest rate outlook.
- Further, the US Dollar will be tested on the grounds of Q1 preliminary Gross Domestic Product (GDP) data, which will be published on Thursday at 12:30 GMT.
- The US Dollar could see a big reaction to the US data flow, significantly impacting the USD-denominated Silver price.
(An automation tool was used in creating this post.)
Silver FAQs
Silver is a precious metal highly traded among investors. It has been historically used as a store of value and a medium of exchange. Although less popular than Gold, traders may turn to Silver to diversify their investment portfolio, for its intrinsic value or as a potential hedge during high-inflation periods. Investors can buy physical Silver, in coins or in bars, or trade it through vehicles such as Exchange Traded Funds, which track its price on international markets.
Silver prices can move due to a wide range of factors. Geopolitical instability or fears of a deep recession can make Silver price escalate due to its safe-haven status, although to a lesser extent than Gold's. As a yieldless asset, Silver tends to rise with lower interest rates. Its moves also depend on how the US Dollar (USD) behaves as the asset is priced in dollars (XAG/USD). A strong Dollar tends to keep the price of Silver at bay, whereas a weaker Dollar is likely to propel prices up. Other factors such as investment demand, mining supply – Silver is much more abundant than Gold – and recycling rates can also affect prices.
Silver is widely used in industry, particularly in sectors such as electronics or solar energy, as it has one of the highest electric conductivity of all metals – more than Copper and Gold. A surge in demand can increase prices, while a decline tends to lower them. Dynamics in the US, Chinese and Indian economies can also contribute to price swings: for the US and particularly China, their big industrial sectors use Silver in various processes; in India, consumers’ demand for the precious metal for jewellery also plays a key role in setting prices.
Silver prices tend to follow Gold's moves. When Gold prices rise, Silver typically follows suit, as their status as safe-haven assets is similar. The Gold/Silver ratio, which shows the number of ounces of Silver needed to equal the value of one ounce of Gold, may help to determine the relative valuation between both metals. Some investors may consider a high ratio as an indicator that Silver is undervalued, or Gold is overvalued. On the contrary, a low ratio might suggest that Gold is undervalued relative to Silver.
- USD/CAD loses ground due to improving risk appetite.
- The US Dollar depreciates following the subdued US Treasury yields.
- The lower Canadian Retail Sales figures have fueled speculation that the BoC might opt to reduce interest rates in June.
USD/CAD pares its recent gains registered in the previous session, trading around 1.3670 during the European hours on Thursday. The improving risk appetite weakens the US Dollar (USD), undermining the USD/CAD pair.
The US Dollar Index (DXY), which measures the US Dollar (USD) against six major currencies, edging lower to near 105.60, down by 0.23%, by the press time on Thursday. The decline in the US Treasury yields, following mixed manufacturing data from the United States (US), put pressure on the Greenback.
According to the US Department of Commerce's report on Wednesday, US Durable Goods Orders surged by 2.6% month-over-month (MoM) in March, surpassing the previous reading of 0.7% and beating the estimated 2.5%. This marked the largest monthly increase in durable goods orders since last November, driven primarily by strong demand for transport equipment. Meanwhile, core goods, excluding transportation, only increased by 0.2% MoM, falling short of the expected 0.3%.
On Thursday, the preliminary Gross Domestic Product Annualized (Q1) data for the United States (US) is scheduled to be released, with expectations of a slowdown in the growth rate. These GDP figures will provide insights into the strength of the US economy and could potentially influence future actions by the Federal Reserve (Fed).
The Canadian Dollar (CAD) struggled after lower-than-expected Retail Sales data was released on Wednesday. This has sparked speculation that the Bank of Canada (BoC) may consider cutting interest rates at its next meeting in June. This sentiment may weigh on the Loonie Dollar (CAD).
Gold prices rose in India on Thursday, according to data from India's Multi Commodity Exchange (MCX).
Gold price stood at 71,911 Indian Rupees (INR) per 10 grams, up INR 125 compared with the INR 71,786 it cost on Wednesday.
As for futures contracts, Gold prices increased to INR 71,144 per 10 gms from INR 71,050 per 10 gms.
Prices for Silver futures contracts increased to INR 82,568 per kg from INR 82,234 per kg.
| Major Indian city | Gold Price |
|---|---|
| Ahmedabad | 74,195 |
| Mumbai | 73,855 |
| New Delhi | 74,020 |
| Chennai | 74,110 |
| Kolkata | 74,290 |
Global Market Movers: Comex Gold price rebounds amid weaker USD and softer risk tone
- Investors await key US economic data for clarity about the timing when the Federal Reserve will start cutting rates, leading to subdued range-bound price action around the Comex Gold price for the second straight day on Thursday.
- The first estimate, or the Advance US GDP report is due for release later today and is expected to show that the world's largest economy grew by 2.5% annualized pace during the first quarter as compared to the 3.4% previous.
- The focus will then shift to the Fed's preferred inflation gauge – the core Personal Consumption Expenditures (PCE) Price Index – on Friday, which will play a key role in determining the near-term trajectory for the XAU/USD.
- The US Census Bureau reported on Wednesday that Durable Goods Orders climbed 2.6% in March as compared to the previous month's downwardly revised 0.7% increase, while new orders excluding transportation rose 0.2%.
- This comes on the back of strong US consumer inflation figures and hawkish remarks by Fed officials, reaffirming bets that the central bank will not begin its rate-cutting cycle before September and capping the non-yielding metal.
- The global risk sentiment remains supported by easing concerns about a further escalation of geopolitical tensions in the Middle East, which is seen as another factor acting as a headwind for the safe-haven precious metal.
- The US Dollar bulls seem reluctant to place aggressive bets and remain on the defensive ahead of important macro releases, offering some support to the XAU/USD and limiting any meaningful downside for now.
(An automation tool was used in creating this post.)
Gold FAQs
Gold has played a key role in human’s history as it has been widely used as a store of value and medium of exchange. Currently, apart from its shine and usage for jewelry, the precious metal is widely seen as a safe-haven asset, meaning that it is considered a good investment during turbulent times. Gold is also widely seen as a hedge against inflation and against depreciating currencies as it doesn’t rely on any specific issuer or government.
Central banks are the biggest Gold holders. In their aim to support their currencies in turbulent times, central banks tend to diversify their reserves and buy Gold to improve the perceived strength of the economy and the currency. High Gold reserves can be a source of trust for a country’s solvency. Central banks added 1,136 tonnes of Gold worth around $70 billion to their reserves in 2022, according to data from the World Gold Council. This is the highest yearly purchase since records began. Central banks from emerging economies such as China, India and Turkey are quickly increasing their Gold reserves.
Gold has an inverse correlation with the US Dollar and US Treasuries, which are both major reserve and safe-haven assets. When the Dollar depreciates, Gold tends to rise, enabling investors and central banks to diversify their assets in turbulent times. Gold is also inversely correlated with risk assets. A rally in the stock market tends to weaken Gold price, while sell-offs in riskier markets tend to favor the precious metal.
The price can move due to a wide range of factors. Geopolitical instability or fears of a deep recession can quickly make Gold price escalate due to its safe-haven status. As a yield-less asset, Gold tends to rise with lower interest rates, while higher cost of money usually weighs down on the yellow metal. Still, most moves depend on how the US Dollar (USD) behaves as the asset is priced in dollars (XAU/USD). A strong Dollar tends to keep the price of Gold controlled, whereas a weaker Dollar is likely to push Gold prices up.
- GBP/JPY attracts strong follow-through buying for the third successive day on Thursday.
- The lack of decisive action and the BoJ’s uncertain rate outlook weigh heavily on the JPY.
- A modest USD downtick benefits the GBP and also contributes to the positive momentum.
The GBP/JPY cross gains strong positive traction for the third straight day on Thursday and spikes to the 195.00 neighborhood, or its highest level since August 2015 during the first half of the European session.
Despite the recent verbal warnings by Japanese authorities, the lack of any decisive action and the Bank of Japan's (BoJ) cautious approach towards further policy tightening continues to weigh heavily on the Japanese Yen (JPY). This, along with a goodish pickup in demand for the British Pound (GBP), bolstered by a modest US Dollar (USD) weakness, turn out to be key factors that provide a strong boost to the GBP/JPY cross.
The upward trajectory could further be attributed to technical buying following the overnight breakout through the 192.80-192.85 supply zone and a subsequent strength beyond the previous YTD peak, around the 193.50-193.55 region. Hence, it remains to be seen if the bullish run is backed by genuine buying or turns out to be a stop run as the market focus now shifts to the crucial BoJ decision, scheduled to be announced on Friday.
In the meantime, a mildly softer tone around the equity markets could offer some support to the safe-haven JPY. Apart from this, bets that the Bank of England (BoE) could start cutting interest rates, as early as June, might act as a headwind for the GBP. Heading into the key central bank event risk, the fundamental backdrop warrants some caution before positioning for a further appreciating move for the GBP/JPY cross.
“The risks to economic growth remain tilted to the downside,” the European Central Bank’s (ECB) Economic Bulletin showed on Thursday.
Additional takeaways
The Governing Council’s future decisions will ensure that the key ECB interest rates will stay sufficiently restrictive for as long as necessary.
In any event, the Governing Council will continue to follow a data-dependent and meeting-by-meeting approach to determining the appropriate level and duration of restriction, and it is not pre-committing to a particular rate path.
Inflation is expected to fluctuate around current levels in the coming months and to then decline to the 2% target next year.
Growth could be lower if the effects of monetary policy turn out stronger than expected.
- EUR/GBP extends losing streak on growing expectations of BoE delaying rate cuts.
- The gains in the UK 10-year yield enhanced the hawkish expectations for the BoE’s stance on monetary policy.
- ECB's Schnabel noted that the last phase of reaching Eurozone inflation of 2% could be challenging.
The EUR/GBP cross continues to lose ground for the third consecutive session, trading around 0.8570 during the European session on Thursday. The Pound Sterling (GBP) is finding support as the markets anticipate that the Bank of England (BoE) will likely wait until the next quarter to lower borrowing costs, according to median forecasts in a Reuters poll.
Reuters reported on Tuesday that Bank of England Chief Economist Huw Pill said that interest rate cuts are still some way off, even though the passage of time and an absence of negative news on inflation have brought them closer.
The 10-year yield on United Kingdom (UK) government Gilts hovers around 4.31%, nearing five-month highs. The hawkish expectations for the BoE have been amplified by a fresh increase in bond supply by the UK government. Lingering concerns about sticky inflation, coupled with a surprisingly robust domestic Purchasing Managers Index (PMI), have pushed back expectations of the first BoE rate cut.
In Europe, European Central Bank (ECB) policymakers are adhering to plans to lower interest rates this year. ECB President Christine Lagarde stated on Monday that the central bank might decrease its deposit rate from a record-high 4% in June but has kept its options open for further measures, per Reuters report. The dovish stance of the ECB is exerting some selling pressure on the Euro (EUR) and creating headwinds for the EUR/GBP cross.
Furthermore, ECB board member Isabel Schnabel said at a conference on Thursday that the final stage of achieving Eurozone inflation of 2% may encounter obstacles, with erosion in productivity and high service costs posing clear risks. Schnabel highlighted a consensus emerging that the journey to achieving the inflation target could be quite challenging, with services inflation being a significant concern.
On the data front, the German GfK Consumer Confidence Survey for May recorded a reading of -24.2, better than the expected -25.9 and the prior figure of -27.3. German consumer sentiment is anticipated to improve in the coming months, largely supported by better income expectations. UK Consumer Confidence data is scheduled for release on Friday, with expectations of a slight improvement in April.
- Silver price bounces back as US Dollar drops ahead of US Q1 GDP data.
- Weak S&P Global US preliminary PMI report for April casts doubts over the UK’s economic outlook.
- The US core PCE inflation data will significantly influence the Fed’s interest rate outlook.
Silver Price (XAG/USD) finds interim support near $27 in Thursday’s European session after facing a sharp sell-off in the past week. The white metal discovers some buying interest as the US Dollar edges down.
The US Dollar Index (DXY) corrects to near 105.60 after the S&P Global United States preliminary PMI for April reported that the inflow of new business fell for the first time in six months, which raised doubts over a strong economic outlook. However, the broader-term outlook of the US Dollar has not faded yet as Federal Reserve (Fed) policymakers have been emphasizing maintaining the current policy framework for a longer period, considering strong labour demand and stubbornly higher inflation data.
Going forward, the US Dollar will be tested on the grounds of Q1 preliminary Gross Domestic Product (GDP) data, which will be published at 12:30 GMT. The US economy is estimated to have expanded by 2.5%, at a slower pace than the 3.5% growth recorded in the last quarter of 2023. A strong US GDP data would improve speculation for a soft landing by the Fed. The soft landing is a situation in which the central bank achieves price stability without triggering a recession.
10-year US Treasury yields trade close to 4.65% exhibiting consolidation ahead of the US core Personal Consumption Expenditure Price Index (PCE) data for March, which will be published on Friday. The underlying inflation data will significantly influence market expectations about when the Fed will start reducing interest rates. Higher bond yields negatively impact the appeal of non-yielding assets, such as Silver, by increasing the cost of holding an investment in it.
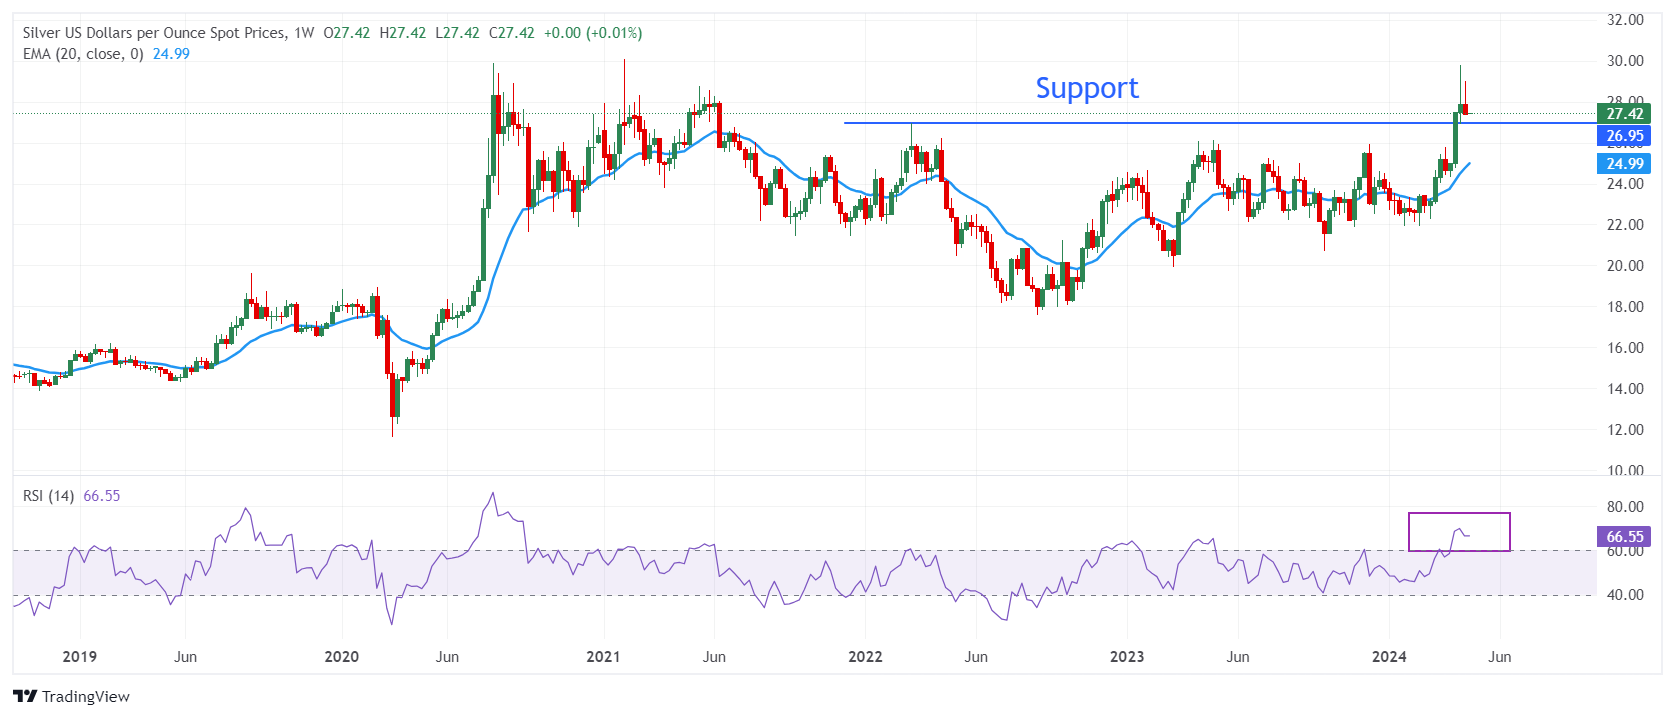
Silver technical analysis
Silver price corrects to near March 2022 high near $27.00 after failing to extend upside above the crucial resistance of $30.00. The near-term appeal for Silver remains strong as the 20-week Exponential Moving Average (EMA) at $25.00 is sloping higher.
The 14-period Relative Strength Index (RSI) oscillates in the bullish range of 60.00-80.00, suggesting a firm bullish momentum.
Silver weekly chart
European Central Bank (ECB) executive board member Isabel Schnabel said in her scheduled appearance on Thursday that the “biggest concern is clearly services inflation."
Additional comments
"There is a consensus emerging that we may be facing a quite bumpy last mile.”
"The more concerning part is productivity growth."
“We've had negative productivity growth now over several quarters."'
Meanwhile, ECB Policymaker Madis Muller said that “I'm not comfortable starting with back-to-back cuts.”
Market reaction
EUR/USD is holding higher ground near 1.0725, unfazed by the above comments. The pair is up 0.25% on the day.
ECB FAQs
The European Central Bank (ECB) in Frankfurt, Germany, is the reserve bank for the Eurozone. The ECB sets interest rates and manages monetary policy for the region. The ECB primary mandate is to maintain price stability, which means keeping inflation at around 2%. Its primary tool for achieving this is by raising or lowering interest rates. Relatively high interest rates will usually result in a stronger Euro and vice versa. The ECB Governing Council makes monetary policy decisions at meetings held eight times a year. Decisions are made by heads of the Eurozone national banks and six permanent members, including the President of the ECB, Christine Lagarde.
In extreme situations, the European Central Bank can enact a policy tool called Quantitative Easing. QE is the process by which the ECB prints Euros and uses them to buy assets – usually government or corporate bonds – from banks and other financial institutions. QE usually results in a weaker Euro. QE is a last resort when simply lowering interest rates is unlikely to achieve the objective of price stability. The ECB used it during the Great Financial Crisis in 2009-11, in 2015 when inflation remained stubbornly low, as well as during the covid pandemic.
Quantitative tightening (QT) is the reverse of QE. It is undertaken after QE when an economic recovery is underway and inflation starts rising. Whilst in QE the European Central Bank (ECB) purchases government and corporate bonds from financial institutions to provide them with liquidity, in QT the ECB stops buying more bonds, and stops reinvesting the principal maturing on the bonds it already holds. It is usually positive (or bullish) for the Euro.
- EUR/USD extends its recovery as mixed US data weighs on the US Dollar.
- The US Dollar may also now already have “a lot priced in” according to analysts at Commerzbank.
- The short-term trend could now be bullish on the 4-hour chart.
EUR/USD sherpa-treks higher on Thursday, with a foothold now above 1.0700 as it continues its labored recovery from the 1.0601 April lows. Recent mixed US data has tarnished the image of the US economy, undermining the supremacy of the US Dollar (USD), whilst the Euro (EUR) holds firm on strong services-sector data.
EUR/USD rises as US data mixed
EUR/USD began its recovery on Tuesday after preliminary US PMI data for April showed an unexpected cooling in business activity, suggesting the economy was beginning to feel the burden of higher interest rates.
On Wednesday, the US Census Bureau revealed that Durable Goods Orders in the United States increased 2.6% MoM in March, up from a 0.7% rise previously, and beating estimates of 2.5%. Core goods, which exclude transportation, increased by 0.2% MoM, an improvement over February's 0.1% increase, but short of the 0.3% projected.
Whilst the Durable Goods data was positive, it failed to move USD. This could be because it is viewed as a volatile series or, as some now think, because a lot is already priced into the Dollar, making it less sensitive to positive data.
“A lot is already priced into the Dollar” – Commerzbank
EUR/USD’s recovery may be due to the US Dollar having priced in a lot, in particular the acute shift in market expectations regarding the future course of interest rates, according to Analysts at Commerzbank.
Since the Federal Reserve’s (Fed) March meeting markets have consistently pushed back the date by when the Fed is likely to begin cutting interest rates – higher interest rates attract more foreign capital inflows and are thus positive for the US Dollar.
This recalibration of the future path of interest rates has now been fully priced in, according to Antje Praefcke, FX Analyst at Commerzbank, and in the absence of more catalysts, makes USD more vulnerable to “bad news” than “good news”.
“In my opinion, the market's reaction (USD falling this week) shows that a lot is already priced into the Dollar, such as a soft landing of the economy or a Fed that will only cut the key interest rate much later than previously thought,” says Praefcke.
The US Dollar having “priced in a lot” is why it reacted more to the poor US PMI data on Tuesday than the positive US Durable Goods Order data on Wednesday.
“It is becoming increasingly difficult for the Dollar to benefit from facts and figures that underpin this expectation (a delay in future rate cuts); on the contrary, it tends to react sensitively when the market has doubts about its current expectation in the face of not-so-good data. The Dollar is gradually running out of steam, although it is currently the undisputed most popular currency and is likely to remain so,” adds the Analyst.
EUR/USD rises due to services-sector effect
The Euro (EUR), meanwhile, stabilizes as strong Services PMI data stokes services-sector inflation expectations. This is seen potentially reigning in the European Central Bank (ECB) as it forges ahead with cutting interest rates.
Although a June rate cut is probably still a “fait accomplis”, according to Luis de Guindos, the Vice President of the ECB, his colleague at the ECB, Bundesbank President Joachim Nagel was more cautious on Wednesday.
Nagel said, “Services inflation remains high, driven by continued strong wage growth,” and until inflation fell in a sustainable manner he could not “pre-commit to a particular rate path.”
Technical Analysis: EUR/USD breaks out of short-term range
EUR/USD has broken out of the rectangular range it was trading in on the 4-hour chart by piercing above the ceiling at 1.0700.
It is now less certain EUR/USD is forming a Bear Flag price pattern, which has become deformed by the breakout.
EUR/USD 4-hour Chart
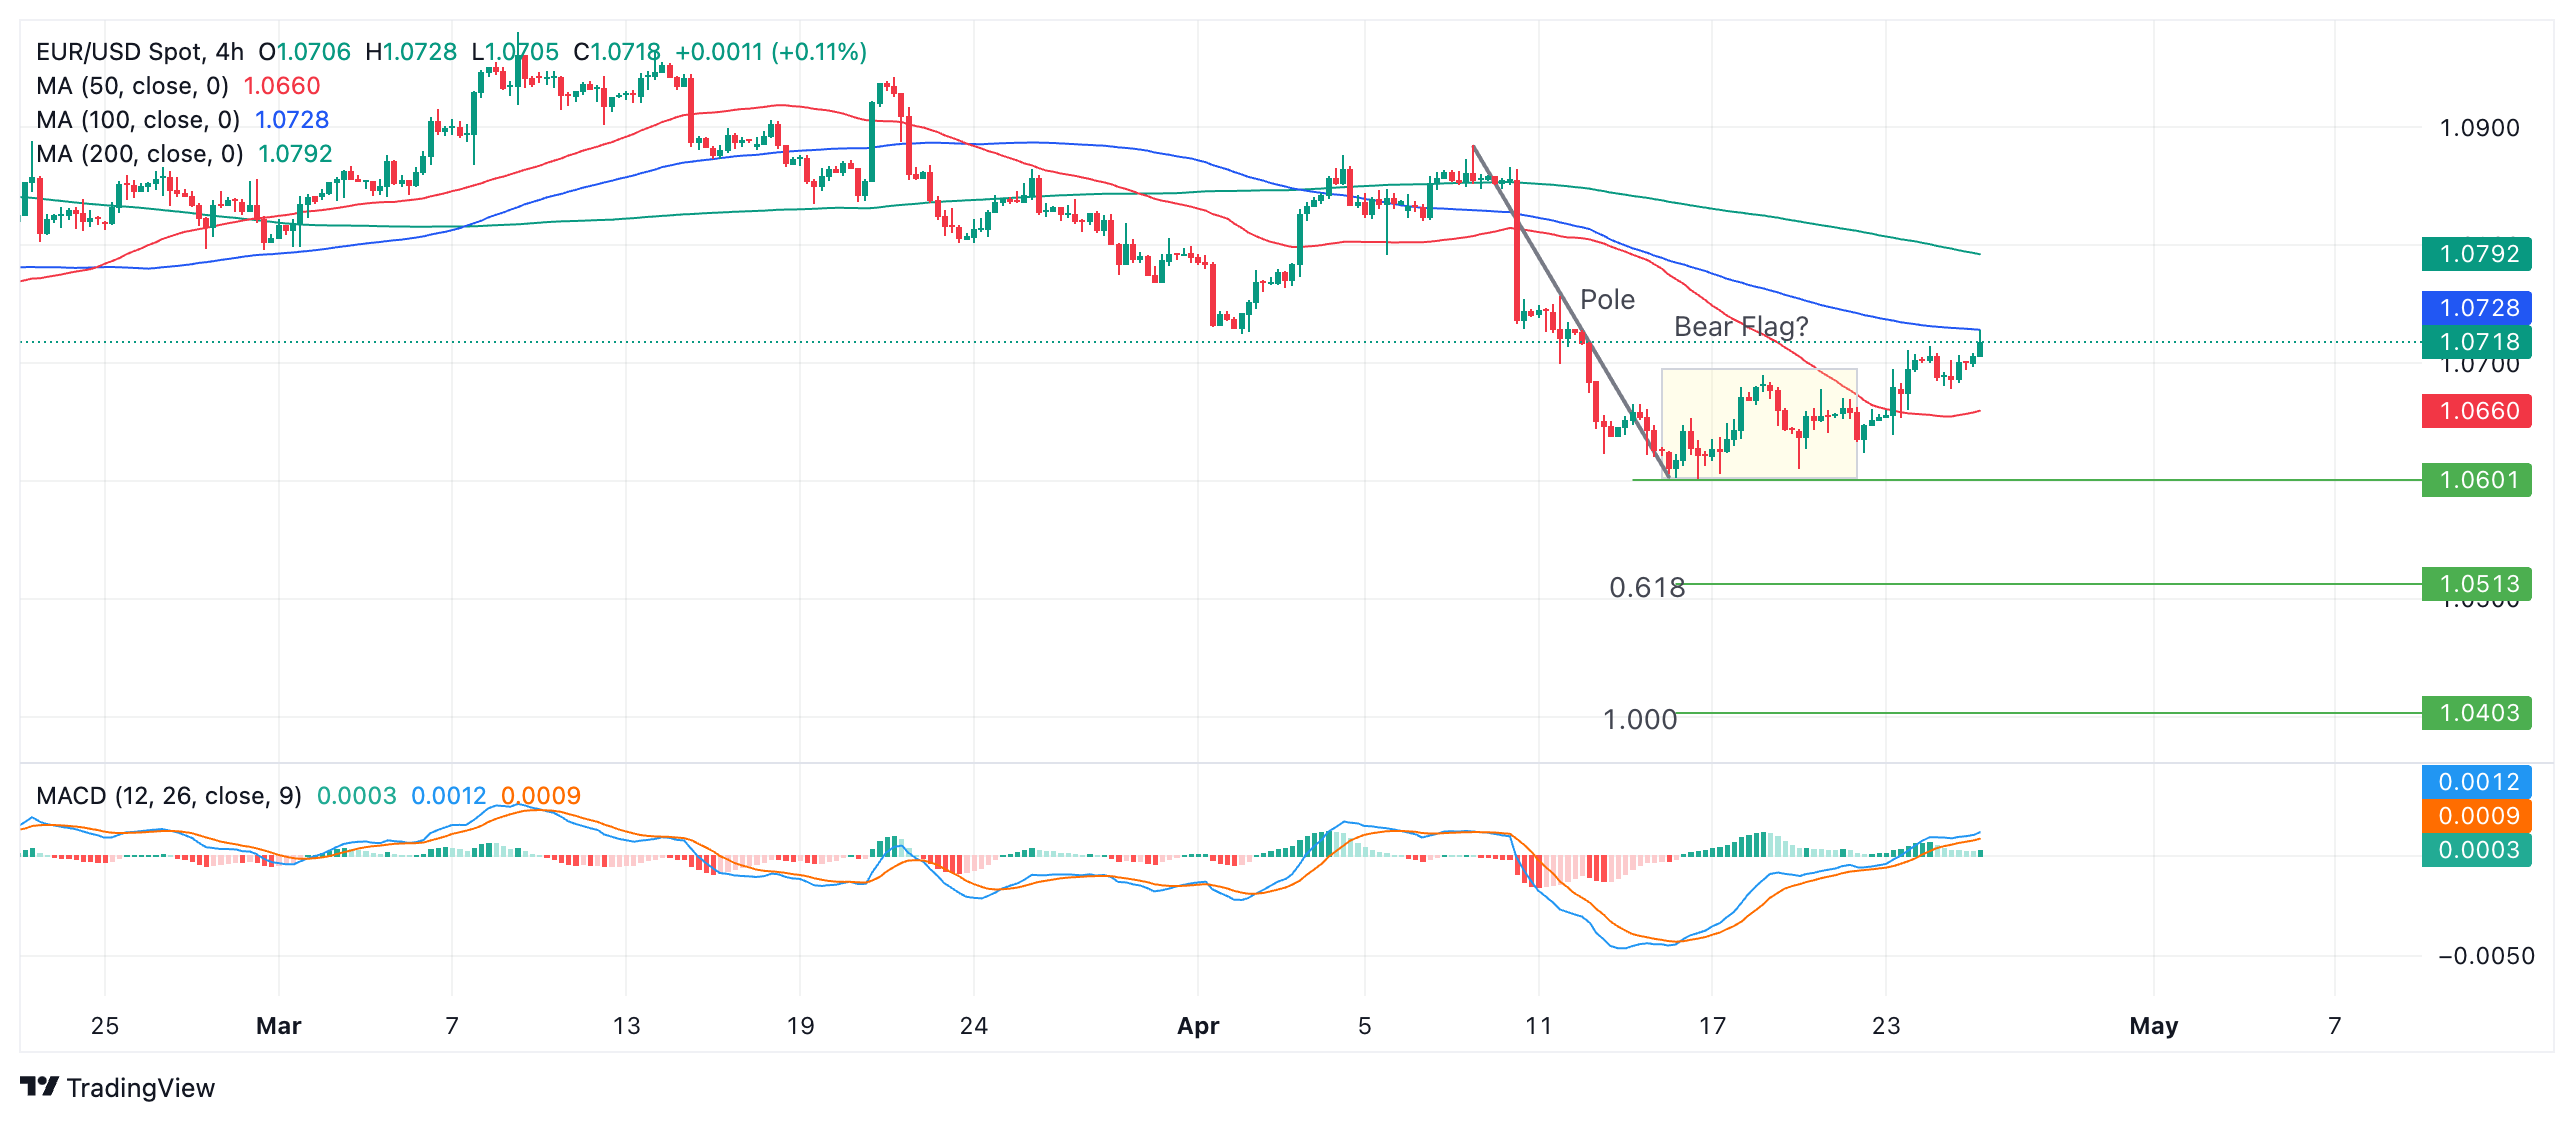
There is an argument for the short-term trend now being bullish and therefore suggestive of more gains in the pair. Resistance from a previous lower high on April 11 gives an initial target at 1.0757. Then the 50-day and 200-day Simple Moving Averages (SMA) on the daily chart (not shown) are likely to resist at 1.0807.
On the other hand a break below the 1.0601 April 16 low would revive the Bear Flag hypothesis.
According to technical lore, the expected move down from a Bear Flag equals the length of the preceding “pole” or a Fibonacci ratio of the pole.
The Fibonacci 0.618 ratio of the pole extrapolated lower gives a conservative target at 1.0503. The next concrete target is at 1.0448 – the October 2023 low. A fall of equal length to the pole would take EUR/USD to 1.0403.
Euro FAQs
The Euro is the currency for the 20 European Union countries that belong to the Eurozone. It is the second most heavily traded currency in the world behind the US Dollar. In 2022, it accounted for 31% of all foreign exchange transactions, with an average daily turnover of over $2.2 trillion a day. EUR/USD is the most heavily traded currency pair in the world, accounting for an estimated 30% off all transactions, followed by EUR/JPY (4%), EUR/GBP (3%) and EUR/AUD (2%).
The European Central Bank (ECB) in Frankfurt, Germany, is the reserve bank for the Eurozone. The ECB sets interest rates and manages monetary policy. The ECB’s primary mandate is to maintain price stability, which means either controlling inflation or stimulating growth. Its primary tool is the raising or lowering of interest rates. Relatively high interest rates – or the expectation of higher rates – will usually benefit the Euro and vice versa. The ECB Governing Council makes monetary policy decisions at meetings held eight times a year. Decisions are made by heads of the Eurozone national banks and six permanent members, including the President of the ECB, Christine Lagarde.
Eurozone inflation data, measured by the Harmonized Index of Consumer Prices (HICP), is an important econometric for the Euro. If inflation rises more than expected, especially if above the ECB’s 2% target, it obliges the ECB to raise interest rates to bring it back under control. Relatively high interest rates compared to its counterparts will usually benefit the Euro, as it makes the region more attractive as a place for global investors to park their money.
Data releases gauge the health of the economy and can impact on the Euro. Indicators such as GDP, Manufacturing and Services PMIs, employment, and consumer sentiment surveys can all influence the direction of the single currency. A strong economy is good for the Euro. Not only does it attract more foreign investment but it may encourage the ECB to put up interest rates, which will directly strengthen the Euro. Otherwise, if economic data is weak, the Euro is likely to fall. Economic data for the four largest economies in the euro area (Germany, France, Italy and Spain) are especially significant, as they account for 75% of the Eurozone’s economy.
Another significant data release for the Euro is the Trade Balance. This indicator measures the difference between what a country earns from its exports and what it spends on imports over a given period. If a country produces highly sought after exports then its currency will gain in value purely from the extra demand created from foreign buyers seeking to purchase these goods. Therefore, a positive net Trade Balance strengthens a currency and vice versa for a negative balance.
- The Pound Sterling rises to 1.2500 on multiple tailwinds.
- BoE Governor Andrew Bailey expects a sharp drop in April’s inflation.
- The US Dollar remains under pressure ahead of US Q1 GDP and core PCE Inflation data.
The Pound Sterling (GBP) advances to near the psychological resistance of 1.2500 against the US Dollar (USD) in Thursday’s London session. The GBP/USD pair capitalizes on expectations of an improvement in the United Kingdom’s economic outlook and a decline in the US Dollar.
Investors’ confidence in the UK economy's outlook improved after the preliminary PMI report from S&P Global/CIPS for April showed that new business volumes increased across the private sector as a whole. The agency also reported that the rate of growth of overall activity was the strongest since May 2023. However, the expansion was centred on the service sector, as manufacturers saw a moderate downturn in order books.
Despite the recent upturn, downside risks to Pound Sterling remain high as investors expect the Bank of England (BoE) will pivot to interest-rate cuts before the Federal Reserve (Fed) does so. Last week, BoE Governor Andrew Bailey said: “I expect next month's inflation number will show quite a strong drop.” Bailey added that Oil prices haven't leaped as much as expected and that the effect of the Middle-East conflict “is less than feared.”
Daily digest market movers: Pound Sterling prints a fresh 10-day high
- The Pound Sterling extends its upside above Wednesday’s high at 1.2470 against the US Dollar. The recent United States preliminary PMI report has raised doubts over the strong economic outlook of the economy. Meanwhile, similar data for the UK presented a recovery in overall private-sector activity fueled by the Services sector.
- The US PMI report showed on Tuesday that surprisingly both the Manufacturing and Services PMI were down from the prior readings. The Manufacturing PMI even fell below the 50.0 threshold, signalling a contraction. Chris Williamson, Chief Business Economist at S&P Global Market Intelligence, said: “The US economic upturn lost momentum at the start of the second quarter, with the flash PMI survey respondents reporting below-trend business activity growth in April. Further pace may be lost in the coming months, as April saw inflows of new business fall for the first time in six months and firms’ future output expectations slipped to a five-month low amid heightened concern about the outlook.
- Despite the downbeat PMI figures, the speculation for the Federal Reserve beginning to lower interest rates from the September meeting remains firm. Going forward, investors will focus on the Q1 preliminary Gross Domestic Product (GDP) and the core Personal Consumption Expenditure Price Index (PCE) data for March.
- The Q1 US GDP data, which will be published at 12:30 GMT, is expected to show that the economy expanded at a slower rate of 2.5% compared with the 3.4% growth recorded in the last quarter of 2023. The GDP data is a lagging indicator of the economic performance of an economy. A high GDP exhibits strong demand from consumers and higher production levels by firms, which are generally translated into high inflationary pressures. This will force the Fed to keep interest rates restrictive for a longer period.
- For more clarity over Fed’s rate-cut timing, investors will wait for the core PCE inflation data for March, to be published on Friday. The underlying inflation data is estimated to have grown steadily by 0.3% on month, with annual figures softening to 2.6% from the 2.8% recorded in February.
Technical Analysis: Pound Sterling climbs to 1.2500
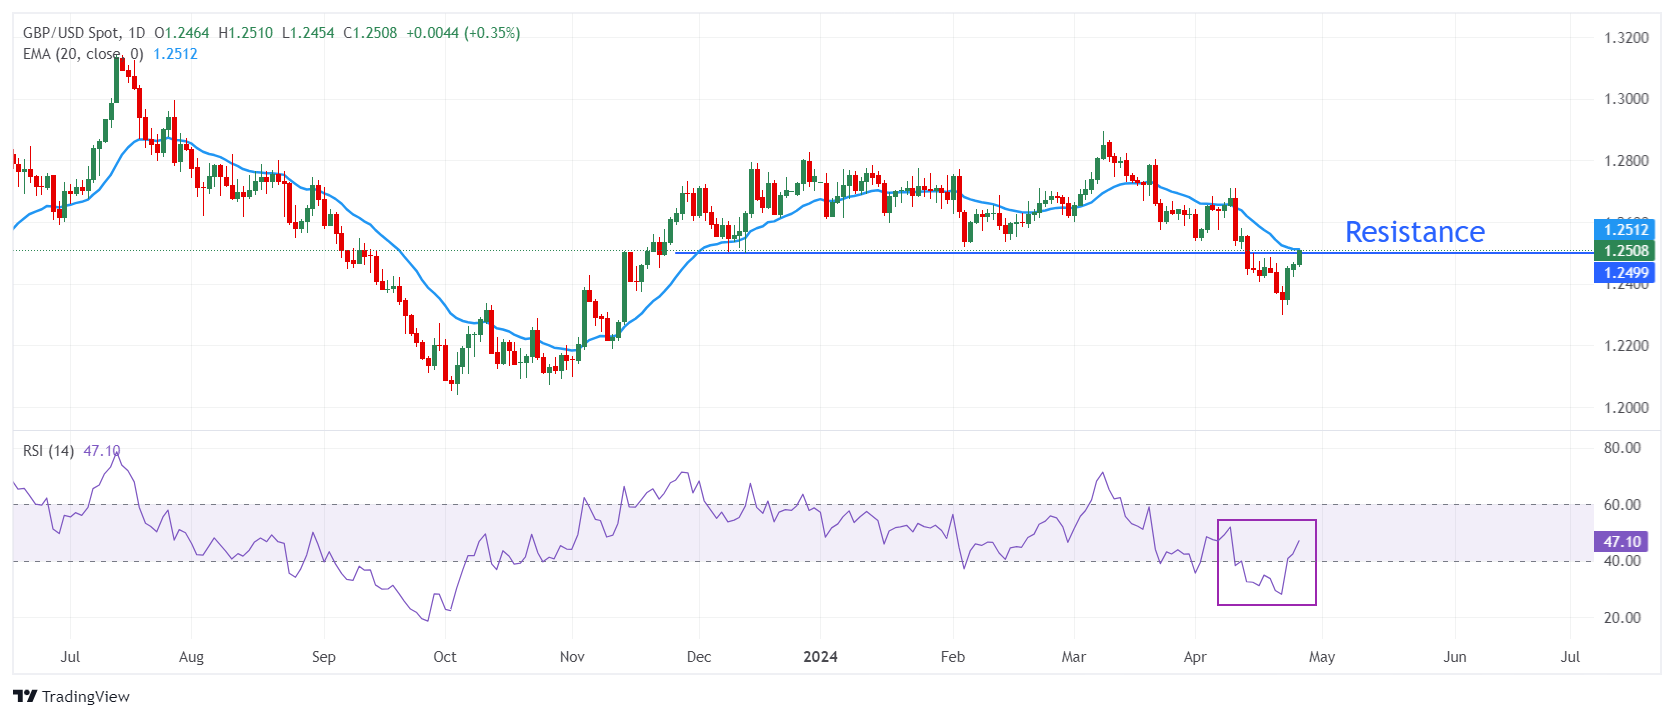
The Pound Sterling extends its recovery to the crucial resistance of 1.2500 against the US Dollar. The GBP/USD pair moves sharply higher after finding strong buying interest near a five-month low of around 1.2300. The near-term outlook of the Cable is still bearish as the 20-day Exponential Moving Average (EMA) at 1.2509 is declining.
The 14-period Relative Strength Index (RSI) rebounds above 40.00, suggesting that a bearish momentum has concluded for now. However, the bearish bias remains intact.
Pound Sterling FAQs
The Pound Sterling (GBP) is the oldest currency in the world (886 AD) and the official currency of the United Kingdom. It is the fourth most traded unit for foreign exchange (FX) in the world, accounting for 12% of all transactions, averaging $630 billion a day, according to 2022 data. Its key trading pairs are GBP/USD, aka ‘Cable’, which accounts for 11% of FX, GBP/JPY, or the ‘Dragon’ as it is known by traders (3%), and EUR/GBP (2%). The Pound Sterling is issued by the Bank of England (BoE).
The single most important factor influencing the value of the Pound Sterling is monetary policy decided by the Bank of England. The BoE bases its decisions on whether it has achieved its primary goal of “price stability” – a steady inflation rate of around 2%. Its primary tool for achieving this is the adjustment of interest rates. When inflation is too high, the BoE will try to rein it in by raising interest rates, making it more expensive for people and businesses to access credit. This is generally positive for GBP, as higher interest rates make the UK a more attractive place for global investors to park their money. When inflation falls too low it is a sign economic growth is slowing. In this scenario, the BoE will consider lowering interest rates to cheapen credit so businesses will borrow more to invest in growth-generating projects.
Data releases gauge the health of the economy and can impact the value of the Pound Sterling. Indicators such as GDP, Manufacturing and Services PMIs, and employment can all influence the direction of the GBP. A strong economy is good for Sterling. Not only does it attract more foreign investment but it may encourage the BoE to put up interest rates, which will directly strengthen GBP. Otherwise, if economic data is weak, the Pound Sterling is likely to fall.
Another significant data release for the Pound Sterling is the Trade Balance. This indicator measures the difference between what a country earns from its exports and what it spends on imports over a given period. If a country produces highly sought-after exports, its currency will benefit purely from the extra demand created from foreign buyers seeking to purchase these goods. Therefore, a positive net Trade Balance strengthens a currency and vice versa for a negative balance.
Here is what you need to know on Thursday, April 25:
The US Dollar (USD) stays under modest selling pressure on Thursday as investors gear up for key data releases. The US Bureau of Economic Analysis will publish the first estimate of the annualized Gross Domestic Product (GDP) growth for the first quarter and the Department of Labor will release the weekly Initial Jobless Claims data.
Following Tuesday's sharp decline, the USD Index registered small losses on Wednesday, supported by the upbeat Durable Goods Orders data for March. Additionally, the cautious market stance further helped the currency stay resilient against its risk-sensitive rivals. Early Thursday, the USD Index stays in negative territory and edges lower toward 105.50. The US economy is forecast to grow at an annual rate of 2.5% in Q1, following the 3.4% expansion recorded in the last quarter of 2023. Meanwhile, US stock index futures stretch lower in the European morning and the 10-year US yield continues to fluctuate above 4.6%.
EUR/USD gained traction and climbed to its highest level in nearly two weeks above 1.0720 after closing virtually unchanged on Monday. Several European Central Bank (ECB) policymakers will be delivering speeches throughout the day.
US Dollar price this week
The table below shows the percentage change of US Dollar (USD) against listed major currencies this week. US Dollar was the weakest against the Australian Dollar.
| USD | EUR | GBP | CAD | AUD | JPY | NZD | CHF | |
| USD | -0.60% | -1.02% | -0.44% | -1.47% | 0.66% | -0.91% | 0.22% | |
| EUR | 0.59% | -0.41% | 0.16% | -0.86% | 1.25% | -0.30% | 0.81% | |
| GBP | 0.99% | 0.39% | 0.58% | -0.46% | 1.67% | 0.11% | 1.22% | |
| CAD | 0.43% | -0.16% | -0.56% | -1.03% | 1.09% | -0.47% | 0.66% | |
| AUD | 1.45% | 0.86% | 0.45% | 1.02% | 2.09% | 0.55% | 1.66% | |
| JPY | -0.66% | -1.26% | -1.68% | -1.10% | -2.14% | -1.57% | -0.44% | |
| NZD | 0.89% | 0.30% | -0.13% | 0.46% | -0.56% | 1.54% | 1.11% | |
| CHF | -0.20% | -0.83% | -1.24% | -0.64% | -1.67% | 0.46% | -1.10% |
The heat map shows percentage changes of major currencies against each other. The base currency is picked from the left column, while the quote currency is picked from the top row. For example, if you pick the Euro from the left column and move along the horizontal line to the Japanese Yen, the percentage change displayed in the box will represent EUR (base)/JPY (quote).
GBP/USD closed the second consecutive day in positive territory on Wednesday and continued to push higher in the early European session on Thursday. The pair was last seen trading within a few pips of 1.2500.
USD/JPY broke above 155.00 and reached its highest level in several decades above 155.50. The Bank of Japan (BoJ) will announce monetary policy decisions during the Asian trading hours on Friday.
Japanese Yen struggles near multi-decade low ahead of US GDP; looks to BoJ on Friday.
Gold (XAU/USD) closed with marginal losses on Wednesday. After edging lower toward $2,300 in the Asian session on Thursday, XAU/USD staged a rebound and was last seen trading above $2,320.
Gold price remains confined in a range, $2,300 holds the key for bulls ahead of US GDP.
Economic Indicator
Gross Domestic Product Annualized
The real Gross Domestic Product (GDP) Annualized, released quarterly by the US Bureau of Economic Analysis, measures the value of the final goods and services produced in the United States in a given period of time. Changes in GDP are the most popular indicator of the nation’s overall economic health. The data is expressed at an annualized rate, which means that the rate has been adjusted to reflect the amount GDP would have changed over a year’s time, had it continued to grow at that specific rate. Generally speaking, a high reading is seen as bullish for the US Dollar (USD), while a low reading is seen as bearish.
Read more.Last release: Thu Mar 28, 2024 12:30
Frequency: Quarterly
Actual: 3.4%
Consensus: 3.2%
Previous: 3.2%
Source: US Bureau of Economic Analysis
The US Bureau of Economic Analysis (BEA) releases the Gross Domestic Product (GDP) growth on an annualized basis for each quarter. After publishing the first estimate, the BEA revises the data two more times, with the third release representing the final reading. Usually, the first estimate is the main market mover and a positive surprise is seen as a USD-positive development while a disappointing print is likely to weigh on the greenback. Market participants usually dismiss the second and third releases as they are generally not significant enough to meaningfully alter the growth picture.
- The United States Gross Domestic Product is seen expanding at an annualized rate of 2.5% in Q1.
- The current resilience of the US economy bolsters the case for a soft landing.
- Markets now see the US Federal Reserve starting its easing cycle in September.
The US Bureau of Economic Analysis (BEA) will publish the first estimate of the US Gross Domestic Product (GDP) for the January-March period on Thursday. The report is expected to show an economic expansion of 2.5% after growing at an annualized pace of 3.4% during the prior quarter.
Forecasting US Gross Domestic Product: Deciphering the Numbers
Thursday's economic agenda in the US features the unveiling of the initial GDP report for the first quarter, set to be disclosed at 12:30 GMT. Analysts anticipate that the first assessment will reveal a 2.5% growth rate for the world's largest economy in the January–March period, a moderately robust pace, albeit markedly slower than the 3.4% expansion recorded in the preceding quarter.
From the latest release of the BEA: “Real GDP increased 2.5 percent in 2023 (from the 2022 annual level to the 2023 annual level), compared with an increase of 1.9 percent in 2022. The increase in real GDP in 2023 primarily reflected increases in consumer spending, nonresidential fixed investment, state and local government spending, exports, and federal government spending that were partly offset by decreases in residential fixed investment and private inventory investment. Imports decreased”.
Market participants will also pay close attention to the GDP Price Index (GDP Deflator), which represents the average change in prices of all new, domestically produced final goods and services in an economy over a specific period, typically a year or a quarter. It essentially reflects the inflation or deflation rate within an economy. During the last quarter of 2023, the GDP Price Index rose by 1.7% and is now seen rising by 3.0%.
Furthermore, the Atlanta Fed GDPNow real GDP estimate for Q1 also props up the case for a solid performance of the US economy during that period.
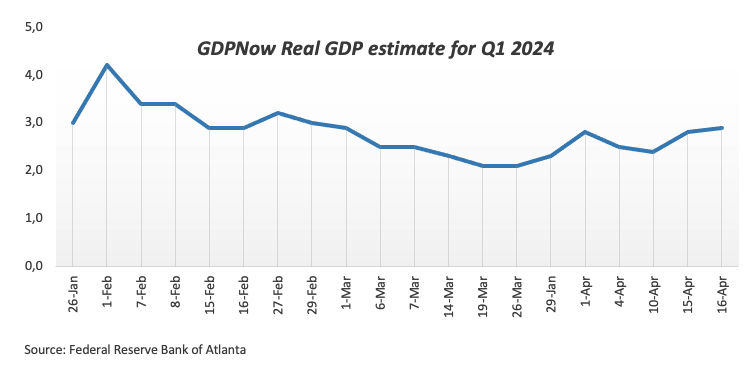
According to analysts at TD Securities: “GDP growth likely modestly cooled to start the year, but to a still firm pace following two stronger expansions at 4.9% and 3.4% q/q annualized rate (AR) in Q3 and Q4 of last year, respectively. Growth in final domestic sales was likely firmer in 24Q1 than the headline would suggest (TD: 2.8% q/q AR), as we look for net trade & inventories to modestly dent still solid consumer spending.”
When is the GDP print released, and how can it affect the USD?
The US GDP report will be published at 12:30 GMT on Thursday. Meanwhile, the Greenback seems to have embarked on a consolidative phase ahead of the first estimate of US Q1 GDP as well as the inflation tracked by the Personal Consumption Expenditures Price Index (PCE) due on Friday.
Meanwhile, the macroeconomic outlook remains consistent with growing anticipation among market participants of the US Federal Reserve's (Fed) first interest rate reduction in September. On this, CME Group’s FedWatch Tool sees the probability of a lower interest rate at around 70%, up from nearly 3% a month ago.
Still around the commencement of the Fed’s easing cycle, Atlanta Federal Reserve Bank President Raphael Bostic predicted US inflation would reach 2% more gradually than previously predicted but did not rush to cut rates. New York Federal Reserve Bank President John Williams emphasized that the Fed's decisions are based on positive data and the strength of the economy, adding that the Fed may adjust if higher rates are needed. Fed Governor Michelle Bowman suggests that efforts to reduce inflation may have hit a snag, leaving uncertainty about interest rates' ability to return to the bank's target. Finally, in his latest comments, Fed Chairman Jerome Powell showed no rush to start reducing interest rates, matching the broad-based rate setters’ views.
A sneak peek ahead of the results
Stronger-than-anticipated GDP growth in the first quarter could bolster expectations that the Fed will delay the start of its easing programme, probably until September or December, which should in turn morph into further strength in the US Dollar (USD). The Greenback is also expected to hold its ground in the case of a higher GDP Price Deflator.
Alternatively, an abrupt change of heart around the US Dollar and, hence, a challenge to the current markets’ bets for a rate cut later in the year, should require an unexpectedly worse-than-estimated print, which appears quite unlikely for the time being.
Techs on the US Dollar Index (DXY)
Pablo Piovano, Senior Analyst at FXStreet, notes: “In case the bullish sentiment gathers steam, the USD Index (DXY) could confront the so-far 2024 top at 106.51 (April 16). Surpassing this level could encourage market participants to embark on a potential visit to the November peak at 107.11 (November 1), just ahead of the 2023 high at 107.34 (October 3).”
Pablo adds: “If we look in the opposite direction, the April bottom at 103.88 (April 9) remains underpinned by the 200-day Simple Moving Average (SMA) at 103.99, and this area is expected to offer decent contention. The breakdown of this region exposes a drop to the 100-day SMA at 103.67 prior to the March low at 102.35 (March 8).”
Economic Indicator
Gross Domestic Product Annualized
The real Gross Domestic Product (GDP) Annualized, released quarterly by the US Bureau of Economic Analysis, measures the value of the final goods and services produced in the United States in a given period of time. Changes in GDP are the most popular indicator of the nation’s overall economic health. The data is expressed at an annualized rate, which means that the rate has been adjusted to reflect the amount GDP would have changed over a year’s time, had it continued to grow at that specific rate. Generally speaking, a high reading is seen as bullish for the US Dollar (USD), while a low reading is seen as bearish.
Read more.Next release: Thu Apr 25, 2024 12:30 (Prel)
Frequency: Quarterly
Consensus: 2.5%
Previous: 3.4%
Source: US Bureau of Economic Analysis
The US Bureau of Economic Analysis (BEA) releases the Gross Domestic Product (GDP) growth on an annualized basis for each quarter. After publishing the first estimate, the BEA revises the data two more times, with the third release representing the final reading. Usually, the first estimate is the main market mover and a positive surprise is seen as a USD-positive development while a disappointing print is likely to weigh on the greenback. Market participants usually dismiss the second and third releases as they are generally not significant enough to meaningfully alter the growth picture.
GDP FAQs
A country’s Gross Domestic Product (GDP) measures the rate of growth of its economy over a given period of time, usually a quarter. The most reliable figures are those that compare GDP to the previous quarter e.g Q2 of 2023 vs Q1 of 2023, or to the same period in the previous year, e.g Q2 of 2023 vs Q2 of 2022. Annualized quarterly GDP figures extrapolate the growth rate of the quarter as if it were constant for the rest of the year. These can be misleading, however, if temporary shocks impact growth in one quarter but are unlikely to last all year – such as happened in the first quarter of 2020 at the outbreak of the covid pandemic, when growth plummeted.
A higher GDP result is generally positive for a nation’s currency as it reflects a growing economy, which is more likely to produce goods and services that can be exported, as well as attracting higher foreign investment. By the same token, when GDP falls it is usually negative for the currency. When an economy grows people tend to spend more, which leads to inflation. The country’s central bank then has to put up interest rates to combat the inflation with the side effect of attracting more capital inflows from global investors, thus helping the local currency appreciate.
When an economy grows and GDP is rising, people tend to spend more which leads to inflation. The country’s central bank then has to put up interest rates to combat the inflation. Higher interest rates are negative for Gold because they increase the opportunity-cost of holding Gold versus placing the money in a cash deposit account. Therefore, a higher GDP growth rate is usually a bearish factor for Gold price.
- EUR/JPY gains traction near 166.85 on Thursday, the highest level since 2008.
- The cross keeps the bullish vibe, with the overbought RSI condition.
- The first resistance level will emerge at 166.82; the initial support level is located at 165.35.
The EUR/JPY cross trades in positive territory for the fifth consecutive day during the early European trading hours on Thursday. The cross edges higher to 166.85, its highest level since 2008. The Tokyo April Consumer Price Index (CPI) will be due on Friday ahead of the Bank of Japan (BoJ) interest rate decision. The markets expect the Japanese central bank to leave its policy rate and bond purchase amounts unchanged since BoJ raised interest rates in March for the first time since 2007. The divergence in rates between Japan and the Eurozone is the key factor that weighs the Japanese Yen (JPY) against the Euro (EUR).
Technically, EUR/JPY maintains the bullish stance unchanged on the four-hour chart as the cross is above the 50-period and 100-period Exponential Moving Averages (EMA) with an upward slope. The Relative Strength Index (RSI) holds in bullish territory above 70. However, the overbought RSI condition indicates that further consolidation cannot be ruled out before positioning for any near-term EUR/JPY appreciation.
The first upside barrier for the cross will emerge near the upper boundary of the Bollinger Band at 166.82. The next hurdle is seen at the 167.00 psychological level. A bullish breakout above this level will see a rally to a yearly high of 2007 at 168.95, en route to an all-time high of 169.78 in July 2008.
On the flip side, the initial support level for the cross is located near a high of March 20 at 165.35. Further south, the next contention level to watch is the 50-period EMA at 165.11, followed by the 100-period EMA at 164.62. A breach of this level will see a drop to the lower limit of the Bollinger Band at 164.30.
EUR/JPY four-hour chart
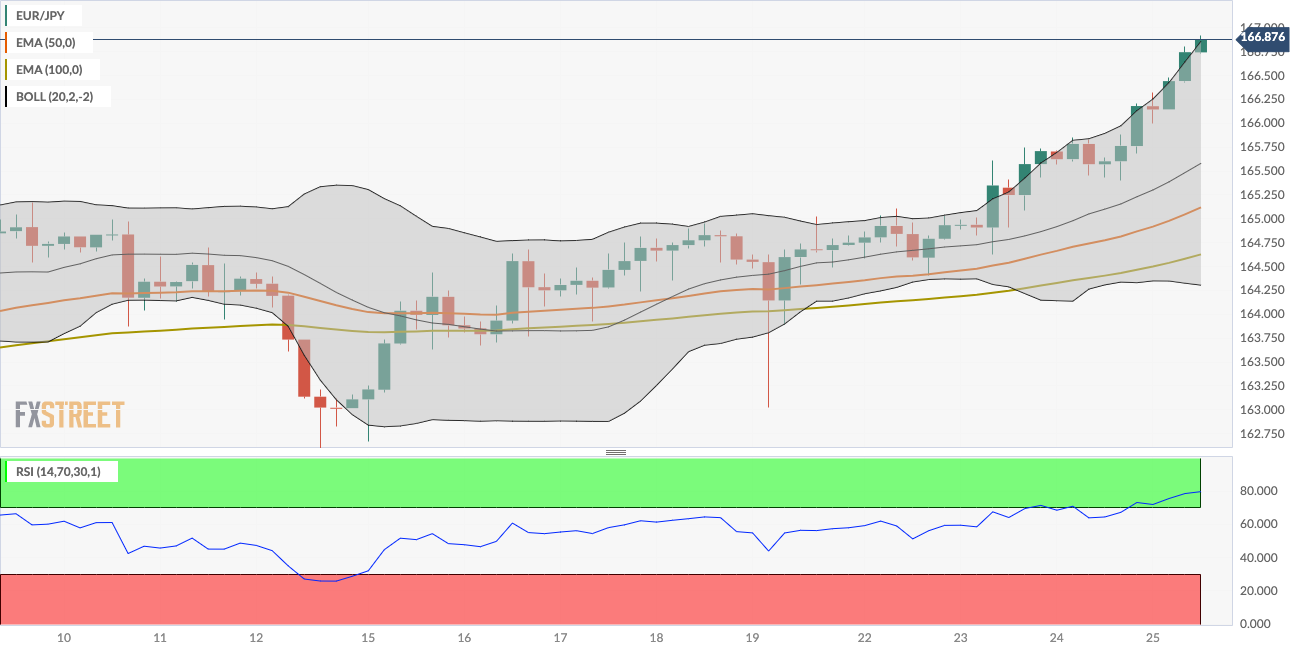
FX option expiries for Apr 25 NY cut at 10:00 Eastern Time, via DTCC, can be found below
- EUR/USD: EUR amounts
- 1.0595 390m
- 1.0640 1.2b
- 1.0650 990m
- 1.0700 750m
- 1.0750 767m
- 1.0760 642m
- 1.0800 689m
- 1.0850 839m
- GBP/USD: GBP amounts
- 1.2410 400m
- 1.2500 432m
- USD/JPY: USD amounts
- 153.00 1.7b
- 154.00 1.2b
- 155.00 1.9b
- 155.25 441m
- 155.85 1.2b
- AUD/USD: AUD amounts
- 0.6430 559m
- 0.6635 505m
- USD/CAD: USD amounts
- 1.3650 379m
- 1.3750 457m
- EUR/USD could approach the 21-day EMA at 1.0727.
- A break below 1.0700 could lead the pair toward the major support of 1.0650 and April’s low at 1.0601.
- A breach above the major level of 1.0695 suggests a weakening of bearish sentiment.
EUR/USD recovers its recent losses registered in the previous session, trading around 1.0710 during the Asian session on Thursday. From a technical standpoint, analysis suggests a weakening of bearish sentiment for the pair as it has surpassed the major level of 1.0695 and the psychological level of 1.0700.
Additionally, the lagging indicator Moving Average Convergence Divergence (MACD) indicates a shift in momentum for the EUR/USD pair, as it is positioned below the centerline but above the signal line. However, the 14-day Relative Strength Index (RSI) remains below the 50-mark, indicating a continuation of bearish momentum.
Key support for the EUR/USD pair is likely to be found around the psychological level of 1.0700. A breach below this level could apply downward pressure on the pair, potentially leading it toward the region surrounding the major support level of 1.0650. Further support may be identified around April’s low at 1.0601, which aligns with the psychological level of 1.0600.
On the upside, the immediate barrier for the pair could be the 21-day Exponential Moving Average (EMA) at 1.0727. A breakthrough above this level could propel the pair towards the 38.2% Fibonacci retracement level at 1.0749, which is drawn between the levels of 1.0981 and 1.0606, coinciding with the major level of 1.0750.
EUR/USD: Daily Chart
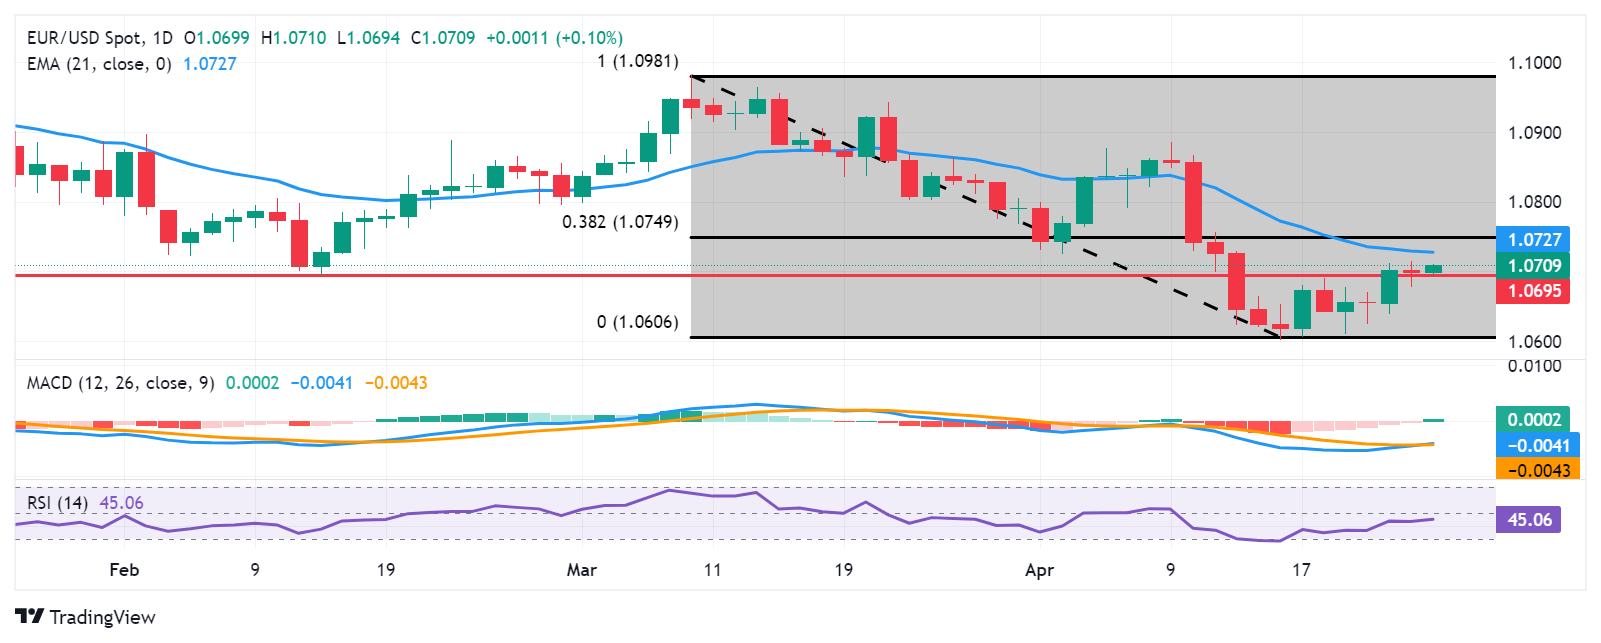
- USD/CHF drifts lower to 0.9145 on the softer US Dollar on Thursday.
- The hawkish tone of the US Fed has lifted the USD, creating a tailwind for the pair.
- Switzerland’s ZEW Survey Expectations rose to 17.6 in April, compared to 11.5 prior.
The USD/CHF pair trades on a weaker note near 0.9145 during the early European session on Thursday. Traders seem to prefer to wait on the sidelines ahead of the release of the US preliminary Gross Domestic Product (GDP) Annualized for the first quarter (Q1) later in the day. In the meantime, any development surrounding escalating tensions in the Middle East might boost safe-haven assets like the Swiss Franc (CHF).
The US Federal Reserve's (Fed) policymakers agreed with the central bank’s position to remain on hold. The hawkish tone of the Fed has provided some support to the Greenback in recent weeks. However, investors have doubts about exactly when monetary policy easing will come. The US GDP growth number might offer some hints about how the US economy performs in Q1 of 2024.
The first estimated US GDP growth number is estimated to grow at a 2.5% annualized pace during the first quarter, compared to the previous reading of 3.4%. In case the report shows stronger-than-expected data, this might trigger speculation that the US Fed will delay the rate cut cycle, which might lift the US Dollar (USD).
On Wednesday, data released from the Centre for European Economic Research showed that Switzerland’s ZEW Survey Expectations improved to 17.6 in April compared to 11.5 in the previous reading. Apart from this, the ongoing geopolitical tensions in the Middle East might lift the CHF, a traditional safe-haven currency, and drag the USD/CHF lower.
- NZD/USD gains momentum as investors express optimism regarding the de-escalation of tensions between Israel and Iran.
- The higher US Treasury yields could help in limiting the losses of the US Dollar.
- US GDP Annualized (Q1) is expected to grow at a slower rate in the first quarter.
The NZD/USD pair moves in the positive direction, trading around 0.5940 during the Asian session on Thursday. The risk-sensitive New Zealand Dollar (NZD) gains momentum as risk appetite improves. Investors are optimistic about the resolution of conflicts between Iran and Israel, following a statement by an Iranian official suggesting no immediate plans for retaliation against Israeli airstrikes, as reported by Reuters.
The China Securities Journal reported on Tuesday that the People's Bank of China (PBoC) plans to reduce the Medium-term Lending Facility (MLF) rate to decrease funding costs during the next MLF rate setting scheduled for May 15. Lower MLF rates in China could stimulate economic activity and boost consumer spending, which may lead to increased demand for New Zealand goods and services in the Chinese market.
The US Dollar Index (DXY), which measures the US Dollar (USD) against six major currencies, depreciated following mixed manufacturing data from the United States (US). However, the Greenback's losses were somewhat offset by slight gains in US Treasury yields.
According to the US Department of Commerce's report on Wednesday, US Durable Goods Orders rose 2.6% month-over-month (MoM) in March, surpassing the previous reading of 0.7% and beating the estimated 2.5%. However, core goods, excluding transportation, increased 0.2% MoM, falling short of the expected 0.3%.
On Thursday, the preliminary Gross Domestic Product Annualized (Q1) data for the United States (US) is set to be released, with expectations of a growth rate slowdown. These GDP figures will offer insights into the strength of the US economy and could influence future actions by the Federal Reserve (Fed).
- GBP/USD struggles to attract follow-through buying and trades in a narrow range on Thursday.
- Reduced Fed rate cut bets and speculations about more aggressive BoE easing act as a headwind.
- The technical setup warrants some caution before positioning for any further appreciating move.
The GBP/USD pair consolidates its strong recovery gains registered over the past two days, from the 1.2300 mark or the YTD low set earlier this week and oscillates in a range during the Asian session on Thursday. Spot prices currently trade near the 1.2465 region, unchanged for the day as traders await more cues about the Federal Reserve's (Fed) rate-cut path before placing fresh directional bets.
Hence, the focus will remain glued to important US macro data – the Advance Q1 GDP report later today and the Personal Consumption Expenditures (PCE) Price Index on Friday. In the meantime, expectations that the Fed will delay cutting interest rates in the wake of sticky inflation continue to act as a tailwind for the US Dollar (USD). Apart from this, speculations about more aggressive policy easing by the Bank of England (BoE) undermine demand for the British Pound (GBP) and act as a headwind for the GBP/USD pair.
From a technical perspective, acceptance above the 23.6% Fibonacci retracement level of the March-April downfall favors bullish traders and supports prospects for a further appreciating move. Hence, some follow-through strength beyond the 1.2500 psychological mark, en route to the 1.2530-1.2535 region or the 38.2% Fibo. level, looks like a distinct possibility. That said, oscillators on the daily chart are still holding in the negative territory, suggesting that the latter should act as a headwind and cap the upside for the GBP/USD pair.
On the flip side, the 1.2425 area now seems to protect the immediate downside ahead of the 1.2400 round figure. Some follow-through selling could drag the GBP/USD pair back towards the 1.2350 intermediate support en route to the 1.2300 mark, or the YTD low touched on Tuesday. A convincing break below the latter will be seen as a fresh trigger for bearish traders and pave the way for an extension of the recent downtrend from the March swing high. Spot prices might then slide to the 1.2245 area before dropping to the 1.2200 mark.
GBP/USD daily chart
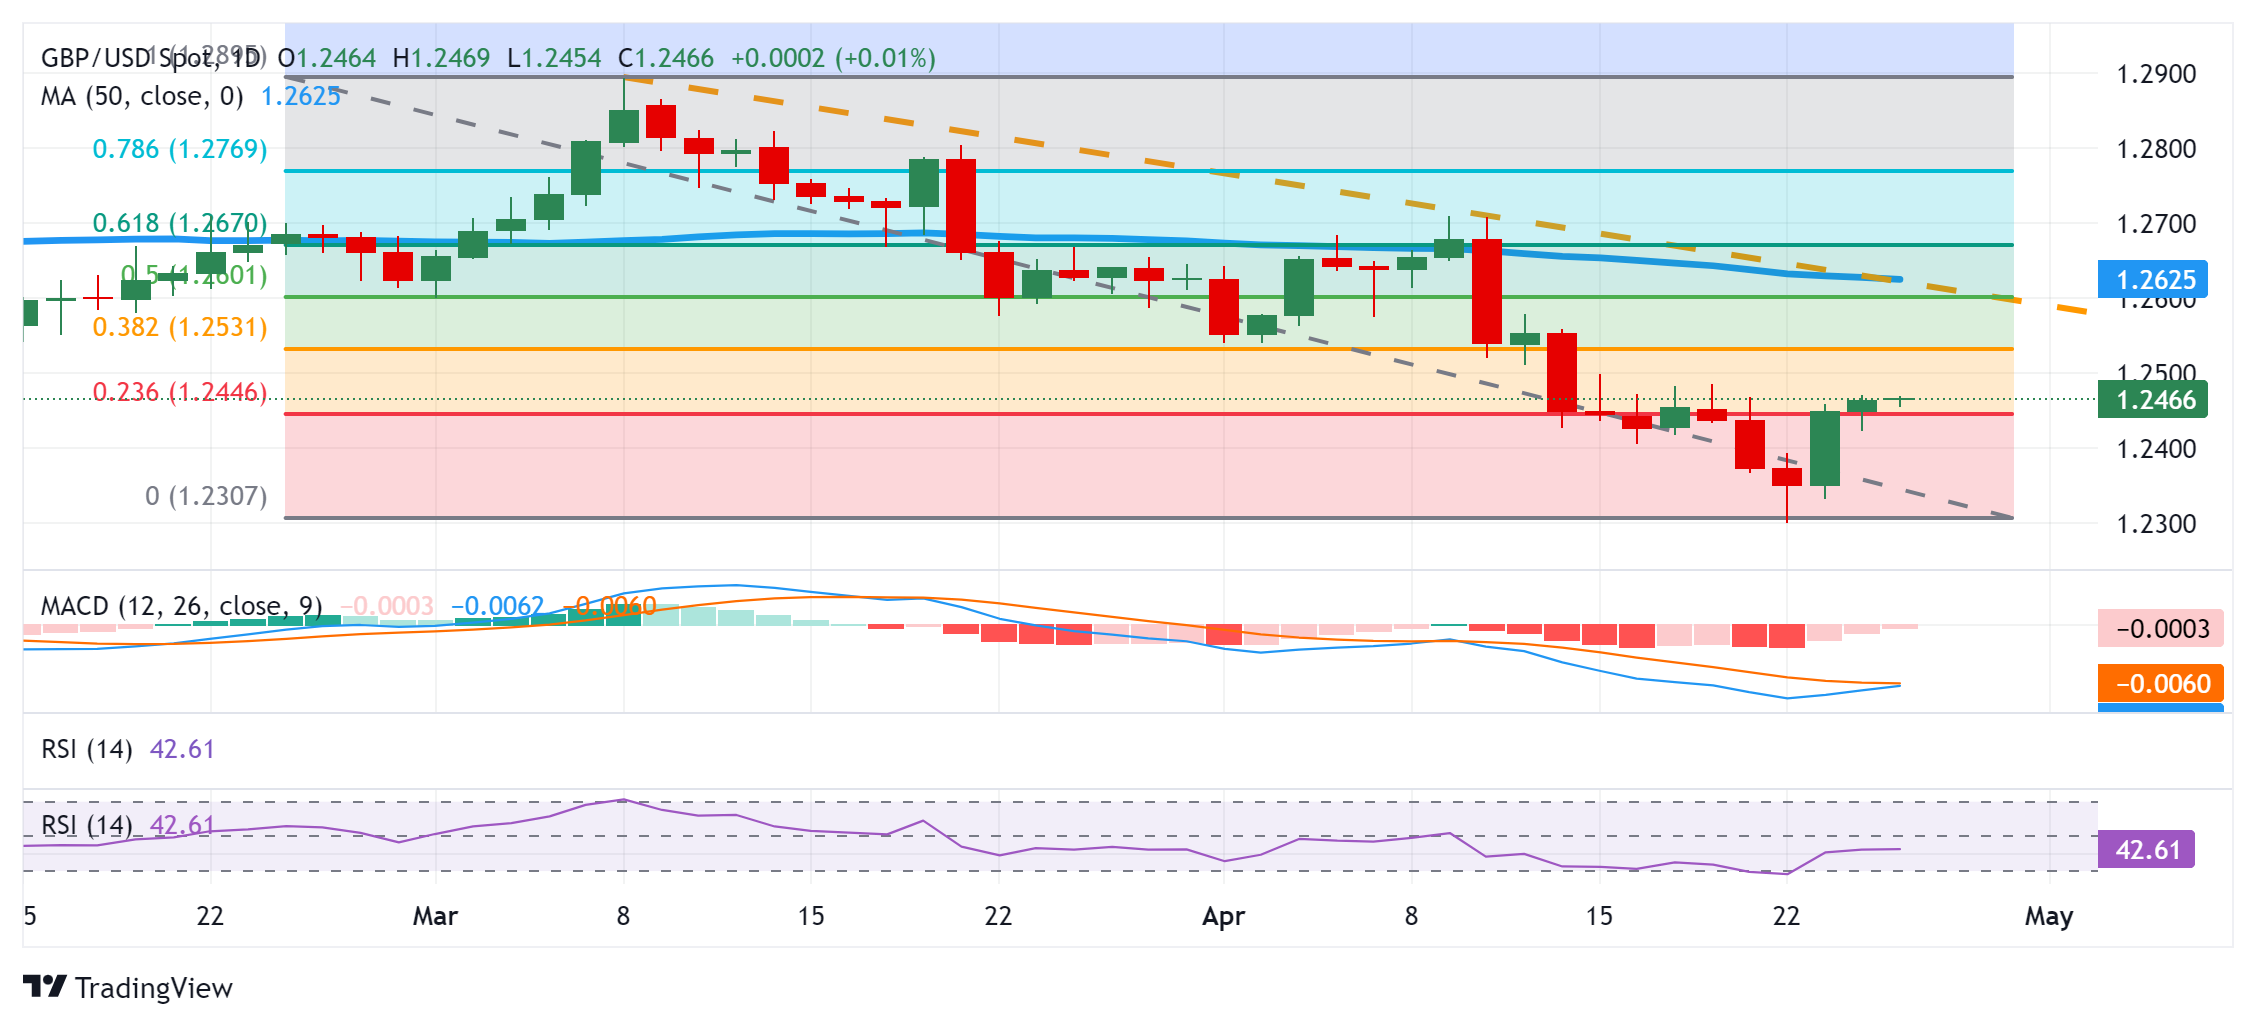
- Gold price remains confined in a narrow band for the second straight day on Thursday.
- Reduced Fed rate cut bets and a positive risk tone cap the upside for the commodity.
- Traders now await key US macro data before positioning for the near-term trajectory.
Gold price (XAU/USD) extends its consolidative price move above the $2,300 mark during the Asian session on Thursday as traders more cues about the Federal Reserve's (Fed) rate-cut path before placing fresh directional bets. Hence, the focus will remain glued to key US macro data – the Advance Q1 GDP report due later today and the Personal Consumption Expenditures (PCE) Price Index on Friday. This will play a key role in influencing the near-term US Dollar (USD) price dynamics and provide some meaningful impetus to the commodity.
In the meantime, the recent hawkish remarks by several Fed officials suggested that the central bank is in no rush to cut interest rates.
Moreover, stronger US consumer inflation figures forced investors to scale back their expectations about the timing of the first rate cut to September and downsize the number of rate cuts in 2024. This keeps the US Treasury bond yields elevated and acts as a headwind for the non-yielding Gold price. Apart from this, easing concerns about a major escalation of the Middle East crisis continues to cap the safe-haven XAU/USD.
Daily Digest Market Movers: Gold price struggles to gain traction amid hawkish Fed expectations
- Investors await key US economic data for clarity about the timing when the Federal Reserve will start cutting rates, leading to subdued range-bound price action around the Gold price for the second straight day on Thursday.
- The first estimate, or the Advance US GDP report is due for release later today and is expected to show that the world's largest economy grew by 2.5% annualized pace during the first quarter as compared to the 3.4% previous.
- The focus will then shift to the Fed's preferred inflation gauge – the core Personal Consumption Expenditures (PCE) Price Index – on Friday, which will play a key role in determining the near-term trajectory for the XAU/USD.
- The US Census Bureau reported on Wednesday that Durable Goods Orders climbed 2.6% in March as compared to the previous month's downwardly revised 0.7% increase, while new orders excluding transportation rose 0.2%.
- This comes on the back of strong US consumer inflation figures and hawkish remarks by Fed officials, reaffirming bets that the central bank will not begin its rate-cutting cycle before September and capping the non-yielding metal.
- The global risk sentiment remains supported by easing concerns about a further escalation of geopolitical tensions in the Middle East, which is seen as another factor acting as a headwind for the safe-haven precious metal.
- The US Dollar bulls seem reluctant to place aggressive bets and remain on the defensive ahead of important macro releases, offering some support to the XAU/USD and limiting any meaningful downside for now.
Technical Analysis: Gold price bears need to wait for acceptance below $2,300 before placing fresh bets
From a technical perspective, the Gold price now seems to have found acceptance below the 23.6% Fibonacci retracement level of the February-April rally, albeit showing some resilience below the $2,300 mark earlier this week. Moreover, oscillators on the daily chart – though have been losing traction – are still holding in the positive territory. Hence, it will be prudent to wait for some follow-through selling below the $2,300-2,290 area, or over a two-week low touched on Tuesday, before positioning for an extension of the recent pullback from the all-time peak. The subsequent downfall has the potential to drag the XAU/USD to the $2,260-2,255 area, or the 38.2% Fibo. level, en route to the $2,225 intermediate support and the $2,200-2,190 confluence, comprising the 50% Fibo. level and the 50-day Simple Moving Average (SMA).
On the flip side, immediate resistance is pegged near the $2,325 area ahead of the overnight swing high, the $2,337-2,338 zone. A sustained move beyond could allow the Gold price to test the next relevant hurdle near the $2,350-2,355 region and climb further towards the $2,380 supply zone. This is closely followed by the $2,400 round figure and the all-time peak, near the $2,431-2,432 area, which if cleared will set the stage for an extension of the recent blowout rally witnessed over the past two months or so.
Gold FAQs
Gold has played a key role in human’s history as it has been widely used as a store of value and medium of exchange. Currently, apart from its shine and usage for jewelry, the precious metal is widely seen as a safe-haven asset, meaning that it is considered a good investment during turbulent times. Gold is also widely seen as a hedge against inflation and against depreciating currencies as it doesn’t rely on any specific issuer or government.
Central banks are the biggest Gold holders. In their aim to support their currencies in turbulent times, central banks tend to diversify their reserves and buy Gold to improve the perceived strength of the economy and the currency. High Gold reserves can be a source of trust for a country’s solvency. Central banks added 1,136 tonnes of Gold worth around $70 billion to their reserves in 2022, according to data from the World Gold Council. This is the highest yearly purchase since records began. Central banks from emerging economies such as China, India and Turkey are quickly increasing their Gold reserves.
Gold has an inverse correlation with the US Dollar and US Treasuries, which are both major reserve and safe-haven assets. When the Dollar depreciates, Gold tends to rise, enabling investors and central banks to diversify their assets in turbulent times. Gold is also inversely correlated with risk assets. A rally in the stock market tends to weaken Gold price, while sell-offs in riskier markets tend to favor the precious metal.
The price can move due to a wide range of factors. Geopolitical instability or fears of a deep recession can quickly make Gold price escalate due to its safe-haven status. As a yield-less asset, Gold tends to rise with lower interest rates, while higher cost of money usually weighs down on the yellow metal. Still, most moves depend on how the US Dollar (USD) behaves as the asset is priced in dollars (XAU/USD). A strong Dollar tends to keep the price of Gold controlled, whereas a weaker Dollar is likely to push Gold prices up.
- The Australian Dollar gains ground as the stronger CPI enhances hawkish sentiment regarding the RBA monetary policy stance.
- The Australian Dollar strengthens in response to the higher 10-year yield on Australian government bonds.
- The gains in US Treasury yields could limit the losses of the US Dollar.
The Australian Dollar (AUD) edges higher for the fourth consecutive session on Thursday. The Australian Dollar (AUD) gained traction against the US Dollar (USD) following the release of robust Australian Consumer Price Index (CPI) figures on Wednesday. Additionally, the easing tensions in the Middle East have created a positive market sentiment, favoring risk-sensitive currencies like the AUD and consequently supporting the AUD/USD pair.
The Australian Dollar gains ground following the higher 10-year yield on Australian government bonds, which has surged above 4.49%, approaching five-month highs. This increase in yield is attributed to the growing expectations of a more hawkish stance from the Reserve Bank of Australia (RBA) regarding its interest rate trajectory.
The US Dollar Index (DXY), which gauges the US Dollar (USD) against six major currencies, downticks, possibly influenced by improved risk appetite. However, the modest gains in US Treasury yields could mitigate the losses of the Greenback.
The preliminary Gross Domestic Product Annualized (Q1) from the United States (US) is scheduled to be released on Thursday, with expectations of a slowdown in the growth rate. The GDP figures will provide insights into the strength of the US economy and may indicate the Federal Reserve (Fed)'s future actions. If the report reveals higher-than-expected figures, it could spark speculation that the Fed will postpone its rate cut cycle.
Daily Digest Market Movers: Australian Dollar appreciates after hotter CPI data
- Luci Ellis, the chief economist at Westpac and former Assistant Governor (Economic) at the Reserve Bank of Australia, notes that inflation slightly exceeded expectations in the March quarter. Westpac anticipates that the Board will keep interest rates unchanged in May and has adjusted their forecasted date for the first rate cut from September to November this year.
- Australia’s Consumer Price Index (CPI) rose by 1.0% QoQ in the first quarter of 2024, against the expected 0.8% and 0.6% prior. CPI (YoY) increased by 3.6% compared to the forecast of 3.4% for Q1 and 4.1% prior.
- Australia’s Monthly Consumer Price Index (YoY) rose to 3.5% in March, against the market expectations and the previous reading of 3.4%.
- The S&P Global US Composite PMI decreased in April, indicating only a modest expansion in the nation's private sector. This was the weakest expansion since December. Activity saw slower growth rates in both the manufacturing and service sectors, with expansions easing to three- and five-month lows, respectively.
- In April 2024, the Judo Bank Australia Composite Output Index rose, marking the third consecutive month of expansion in the Australian private sector and the fastest pace since April 2022. Although the service sector primarily drove business activity growth, the rate of decline in manufacturing output slowed to its lowest level in eight months.
- The China Securities Journal indicated on Tuesday that the People's Bank of China (PBoC) plans to reduce the Medium-term Lending Facility (MLF) rate in an effort to decrease funding costs. The next MLF rate setting is scheduled for May 15. This move might potentially benefit Australian exports to China, considering the strong trade ties between the two nations.
Technical Analysis: Australian Dollar hovers above the psychological level of 0.6500
The Australian Dollar trades around 0.6510 on Thursday. The pair is hovering above the lower boundary of a symmetrical triangle pattern. A further gain could lead to a bullish sentiment, with the pair potentially targeting the psychological level of 0.6600 and aiming for the upper boundary of the triangle near 0.6639. Additionally, the 14-day Relative Strength Index (RSI) is above the 50-level, supporting this bullish outlook.
On the downside, immediate support is expected around the psychological level of 0.6500. A break below this level may lead to further downside momentum, with the next significant support region around 0.6456. The AUD/USD pair may find further support at April’s low of 0.6362.
AUD/USD: Daily Chart
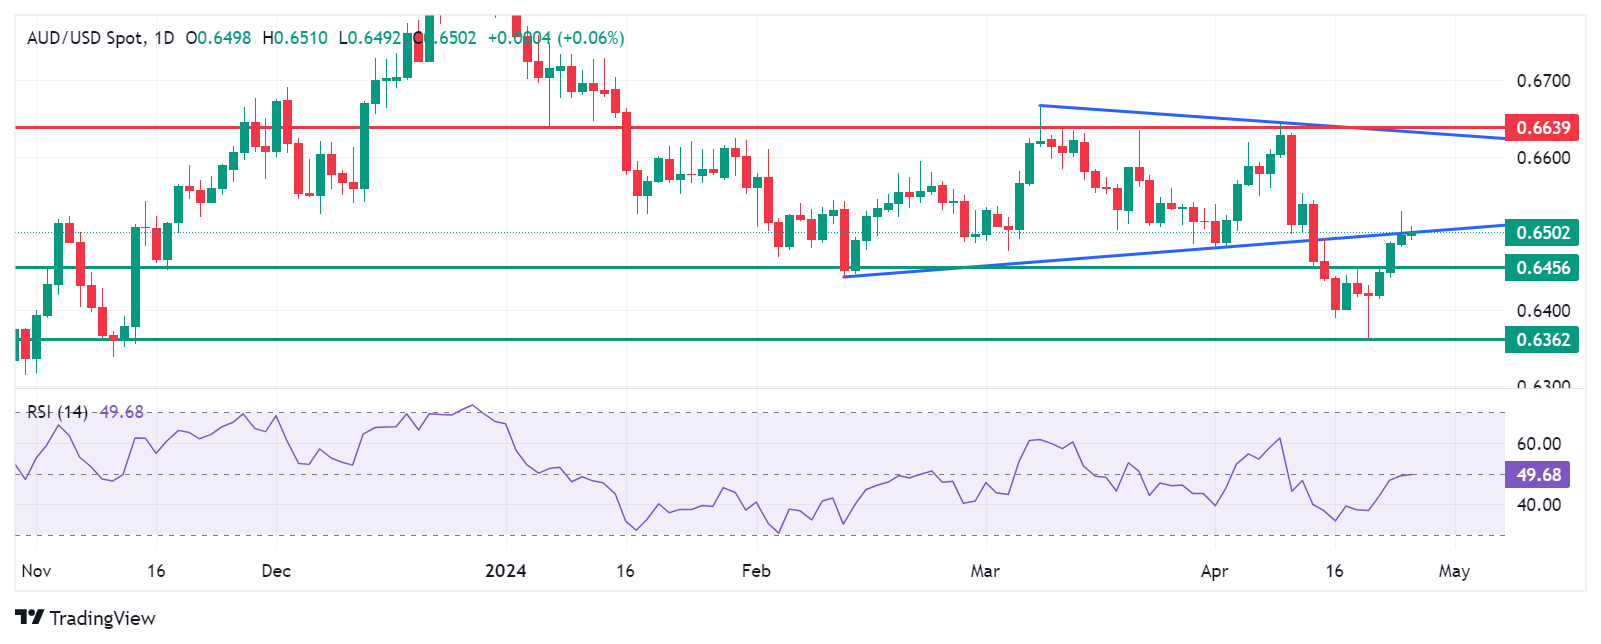
Australian Dollar price today
The table below shows the percentage change of the Australian Dollar (AUD) against listed major currencies today. The Australian Dollar was the strongest against the Japanese Yen.
| USD | EUR | GBP | CAD | AUD | JPY | NZD | CHF | |
| USD | -0.05% | -0.03% | -0.04% | -0.04% | 0.14% | -0.01% | 0.02% | |
| EUR | 0.05% | 0.05% | 0.01% | 0.00% | 0.18% | 0.03% | 0.07% | |
| GBP | 0.02% | -0.04% | -0.04% | -0.04% | 0.16% | -0.02% | 0.03% | |
| CAD | 0.06% | 0.00% | 0.05% | 0.01% | 0.19% | 0.04% | 0.07% | |
| AUD | 0.04% | 0.00% | 0.03% | 0.00% | 0.18% | 0.02% | 0.07% | |
| JPY | -0.13% | -0.19% | -0.15% | -0.19% | -0.16% | -0.16% | -0.12% | |
| NZD | 0.03% | -0.03% | 0.00% | -0.04% | -0.03% | 0.16% | 0.08% | |
| CHF | -0.02% | -0.07% | -0.04% | -0.07% | -0.07% | 0.12% | -0.05% |
The heat map shows percentage changes of major currencies against each other. The base currency is picked from the left column, while the quote currency is picked from the top row. For example, if you pick the Euro from the left column and move along the horizontal line to the Japanese Yen, the percentage change displayed in the box will represent EUR (base)/JPY (quote).
Australian Dollar FAQs
One of the most significant factors for the Australian Dollar (AUD) is the level of interest rates set by the Reserve Bank of Australia (RBA). Because Australia is a resource-rich country another key driver is the price of its biggest export, Iron Ore. The health of the Chinese economy, its largest trading partner, is a factor, as well as inflation in Australia, its growth rate, and Trade Balance. Market sentiment – whether investors are taking on more risky assets (risk-on) or seeking safe havens (risk-off) – is also a factor, with risk-on positive for AUD.
The Reserve Bank of Australia (RBA) influences the Australian Dollar (AUD) by setting the level of interest rates that Australian banks can lend to each other. This influences the level of interest rates in the economy as a whole. The main goal of the RBA is to maintain a stable inflation rate of 2-3% by adjusting interest rates up or down. Relatively high interest rates compared to other major central banks support the AUD, and the opposite for relatively low. The RBA can also use quantitative easing and tightening to influence credit conditions, with the former AUD-negative and the latter AUD-positive.
China is Australia’s largest trading partner so the health of the Chinese economy is a major influence on the value of the Australian Dollar (AUD). When the Chinese economy is doing well it purchases more raw materials, goods and services from Australia, lifting demand for the AUD, and pushing up its value. The opposite is the case when the Chinese economy is not growing as fast as expected. Positive or negative surprises in Chinese growth data, therefore, often have a direct impact on the Australian Dollar and its pairs.
Iron Ore is Australia’s largest export, accounting for $118 billion a year according to data from 2021, with China as its primary destination. The price of Iron Ore, therefore, can be a driver of the Australian Dollar. Generally, if the price of Iron Ore rises, AUD also goes up, as aggregate demand for the currency increases. The opposite is the case if the price of Iron Ore falls. Higher Iron Ore prices also tend to result in a greater likelihood of a positive Trade Balance for Australia, which is also positive of the AUD.
The Trade Balance, which is the difference between what a country earns from its exports versus what it pays for its imports, is another factor that can influence the value of the Australian Dollar. If Australia produces highly sought after exports, then its currency will gain in value purely from the surplus demand created from foreign buyers seeking to purchase its exports versus what it spends to purchase imports. Therefore, a positive net Trade Balance strengthens the AUD, with the opposite effect if the Trade Balance is negative.
- Indian Rupee trades with mild negative bias on Thursday.
- The INR’s downside might be capped, owing to a further decline in crude oil prices.
- Market players will closely monitor the US preliminary GDP growth number for the first quarter (Q1).
Indian Rupee (INR) extends its downside on Thursday despite the decline of the US Dollar (USD). The growing speculation that the US Federal Reserve (Fed) will delay interest rate cuts boosts the Greenback against its rivals. Nonetheless, the upside of the pair might be limited due to a further decline in crude oil prices amid easing tensions about a wider fallout between Iran and Israel.
Investors will closely monitor the US preliminary Gross Domestic Product (GDP) Annualized for the first quarter (Q1). The report could offer a clue of how strongly the US economy is growing and point to the Fed's next move. On Friday, the final reading of the US March Personal Consumption Expenditures Price Index (PCE) will be a closely watched event. Apart from this, India’s general election, which started on 19 April and will run until 1 June, will be in the spotlight.
Daily Digest Market Movers: The Indian Rupee remains vulnerable at the start of the election
- In mid-April, India’s foreign exchange reserves stood at USD 564.5 billion (+48 billion over a year), equating to more than 7.6 months of goods and services imports.
- The Indian rupee remains stable at the start of the election period, holding up better than other Asian currencies so far. Since the start of April, it has only depreciated by 0.6% against the US Dollar.
- The Indian economy needs to grow at a rate of 8–10% per annum over the next decade to reap the demographic dividend, according to the Reserve Bank of India (RBI) monthly bulletin.
- The main economic challenge for the Indian government after the election is unemployment, according to economists polled by Reuters, who forecast India to expand at a solid 6.5% this fiscal year.
- The US Durable Goods Orders improved 2.6% MoM or $7.3 billion, to $283.4 billion in March, compared to the 0.7% increase (revised from 1.4%) in February. The increase in overall orders was the biggest since November 2023
- Durable Goods Orders ex Transportation rose by 0.2% MoM in March, while new orders excluding defense rose 2.3% MoM in the same period. Both figures came in below the consensus.
Technical analysis: USD/INR keeps the bullish vibe in the longer term
The Indian Rupee trades on a softer note on the day. USD/INR maintains the positive outlook unchanged on the daily timeframe as the pair is above the key 100-day Exponential Moving Average (EMA). Nonetheless, the 14-day Relative Strength Index (RSI) hovers around the 50.00 midlines, suggesting that further consolidation is favorable for the time being.
The first upside barrier for USD/INR will emerge at 83.50 (high of April 15). Any follow-through buying above this level will expose 83.72 (an all-time high), en route to 84.00 (round figure). On the other hand, the confluence of the 100-day EMA and a low of April 10 near the 83.10–83.15 zone. The additional downside filter to watch is 82.78 (low of January 15), followed by 82.65 (low of March 16).
US Dollar price today
The table below shows the percentage change of US Dollar (USD) against listed major currencies today. US Dollar was the strongest against the Japanese Yen.
| USD | EUR | GBP | CAD | AUD | JPY | NZD | CHF | |
| USD | -0.06% | -0.06% | -0.06% | -0.13% | 0.11% | -0.12% | -0.01% | |
| EUR | 0.06% | -0.01% | 0.00% | -0.07% | 0.17% | -0.07% | 0.03% | |
| GBP | 0.07% | -0.02% | 0.01% | -0.08% | 0.17% | -0.07% | 0.02% | |
| CAD | 0.08% | 0.00% | 0.00% | -0.06% | 0.16% | -0.04% | 0.05% | |
| AUD | 0.13% | 0.05% | 0.07% | 0.05% | 0.21% | 0.00% | 0.12% | |
| JPY | -0.11% | -0.16% | -0.17% | -0.18% | -0.23% | -0.25% | -0.12% | |
| NZD | 0.11% | 0.04% | 0.06% | 0.02% | -0.02% | 0.21% | 0.13% | |
| CHF | 0.01% | -0.04% | -0.06% | -0.06% | -0.11% | 0.12% | -0.09% |
The heat map shows percentage changes of major currencies against each other. The base currency is picked from the left column, while the quote currency is picked from the top row. For example, if you pick the Euro from the left column and move along the horizontal line to the Japanese Yen, the percentage change displayed in the box will represent EUR (base)/JPY (quote).
Indian Rupee FAQs
The Indian Rupee (INR) is one of the most sensitive currencies to external factors. The price of Crude Oil (the country is highly dependent on imported Oil), the value of the US Dollar – most trade is conducted in USD – and the level of foreign investment, are all influential. Direct intervention by the Reserve Bank of India (RBI) in FX markets to keep the exchange rate stable, as well as the level of interest rates set by the RBI, are further major influencing factors on the Rupee.
The Reserve Bank of India (RBI) actively intervenes in forex markets to maintain a stable exchange rate, to help facilitate trade. In addition, the RBI tries to maintain the inflation rate at its 4% target by adjusting interest rates. Higher interest rates usually strengthen the Rupee. This is due to the role of the ‘carry trade’ in which investors borrow in countries with lower interest rates so as to place their money in countries’ offering relatively higher interest rates and profit from the difference.
Macroeconomic factors that influence the value of the Rupee include inflation, interest rates, the economic growth rate (GDP), the balance of trade, and inflows from foreign investment. A higher growth rate can lead to more overseas investment, pushing up demand for the Rupee. A less negative balance of trade will eventually lead to a stronger Rupee. Higher interest rates, especially real rates (interest rates less inflation) are also positive for the Rupee. A risk-on environment can lead to greater inflows of Foreign Direct and Indirect Investment (FDI and FII), which also benefit the Rupee.
Higher inflation, particularly, if it is comparatively higher than India’s peers, is generally negative for the currency as it reflects devaluation through oversupply. Inflation also increases the cost of exports, leading to more Rupees being sold to purchase foreign imports, which is Rupee-negative. At the same time, higher inflation usually leads to the Reserve Bank of India (RBI) raising interest rates and this can be positive for the Rupee, due to increased demand from international investors. The opposite effect is true of lower inflation.
| Raw materials | Closed | Change, % |
|---|---|---|
| Silver | 27.142 | -0.47 |
| Gold | 2315.15 | -0.3 |
| Palladium | 998.86 | -1.57 |
- The Japanese Yen continues losing ground amid the divergent BoJ-Fed policy expectations.
- The recent intervention warnings by Japanese authorities do little to provide any respite.
- Traders now look to the US Q1 GDP report for some impetus ahead of the BoJ on Friday.
The Japanese Yen (JPY) extends its weakening trend further below the 155.00 psychological mark and drops to the lowest level since June 1990 against its American counterpart during the Asian session on Thursday. The wide interest-rate differential between Japan and the United States (US) is seen as a key factor that continues to undermine the JPY. The move, however, fuels the risk of a potential intervention by Japanese authorities, which, in turn, might hold back the JPY bears from placing fresh bets. Traders might also prefer to move to the sidelines ahead of the crucial Bank of Japan (BoJ) monetary policy decision on Friday.
The Japanese central bank is widely expected to leave policy settings, and bond purchase amounts unchanged after raising interest rates in March for the first time since 2007. In contrast, investors seem convinced that the Federal Reserve (Fed) may delay cutting interest rates in the wake of still sticky inflation, which remains supportive of elevated US Treasury bond yields and acts as a tailwind for the US Dollar (USD). This, in turn, suggests that the path of least resistance for the USD/JPY pair remains to the upside.
Daily Digest Market Movers: Japanese Yen bears not ready to give up despite intervention warnings
Expectations that the difference in interest rates between the US and Japan will stay wide drag the Japanese Yen to a fresh multi-decade low on Thursday, fueling speculation about possible intervention by Japanese authorities.
Japanese officials have repeatedly warned that they will take necessary action to address excessive moves in the yen if needed and have emphasized a focus on the pace of the currency’s depreciation rather than a precise price level.
Moreover, Bank of Japan Governor Kazuo Ueda has said the central bank may hike rates again if the fall in the domestic currency significantly pushes up inflation, which might hold back the JPY bears from placing fresh bets.
Japan's Liberal Democratic Party (LDP) executive, Takao Ochi, said on Wednesday that the JPY's fall towards the 160 against its American counterpart may be deemed excessive and could prompt policymakers to consider some action.
Japan's Finance Minister Shunichi Suzuki refrained from commenting on specific FX levels, while Chief Cabinet Secretary Yoshimasa Hayashi reiterated that it is important for currencies to move in a stable manner reflecting fundamentals.
Investors keenly await the outcome of the highly-anticipated two-day BoJ policy meeting on Friday for cues on when the central bank will raise interest rates again, which, in turn, will determine the near-term trajectory for the JPY.
The US Census Bureau reported on Wednesday that Durable Goods Orders increased by 2.6% in March as compared to the previous month's downwardly revised 0.7% rise, while new orders excluding transportation rose 0.2%
This comes on the back of strong US consumer inflation figures and reaffirmed expectations that the Federal Reserve will not begin its rate-cutting cycle before September, which acts as a tailwind for the US Dollar and the USD/JPY pair.
Traders now look forward to the release of the Advance US GDP report, which is expected to show that growth in the world's largest economy slowed to a 2.5% annualized pace during the first quarter of 2024 from the 3.4% previous.
Apart from this, the US Personal Consumption Expenditures (PCE) Price Index on Friday will be looked upon for cues about the Fed's rate-cut path and determining the next leg of a directional move for the buck and the currency pair.
Technical Analysis: USD/JPY could consolidate before the next leg up towards the 156.00 mark
From a technical perspective, the overnight breakout through a short-term trading range and a subsequent strength beyond the 155.00 mark could be seen as a fresh trigger for bullish traders. That said, the Relative Strength Index (RSI) on the daily chart remains in the overbought territory, warranting some caution amid intervention fears and ahead of the BoJ event risk. Hence, it will be prudent to wait for some near-term consolidation or a modest pullback before positioning for the next leg of a positive move. Nevertheless, the USD/JPY pair seems poised to prolong its recent well-established uptrend from the March swing low and aim to conquer the 156.00 round figure.
On the flip side, any meaningful corrective slide is likely to attract fresh buyers and remain limited near the 154.90-154.85 region. This is followed by the 154.55-154.45 support zone, which, if broken, might prompt some technical selling and drag the USD/JPY pair to the 154.00 round-figure mark. The downward trajectory could extend further towards last Friday's low, around the 153.60-153.55 area.
Japanese Yen FAQs
The Japanese Yen (JPY) is one of the world’s most traded currencies. Its value is broadly determined by the performance of the Japanese economy, but more specifically by the Bank of Japan’s policy, the differential between Japanese and US bond yields, or risk sentiment among traders, among other factors.
One of the Bank of Japan’s mandates is currency control, so its moves are key for the Yen. The BoJ has directly intervened in currency markets sometimes, generally to lower the value of the Yen, although it refrains from doing it often due to political concerns of its main trading partners. The current BoJ ultra-loose monetary policy, based on massive stimulus to the economy, has caused the Yen to depreciate against its main currency peers. This process has exacerbated more recently due to an increasing policy divergence between the Bank of Japan and other main central banks, which have opted to increase interest rates sharply to fight decades-high levels of inflation.
The BoJ’s stance of sticking to ultra-loose monetary policy has led to a widening policy divergence with other central banks, particularly with the US Federal Reserve. This supports a widening of the differential between the 10-year US and Japanese bonds, which favors the US Dollar against the Japanese Yen.
The Japanese Yen is often seen as a safe-haven investment. This means that in times of market stress, investors are more likely to put their money in the Japanese currency due to its supposed reliability and stability. Turbulent times are likely to strengthen the Yen’s value against other currencies seen as more risky to invest in.
Japan’s Chief Cabinet Secretary Yishimasa Hayashi said on Thursday that he “won't comment on forex levels or forex intervention” but he “will be ready to take full response.”
Additional comments
Important for currencies to move in stable manner reflecting fundamentals.
Rapid FX moves undesirable.
Closely watching FX moves.
Expect the Bank of Japan (BoJ) to work closely with govternment.
Expect BoJ to conduct appropriate monetary policy to sustainably, stably hit its price target, working closely with govt.
Market reaction
USD/JPY is testing multi-decade highs near 155.50 despite the Japanese verbal intervention, up 0.04% on the day.
Japanese Yen FAQs
The Japanese Yen (JPY) is one of the world’s most traded currencies. Its value is broadly determined by the performance of the Japanese economy, but more specifically by the Bank of Japan’s policy, the differential between Japanese and US bond yields, or risk sentiment among traders, among other factors.
One of the Bank of Japan’s mandates is currency control, so its moves are key for the Yen. The BoJ has directly intervened in currency markets sometimes, generally to lower the value of the Yen, although it refrains from doing it often due to political concerns of its main trading partners. The current BoJ ultra-loose monetary policy, based on massive stimulus to the economy, has caused the Yen to depreciate against its main currency peers. This process has exacerbated more recently due to an increasing policy divergence between the Bank of Japan and other main central banks, which have opted to increase interest rates sharply to fight decades-high levels of inflation.
The BoJ’s stance of sticking to ultra-loose monetary policy has led to a widening policy divergence with other central banks, particularly with the US Federal Reserve. This supports a widening of the differential between the 10-year US and Japanese bonds, which favors the US Dollar against the Japanese Yen.
The Japanese Yen is often seen as a safe-haven investment. This means that in times of market stress, investors are more likely to put their money in the Japanese currency due to its supposed reliability and stability. Turbulent times are likely to strengthen the Yen’s value against other currencies seen as more risky to invest in.
- AUD/JPY continues its winning streak after the stronger Australian CPI was released on Wednesday.
- Australia’s 10-year government bond yield has surged to 4.49% near five-month highs on waning expectations of the RBA rate cuts.
- The Japanese Yen continues to depreciate as the BoJ is expected to abstain from implementing rate hikes on Friday.
AUD/JPY edges higher for the fourth consecutive session on Thursday. The Australian Dollar (AUD) found support following the release of Australian Consumer Price Index (CPI) data on Wednesday, which exceeded expectations. This development hints at a potentially hawkish stance for the Reserve Bank of Australia’s (RBA) monetary policy, bolstering the AUD and subsequently supporting the AUD/JPY pair.
Australia’s 10-year government bond yield has surged above 4.49%, nearing five-month highs, as robust domestic inflation figures have strengthened expectations of the RBA delaying interest rate cuts. Moreover, easing tensions in the Middle East has fostered a positive market sentiment, benefiting risk-sensitive currencies like the AUD.
The Japanese Yen (JPY) continues to depreciate ahead of the upcoming release of the Bank of Japan’s (BoJ) Monetary Policy Statement scheduled for Friday. It's widely anticipated that the BoJ will abstain from implementing rate hikes in this meeting.
According to reports from Nikkei, the BoJ is likely to deliberate on the "impact of accelerating Yen depreciation," indicating that the central bank may intervene in the foreign exchange markets if the JPY weakens.
Daily Digest Market Movers: AUD/JPY appreciates on hawkish sentiment surrounding RBA
- According to Luci Ellis, Westpac's chief economist and former Assistant Governor (Economic) at the Reserve Bank of Australia, inflation slightly surpassed expectations in the March quarter. They anticipate the Board will maintain interest rates in May and have revised the projected date for the initial rate reduction from September to November this year.
- Australia’s Consumer Price Index (CPI) rose by 1.0% QoQ in the first quarter of 2024, against the expected 0.8% and 0.6% prior. CPI (YoY) increased by 3.6% compared to the forecasted 3.4% for Q1 and 4.1% prior.
- Australia’s Monthly Consumer Price Index (YoY) rose by 3.5% in March, against the market expectations and the previous reading of 3.4%.
- On Tuesday, Australia's Judo Bank Composite Purchasing Managers Index (PMI) surged to a 24-month high, indicating an improvement from the previous month. While the Manufacturing PMI reached an eight-month high, the Services PMI declined to a two-month low. This has bolstered the hawkish sentiment for the RBA’s stance on its interest rate trajectory.
- According to the Japan Times, the proportion of Japanese companies intending to increase their pay scales reached 70.7%, marking a rise of 6.3 percentage points from the previous year. Additionally, the number of companies planning to implement pay-scale hikes and regular pay increases totaling 5% or more amounted to 36.5%, nearly doubling from the previous year. This could provide support for the Yen.
- Reuters reported that Bank of Japan (BoJ) Governor Kazuo Ueda reiterated on Tuesday that the central bank would raise interest rates again if trend inflation accelerates toward its 2% target, in line with its forecast. Ueda also said that it is hard to predict in advance the ideal timeframe for the Bank of Japan (BoJ) to gather sufficient data before considering a policy change.
- The Tokyo Consumer Price Index (CPI) for the year ended April is scheduled to be released during the early Friday session in Japan.
Technical Analysis: AUD/JPY moves above the psychological level of 101.00
The AUD/JPY trades around 101.10 on Thursday, edging towards the upper boundary of the daily ascending channel after surpassing April’s high of 100.81. Moreover, the 14-day Relative Strength Index (RSI) is trending above the 50-level, indicating a bullish sentiment. The immediate resistance is seen at the major level of 101.50.
In case of a downside movement, immediate support for the AUD/JPY pair could be found at the psychological level of 101.00, followed by the major support level of 100.81. A breach below this level might lead to a further decline toward the support level of 99.65, followed by the lower boundary of the ascending channel around the level of 99.00.
AUD/JPY: Daily Chart
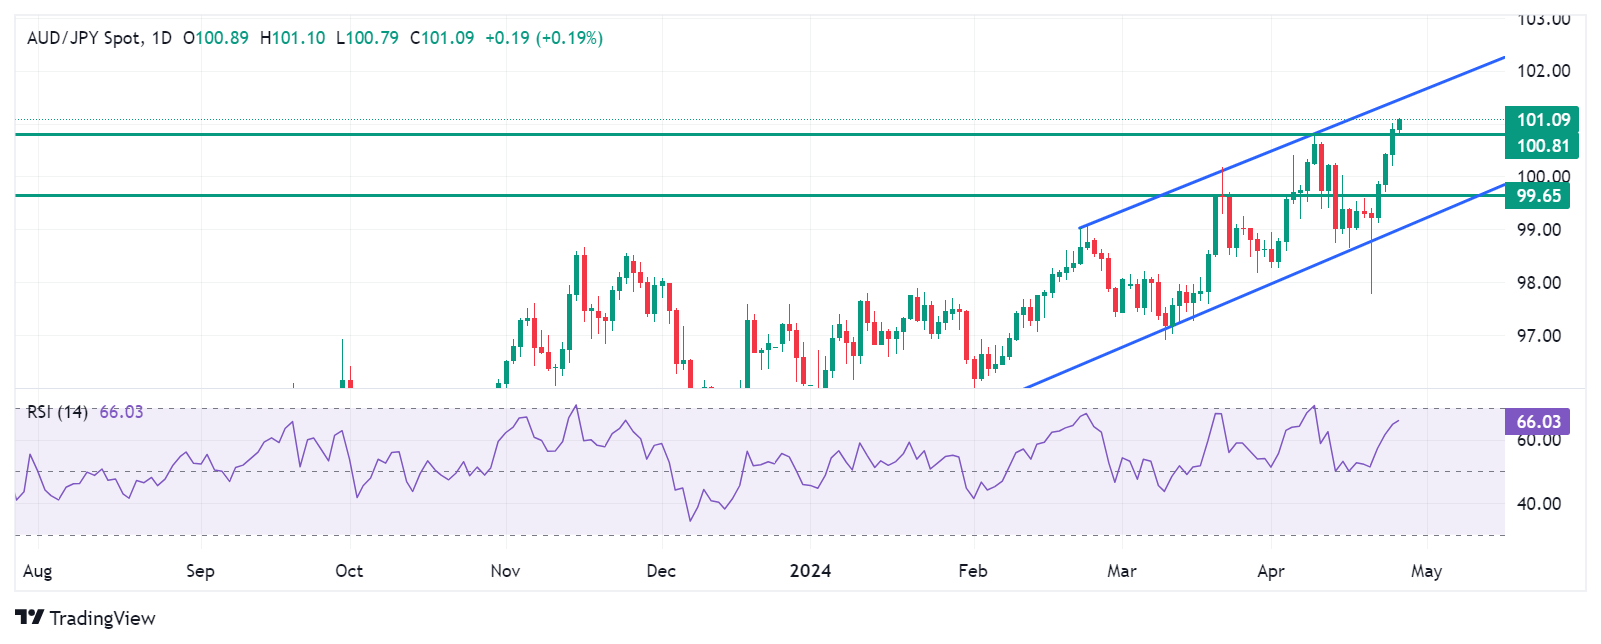
Australian Dollar price this week
The table below shows the percentage change of the Australian Dollar (AUD) against listed major currencies this week. The Australian Dollar was the strongest against the Japanese Yen.
| USD | EUR | GBP | CAD | AUD | JPY | NZD | CHF | |
| USD | -0.46% | -0.71% | -0.29% | -1.22% | 0.49% | -0.70% | 0.35% | |
| EUR | 0.46% | -0.24% | 0.17% | -0.74% | 0.94% | -0.22% | 0.80% | |
| GBP | 0.70% | 0.24% | 0.40% | -0.50% | 1.18% | 0.01% | 1.05% | |
| CAD | 0.29% | -0.17% | -0.40% | -0.92% | 0.78% | -0.41% | 0.64% | |
| AUD | 1.20% | 0.75% | 0.50% | 0.91% | 1.68% | 0.51% | 1.55% | |
| JPY | -0.49% | -0.95% | -1.20% | -0.77% | -1.70% | -1.19% | -0.14% | |
| NZD | 0.68% | 0.23% | -0.03% | 0.39% | -0.52% | 1.17% | 1.04% | |
| CHF | -0.35% | -0.81% | -1.06% | -0.64% | -1.56% | 0.14% | -1.04% |
The heat map shows percentage changes of major currencies against each other. The base currency is picked from the left column, while the quote currency is picked from the top row. For example, if you pick the Euro from the left column and move along the horizontal line to the Japanese Yen, the percentage change displayed in the box will represent EUR (base)/JPY (quote).
Australian Dollar FAQs
One of the most significant factors for the Australian Dollar (AUD) is the level of interest rates set by the Reserve Bank of Australia (RBA). Because Australia is a resource-rich country another key driver is the price of its biggest export, Iron Ore. The health of the Chinese economy, its largest trading partner, is a factor, as well as inflation in Australia, its growth rate and Trade Balance. Market sentiment – whether investors are taking on more risky assets (risk-on) or seeking safe-havens (risk-off) – is also a factor, with risk-on positive for AUD.
The Reserve Bank of Australia (RBA) influences the Australian Dollar (AUD) by setting the level of interest rates that Australian banks can lend to each other. This influences the level of interest rates in the economy as a whole. The main goal of the RBA is to maintain a stable inflation rate of 2-3% by adjusting interest rates up or down. Relatively high interest rates compared to other major central banks support the AUD, and the opposite for relatively low. The RBA can also use quantitative easing and tightening to influence credit conditions, with the former AUD-negative and the latter AUD-positive.
China is Australia’s largest trading partner so the health of the Chinese economy is a major influence on the value of the Australian Dollar (AUD). When the Chinese economy is doing well it purchases more raw materials, goods and services from Australia, lifting demand for the AUD, and pushing up its value. The opposite is the case when the Chinese economy is not growing as fast as expected. Positive or negative surprises in Chinese growth data, therefore, often have a direct impact on the Australian Dollar and its pairs.
Iron Ore is Australia’s largest export, accounting for $118 billion a year according to data from 2021, with China as its primary destination. The price of Iron Ore, therefore, can be a driver of the Australian Dollar. Generally, if the price of Iron Ore rises, AUD also goes up, as aggregate demand for the currency increases. The opposite is the case if the price of Iron Ore falls. Higher Iron Ore prices also tend to result in a greater likelihood of a positive Trade Balance for Australia, which is also positive of the AUD.
The Trade Balance, which is the difference between what a country earns from its exports versus what it pays for its imports, is another factor that can influence the value of the Australian Dollar. If Australia produces highly sought after exports, then its currency will gain in value purely from the surplus demand created from foreign buyers seeking to purchase its exports versus what it spends to purchase imports. Therefore, a positive net Trade Balance strengthens the AUD, with the opposite effect if the Trade Balance is negative.
- WTI edges lower to $82.45 on Thursday as the fear of wider war in the Middle East eased.
- Higher bets that the US Fed will delay rate cuts support the Greenback.
- US commercial crude stockpiles last week fell by 6.368 million barrels, the largest drawdown since mid-January.
Western Texas Intermediate (WTI), the US crude oil benchmark, is trading around $82.45 on Thursday. The black gold edges lower as the fear over wider conflict in the Middle East fades. Additionally, the hawkish tone from the Federal Reserve (Fed) boosts the US dollar (USD) and caps the upside of black gold.
Perceived de-escalation between Iran and Israel, and the flow of oil from the Middle East, which has not been interrupted by conflict in the region, dragged the WTI prices lower in the last few sessions. However, any sign of rising tensions in the Middle East and stricter sanctions against Iran might cap the downside of the WTI price.
Furthermore, the growing speculation that the US Federal Reserve (Fed will delay the interest rate provides some support to the Greenback and acts as a headwind for the black gold price. It’s worth noting that a strong dollar makes oil more expensive for holders of other currencies. Several US Fed officials noted that rate cuts aren’t coming in the coming months as inflation remains stickier than expected.
On the other hand. The US commercial crude stockpiles for the week ending April 19 fell by 6.368 million barrels from the previous reading of 2.735 million barrels built. This reading registered the largest drawdown since mid-January, according to data from the Energy Information Administration.
The People’s Bank of China (PBoC) set the USD/CNY central rate for the trading session ahead on Thursday at 7.1058 as compared to the previous day's fix of 7.1048 and 7.2472 Reuters estimates.
- EUR/USD posts modest gains near 1.0700 on the weaker USD on Thursday.
- US Durable Goods Orders increased by 2.6% MoM in March vs. 0.7% prior; Core Goods rose by 0.2% MoM, worse than expected.
- The dovish stance of the ECB, which sticks to plans to cut interest rates this year, weighs on the Euro.
- Traders will monitor the release of US Q1 GDP growth number data.
The EUR/USD pair hovers around the 1.0700 psychological level on Thursday during the early Asian session. The modest uptick of the major pair is supported by the softer US Dollar (USD). Later in the day, Germany’s GfK Consumer Confidence Survey for April will be released. Additionally, the US preliminary Gross Domestic Product (GDP) growth number will be due.
The US Department of Commerce revealed on Wednesday that Durable Goods Orders in the United States increased 2.6% MoM in March from a 0.7% rise in the previous reading, beating the estimation of 2.5%. Core goods, which excluded transportation, rose by 0.2% MoM, missing the expectation of 0.3%.
The release of US GDP for the first quarter could offer clues of how strong the economy is growing and point to the Fed's next move. If the report shows stronger-than-expected data, this might trigger speculation that the Fed will delay the rate cut cycle and boost the Greenback. Markets have priced in nearly 70% odds that the US Federal Reserve (Fed) will cut its benchmark rate in September, according to the CME FedWatch tool,
Across the pond, the European Central Bank (ECB) policymakers stick to plans to cut interest rates this year, even though elevated US inflation might delay a pivot to looser policy by the Fed. The ECB President Christine Lagarde suggested that the central bank may cut its deposit rate from a record-high 4% in June, but has kept its options open for further action. The dovish stance of the ECB exerts some selling pressure on the Euro (EUR) and creates a headwind for the EUR/USD pair.
| Index | Change, points | Closed | Change, % |
|---|---|---|---|
| NIKKEI 225 | 907.92 | 38460.08 | 2.42 |
| Hang Seng | 372.34 | 17201.27 | 2.21 |
| KOSPI | 52.73 | 2675.75 | 2.01 |
| ASX 200 | -0.5 | 7683 | -0.01 |
| DAX | -48.95 | 18088.7 | -0.27 |
| CAC 40 | -13.92 | 8091.86 | -0.17 |
| Dow Jones | -42.77 | 38460.92 | -0.11 |
| S&P 500 | 1.08 | 5071.63 | 0.02 |
| NASDAQ Composite | 16.11 | 15712.75 | 0.1 |
| Pare | Closed | Change, % |
|---|---|---|
| AUDUSD | 0.64952 | 0.1 |
| EURJPY | 166.051 | 0.24 |
| EURUSD | 1.06963 | -0.06 |
| GBPJPY | 193.424 | 0.37 |
| GBPUSD | 1.24594 | 0.07 |
| NZDUSD | 0.5933 | -0.03 |
| USDCAD | 1.37026 | 0.29 |
| USDCHF | 0.91452 | 0.3 |
| USDJPY | 155.243 | 0.29 |
FOREIGN EXCHANGE MARKET NEWS
CURRENCY MARKET DEFINITION
The concept of currency market has several definitions:
- Currency market is the sphere of economic relations that are manifested in the purchase and sale of currency values (foreign currency, securities in foreign currency), as well as operations related to the investment of capital in foreign currency;
- Currency market is a financial center where currency purchase and sale transactions based on supply and demand for them are concentrated;
- Curency market is a whole of authorized banks, investment companies, brokerages, exchanges, and foreign banks that perform foreign exchange operations.
- Currency market is a whole of communications systems that link banks in different countries that conduct international currency transactions.
Simply put, currency market is the market where currency transactions are made, that is, the currency of one country is exchanged for the currency of another country at a certain exchange rate. The exchange rate is the relative price of currencies of two countries or the currency of one country expressed in another country's monetary units.
Currency market is part of the global financial market, where many operations related to the global movement of capital take place.
TYPES OF MARKETS. RUSSIAN AND INTERNATIONAL CURRENCY MARKETS
There are international and domestic currency markets.
Domestic currency market — is a market within a single country.
The international currency market — is a global market that covers currency markets of all countries in the world. It does not have a specific site where trading is carried out. All operations within it are carried out through a system of cable and satellite channels that link the world's regional currency markets. Regional markets today include the Asian (with centers in Tokyo, Hong Kong, Singapore, and Melbourne), the European (London, Frankfurt am Main, and Zurich), and the American (New York, Chicago, and Los Angeles) markets.
Currency trading on the international currency market is carried out on the basis of market exchange rates, which are set on the basis of supply and demand in the market and under the influence of various macroeconomic data. Forex is the international currency market.
Currency markets can also be divided into exchange and over-the-counter markets. Exchange currency market is an organized market where trading is carried out through an exchange—a special company that sets trading rules and provides all the conditions for organizing trading under these rules.
Over-the-counter currency market — is a market where there are no certain trading rules, and purchase and sale operations are not linked to a specific place of trade, as opposed to the case of an exchange.
As a rule, an over-the-counter currency market is organized by special companies that provide services for the purchase and sale of currencies, which may or may not be members of the currency exchange. Trading operations in this market are now carried out mainly via the Internet.
The over-the-counter currency market is much larger than the exchange market in terms of trading volume. The Forex international over-the-counter currency market is considered the most liquid in the world. It operates around the clock in all financial centers of the world (from New York to Tokyo).
CURRENCY MARKET FUNCTIONS
Currency market— is the most important platform for ensuring the normal course of all global economic processes.
The main macroeconomic functions of the currency market are:
- creating conditions for the subjects of foreign exchange relations to make timely international current and capital payments and thereby promoting the development of foreign trade;
- providing conditions and mechanisms for the implementation of monetary and economic policy of the state;
- diversifying foreign exchange reserves;
- forming the exchange rate under the influence of supply and demand;
NEWS IMPACT
Various currencies are the main trading tool in the currency market. Exchange rates are formed under the influence of supply and demand in the market.
In addition to that, currency rates are influenced by many fundamental factors related to the global economic situation, events in national economies, and political decisions.
News about these factors can be found in various sources:
- Reports showing a country´s level of economic development.
The more stable an economy is developing, the more stable its currency is. Accordingly, it is possible to predict how the currency will behave in the near future, based on statistical data published in official sources of countries with a certain regularity.
This data includes:
- GDP
- unemployment;
- return on equity;
- consumer price index;
- industrial price index;
- propensity to consume;
- salaries outside of the agricultural sector;
- residential construction, etc.
Interest rate level, set by national authorities regulating credit policy, is an equally important indicator. In the European Union, this is ECB–the European Central Bank, in the US, this is the Federal Reserve System, in Japan—the Bank of Japan, in the UK—the Bank of England, in Switzerland—the Swiss national Bank, etc.
The interest rate level is determined at meetings of the national central bank. Then, the decision on the rate is published in official sources. If the central bank of a country reduces the interest rate, the money supply in the country increases, and the national currency depreciates against other world currencies. If the interest rate increases, the national currency will strengthen.
- Speeches of country leaders, leading economists and analysts.
A speech or even a separate statement by a country's leader can reverse a trend. Speeches on these topics may change the currency exchange rate:
- analysis of the situation on the currency market;
- changes in monetary or economic policy;
- adoption of a budget policy;
- forecasts of the economic situation, etc.
All this news is published in various sources. Major international news is more or less easy to find in Russian, but news related to the domestic economic policy and the economy of foreign countries is much less common in the Russian press. Mostly, such news is published by the national media and in the language of the country where the news is published.
It is very difficult for one person to follow all the news at once, and they are likely to miss some important event that can turn the whole situation on the market upside down. Guided by our main principle—to create the best trading conditions for our customers—we try to select the most important news from all over the world and publish them on our website.
The TeleTRADE Department of Analytics monitors news on most national and international news sources on a daily basis and identifies those that can potentially affect exchange rates. These are the main news items that are included in our news feed.
In addition, all our clients have free access to the Dow Jones news feed. This is a joint project of Dow Jones Newswires, the world's largest news agency, and the leading Russian news agency Prime-TASS. The news feed is created specifically for currency traders and those who are interested in getting information about the world's currency markets.


© 2000-2024. All rights reserved.
This site is managed by Teletrade D.J. LLC 2351 LLC 2022 (Euro House, Richmond Hill Road, Kingstown, VC0100, St. Vincent and the Grenadines).
The information on this website is for informational purposes only and does not constitute any investment advice.
The company does not serve or provide services to customers who are residents of the US, Canada, Iran, The Democratic People's Republic of Korea, Yemen and FATF blacklisted countries.
Making transactions on financial markets with marginal financial instruments opens up wide possibilities and allows investors who are willing to take risks to earn high profits, carrying a potentially high risk of losses at the same time. Therefore you should responsibly approach the issue of choosing the appropriate investment strategy, taking the available resources into account, before starting trading.
Use of the information: full or partial use of materials from this website must always be referenced to TeleTrade as the source of information. Use of the materials on the Internet must be accompanied by a hyperlink to teletrade.org. Automatic import of materials and information from this website is prohibited.
Please contact our PR department if you have any questions or need assistance at pr@teletrade.global.
transfers