- Analytics
- News and Tools
- Market News
Market Trading News and Research from 20 April 2024
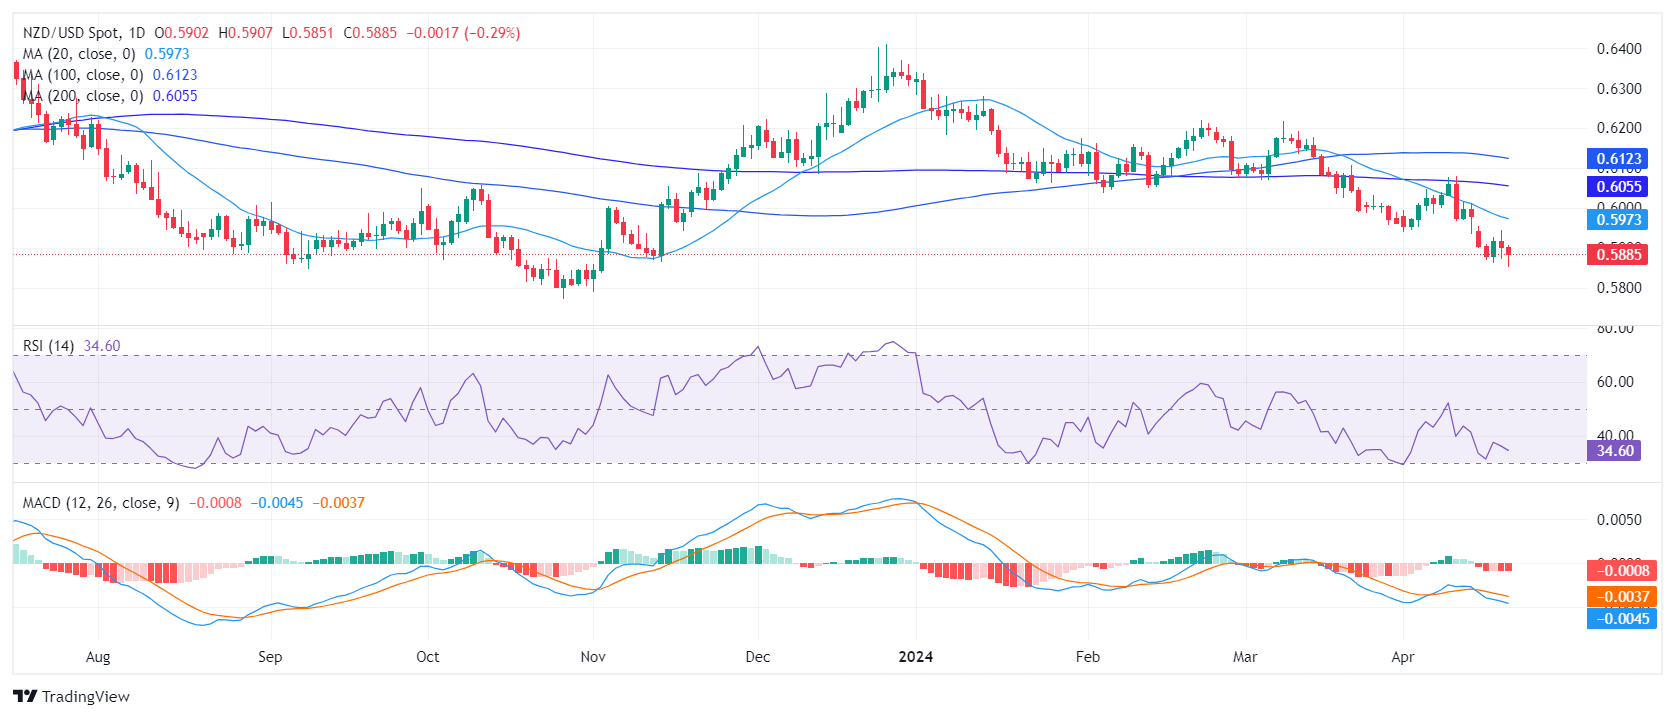
- The daily RSI for the NZD/USD reveals growing selling pressure, nearing oversold conditions.
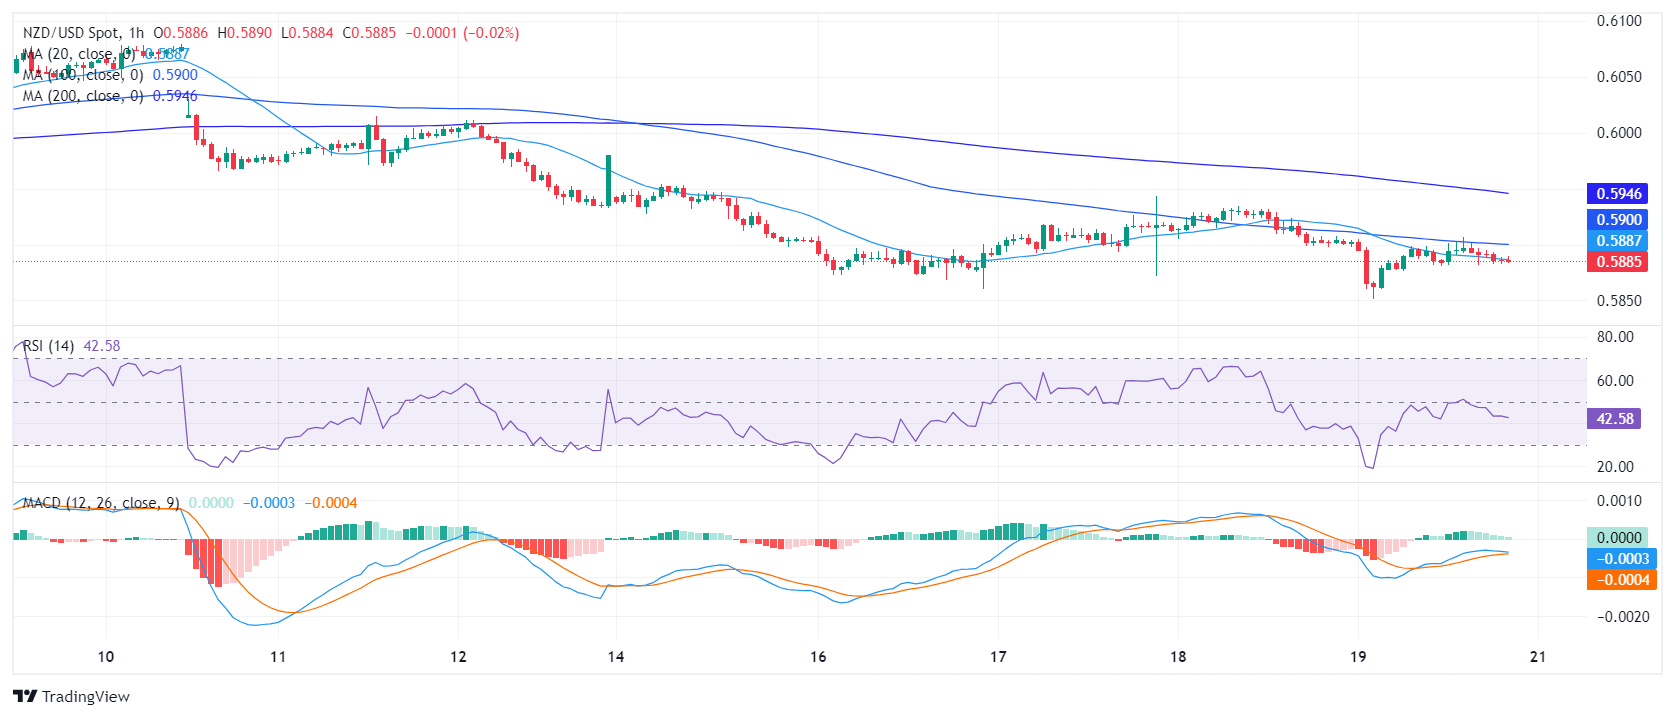
- The hourly indicators also remain weak.
- The pair will close a 0.80% losing week.
The NZD/USD pair saw a 0.25% loss on Friday’s sessing and continues exhibiting a significant bearish tendency. Both short-term and long-term outlooks suggest the prevalence of sellers, which may signal that the pair is bound for further downside.
On the daily chart, the Relative Strength Index (RSI) indicates a bearish trend. It lies deep in negative terrain and edged near oversold territory. The escalating red bars on the Moving Average Convergence Divergence (MACD) histogram align with this bearish stance, augmenting this downturn prediction.
NZD/USD daily chart
On the hourly chart, the RSI also points south standing below 50 while the MACD exhibits dwindling green bars, indicative of reduced buying momentum.
NZD/USD hourly chart
From a wider viewpoint, NZD/USD presently exhibits a clear bearish trend, given its position below the Simple Moving Average (SMA) for 20, 100, and 200-day periods. However, as indicators approach oversold conditions, the pair may stage a corrective rebound which could give the buyers a chance to reclaim the 20-day SMA. In the meantime, movements below these levels would leave the trend bearish.
- GBP/JPY drops 0.56%, as rising Israel-Iran tensions drive safe-haven flows to the Yen.
- Though lower, the pair stays bullish above the Ichimoku Cloud, with recovery possible upon reclaiming 192.00.
- Watch key levels: Immediate support at the Kijun Sen at 191.06, with potential further drops towards 190.55.
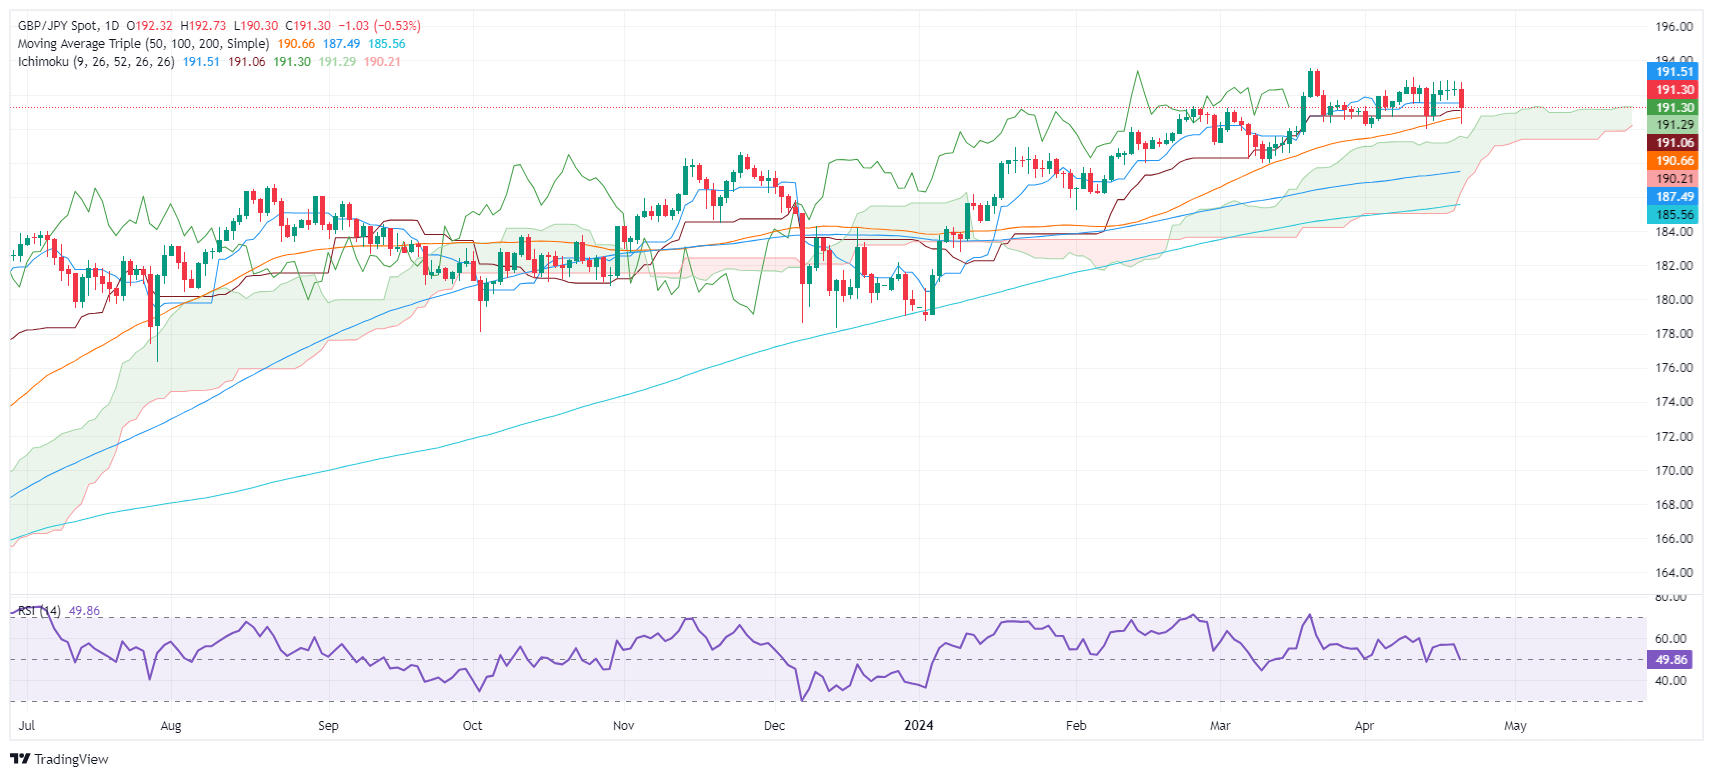
After consolidating around 192.00 for the last three days, the GBP/JPY finally tumbled to the 191.00 handle. A flight to safe-haven assets spurred by an escalation of the Israel-Iran conflict boosted the Japanese Yen (JPY) to the detriment of the Pound Sterling. At the time of writing, the cross has lost 0.56% and trades at 191.19.
GBP/JPY Price Analysis: Technical outlook
The GBP/JPY remains above the Ichimoku Cloud (Kumo), suggesting the pair is bullish. Despite sliding below key support levels, like the Tenkan and Kijun Sen, the 50-day moving average (DMA), and hitting a daily low of 190.29, the pair resumed its recovery to the current exchange rates.
For a bullish continuation, traders must reclaim 192.00 before breaking the next resistance area at 192.80. Once cleared that would expose the 193.00 psychological level, followed by the year-to-date (YTD) high at 193.54.
On the other hand, if the pair slips below the Kijun Sen level at 191.06, that would exacerbate a drop below the confluence of an upslope support trendline and the 50-day moving average (DMA) at 190.55.
GBP/JPY Price Action – Daily Chart
- USD/JPY recovers after hitting a four-day low, as Tehran’s non-retaliatory stance calms market fears.
- Consolidation near 155.00 under scrutiny, with Japanese officials wary of excessive forex volatility.
- Technical levels to watch: support at Tenkan-Sen 153.18, with further supports at 152.29 and 151.41.
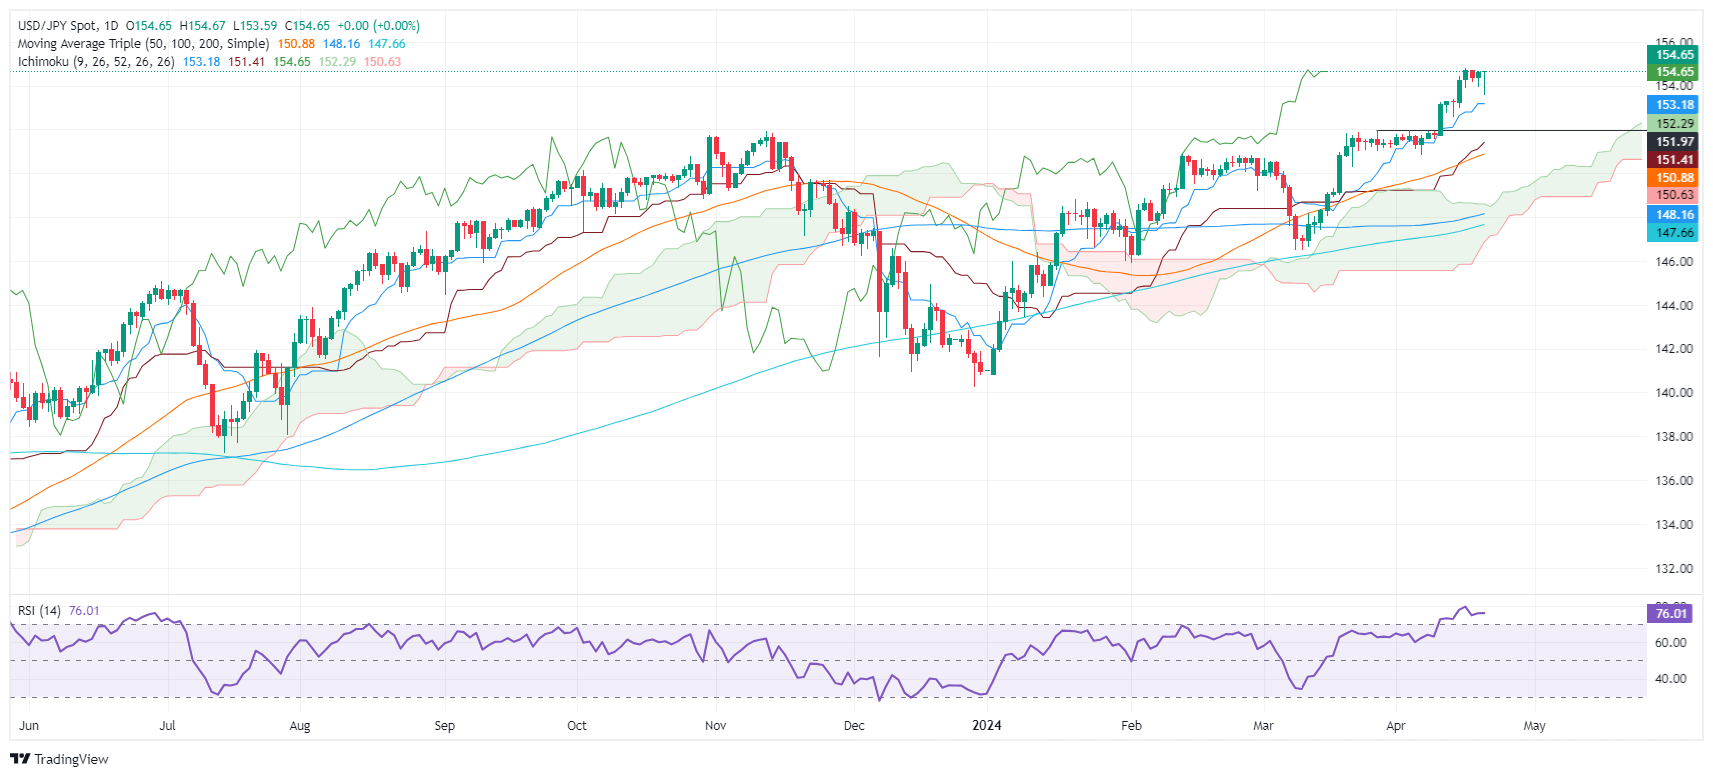
The USD/JPY consolidated at around the 154.60s area on Friday after diving to a four-day low of 153.59, courtesy of heightened geopolitical tensions spurred by the escalation of the Israel-Iran conflict. Nevertheless, Tehran downplayed the attacks, adding they don’t plan to retaliate. That eased off pressure on the financial markets, as witnessed by the correction in the major. The pair trades at 154.62, virtually unchanged.
USD/JPY Price Analysis: Technical outlook
The daily chart portrays the pair consolidated at around peak highs, shy of the 155.00 psychological figure. Japanese authorities jawboning about desirable, orderly moves in the Forex markets keep buyers nervous about pushing the USD/JPY past 155.00. However, once breached, if authorities would not intervene, that would expose the August 1990 high of 155.78, followed by the April 1990 high at 160.32.
Otherwise, if sellers stepped in and pushed the exchange rate below 154.00, that would pave the way for a pullback. The first support would be the Tenkan-Sen at 153.18. Further weakness in the USD/JPY would drive prices past the Senkou Span A at 152.29, followed by the Kijun Sen at 151.41. Up next lies the 50-day moving average (DMA) at 150.89.
USD/JPY Price Action – Daily Chart
Japanese Yen FAQs
The Japanese Yen (JPY) is one of the world’s most traded currencies. Its value is broadly determined by the performance of the Japanese economy, but more specifically by the Bank of Japan’s policy, the differential between Japanese and US bond yields, or risk sentiment among traders, among other factors.
One of the Bank of Japan’s mandates is currency control, so its moves are key for the Yen. The BoJ has directly intervened in currency markets sometimes, generally to lower the value of the Yen, although it refrains from doing it often due to political concerns of its main trading partners. The current BoJ ultra-loose monetary policy, based on massive stimulus to the economy, has caused the Yen to depreciate against its main currency peers. This process has exacerbated more recently due to an increasing policy divergence between the Bank of Japan and other main central banks, which have opted to increase interest rates sharply to fight decades-high levels of inflation.
The BoJ’s stance of sticking to ultra-loose monetary policy has led to a widening policy divergence with other central banks, particularly with the US Federal Reserve. This supports a widening of the differential between the 10-year US and Japanese bonds, which favors the US Dollar against the Japanese Yen.
The Japanese Yen is often seen as a safe-haven investment. This means that in times of market stress, investors are more likely to put their money in the Japanese currency due to its supposed reliability and stability. Turbulent times are likely to strengthen the Yen’s value against other currencies seen as more risky to invest in.
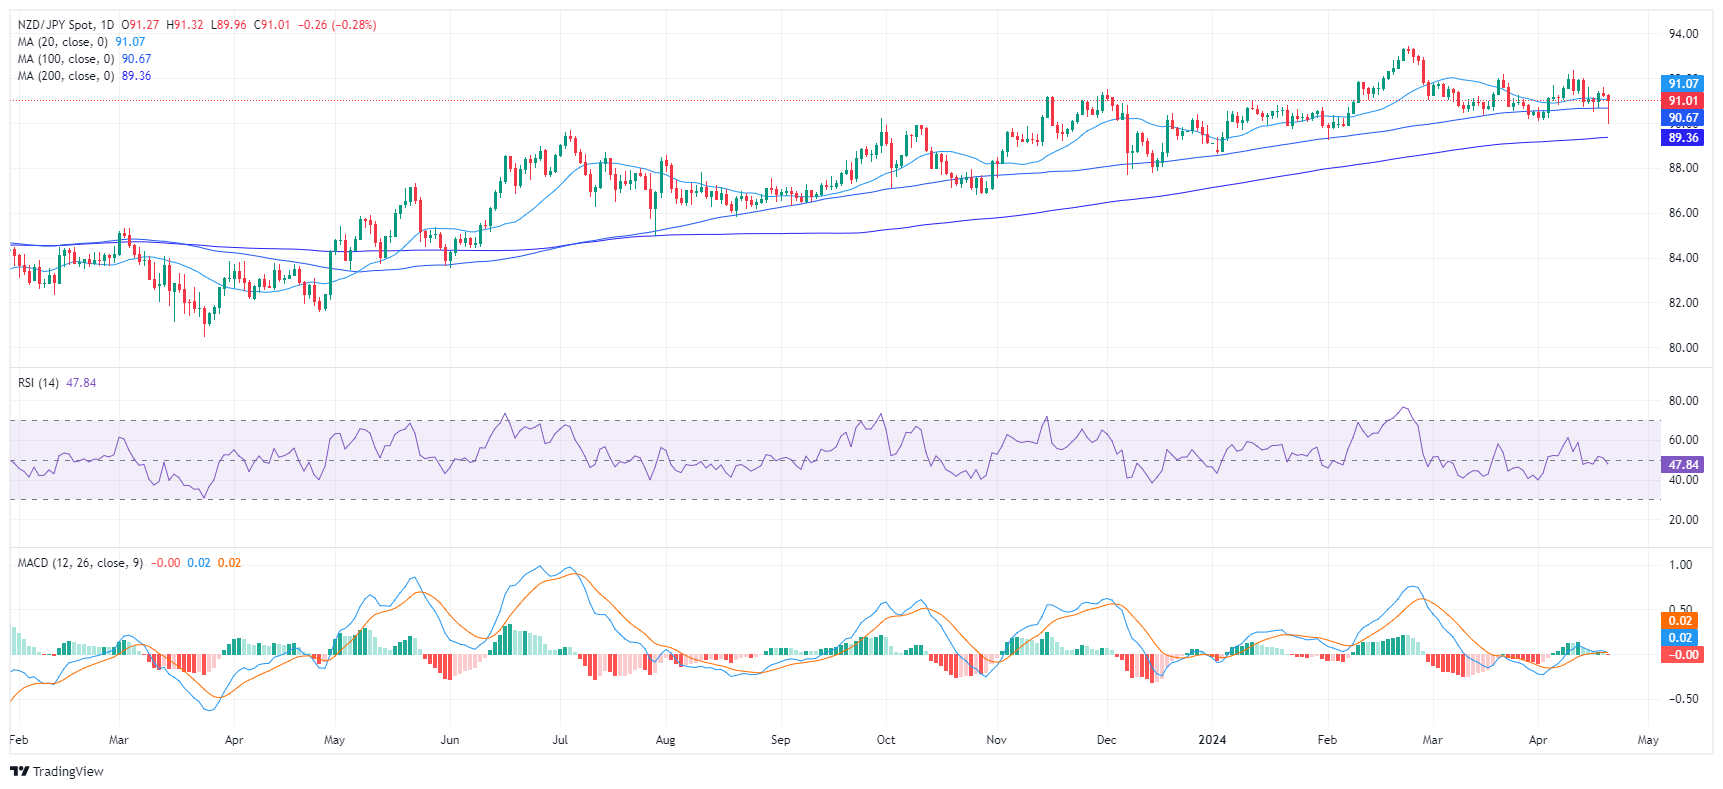
- The daily chart of the NZD/JPY indicates a weakening momentum, with RSI and MACD signifying rising selling pressure.
- The NZD/JPY plunged below the crucial short-term 20-day SMA, hinting at immediate bearish prospects.
- Despite recent bearish actions, the long-term outlook continues to favor buyers.
The NZD/JPY declined to 91.00, down by 0.27% on Friday. Bears are quietly gaining ground conquering the 20-day Simple Moving Average (SMA) and the selling traction is mounting. On the broader outlook, the trend is still bullish.
On the daily chart, the Relative Strength Index (RSI) pair reveals a recent drift into negative territory towards 47, indicating weakening momentum. Likewise, the Moving Average Convergence Divergence (MACD) paints a similar picture with a fresh red bar, signaling a growing bearish momentum. These indicators collectively imply sellers' dominance in the current market scenario.
NZD/JPY daily chart
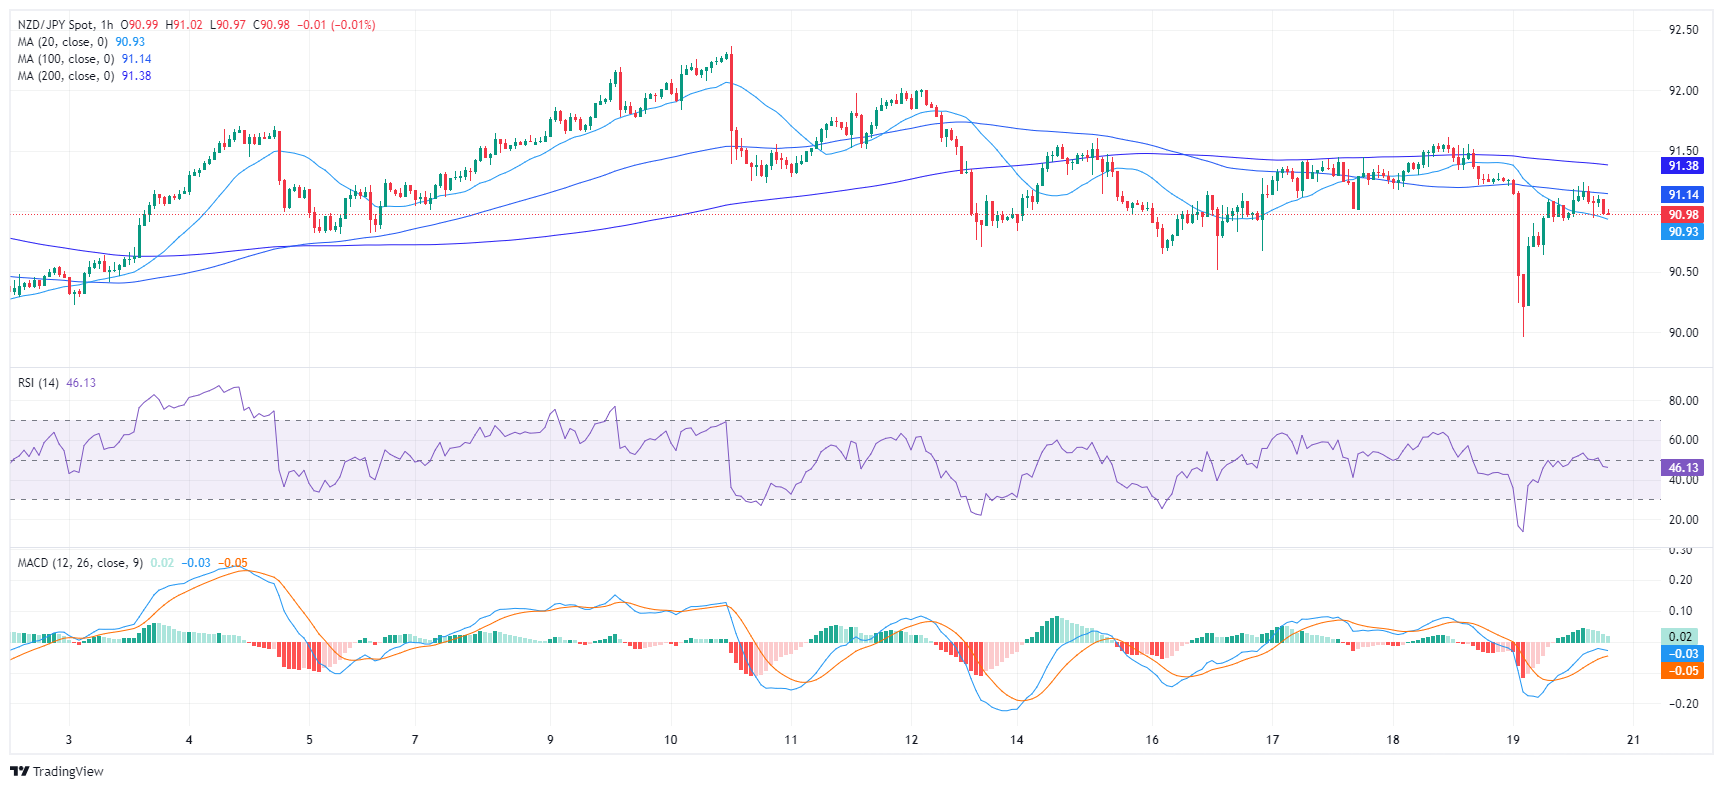
Upon examining the hourly chart, the RSI stands below its middle points, also adding arguments for a negative short-term outlook. In addition, the MACD histogram is printing decreasing green bars a clear indication of diminishing bullish momentum.
NZD/JPY hourly chart
When turning the lens to the broader landscape, NZD/JPY underwent substantial changes on Friday. The pair sunk beneath the 20-day Simple Moving Average (SMA), a significant short-term technical indicator, thus potentially establishing a bearish outlook in the immediate future. Despite this, the pair has managed to maintain its position above the 100-day and 200-day SMAs, revealing sustained bullish momentum over a more extended period. That being said, as bears gather ground, they might make a stride toward the 100-day SMA at around 90.60 which in case of conquering it, would worsen the outlook for the pair.
- Gold price peaked at $2,417 per ounce following escalating conflict between Israel and Iran with investors seeking safety.
- Prices stabilized around $2,394 after Tehran indicated no immediate plans for retaliation, calming initial fears.
- US Treasury yields and the US Dollar's decline support Gold's gains, although Fed officials hint at ongoing restrictive monetary policy.
Gold price hit a five-day high above the $2,400 figure amid an escalation of the Middle East conflict between Israel and Iran. An Israeli attack on Iran on Friday sent bullion toward its daily high of $2,417 a troy ounce as ebbs and flows flock to safety in the uncertainty of the outcome. However, the rally was short-lived as Tehran said it had no plans to retaliate.
XAU/USD trades at $2,394, registering gains of 0.70% after Golds seesawed $44.00 as traders digested Friday’s developments. Aside from this, the drop in US Treasury bond yields and the Greenback keeps the golden metal afloat. This is despite recent hawkish comments by Federal Reserve (Fed) officials, who have adopted a more neutral stance suggesting that the disinflationary process has stalled.
On Friday, Chicago Fed President Austan Goolsbee exited from its dovish stance and stated that the inflation progress had “stalled,” adding that “the Fed’s current restrictive policy is appropriate.” His words echoed comments made by Atlanta Fed’s Bostic and New York Fed’s Williams, who crossed the newswires on Thursday.
Bostic, one of the most hawkish members of the Federal Open Market Committee (FOMC), went beyond Goolsbee and Williams's comments, saying that the Fed wouldn’t reduce rates until the end of the year.
Daily digest market movers: Gold rises on risk-off mood despite hawkish Fed commentary
- Gold remained underpinned during the week by the geopolitical risks linked to the Middle East conflict following Iran’s attack on Israel. The non-yielding metal is on its way to registering more than 2.25% weekly gains.
- The10-year Treasury benchmark rate is up 8 basis points in the week at 4.615%. US real yields are also up 8 bps and will likely end the week near 2.215%.
- Data during the week: Strong US Retail Sales were the first piece of data to spark a repricing of interest rates set by the Fed. Consequently, the US 10-year note yield peaked at 4.696%, a level last seen in November 2023.
- Firm Industrial Production data for March and solid jobs data, with Initial Jobless Claims lower than expected, overshadowed the housing market's sudden weakness.
- Atlanta Fed’s Raphael Bostic noted that inflation is too high, and the US central bank still has a way to go to tame it. He added that the Fed won’t be able to reduce rates. Earlier, New York Fed President John Williams stated that the Fed is data-dependent and emphasized that monetary policy is in a good place, so he wasn’t in a rush to cut rates. His baseline doesn’t consider hiking rates but added that the Fed will hike if needed.
- CME FedWatch Tool shows that the first-rate cut could happen in September, with odds for a quarter percentage point cut at 67%, up from Thursday’s 66%.
- US Dollar Index (DXY), which tracks the buck’s performance against a basket of six other currencies, loses 0.05% to 106.15.
Technical analysis: Gold climbs on risk aversion as buyers lose steam
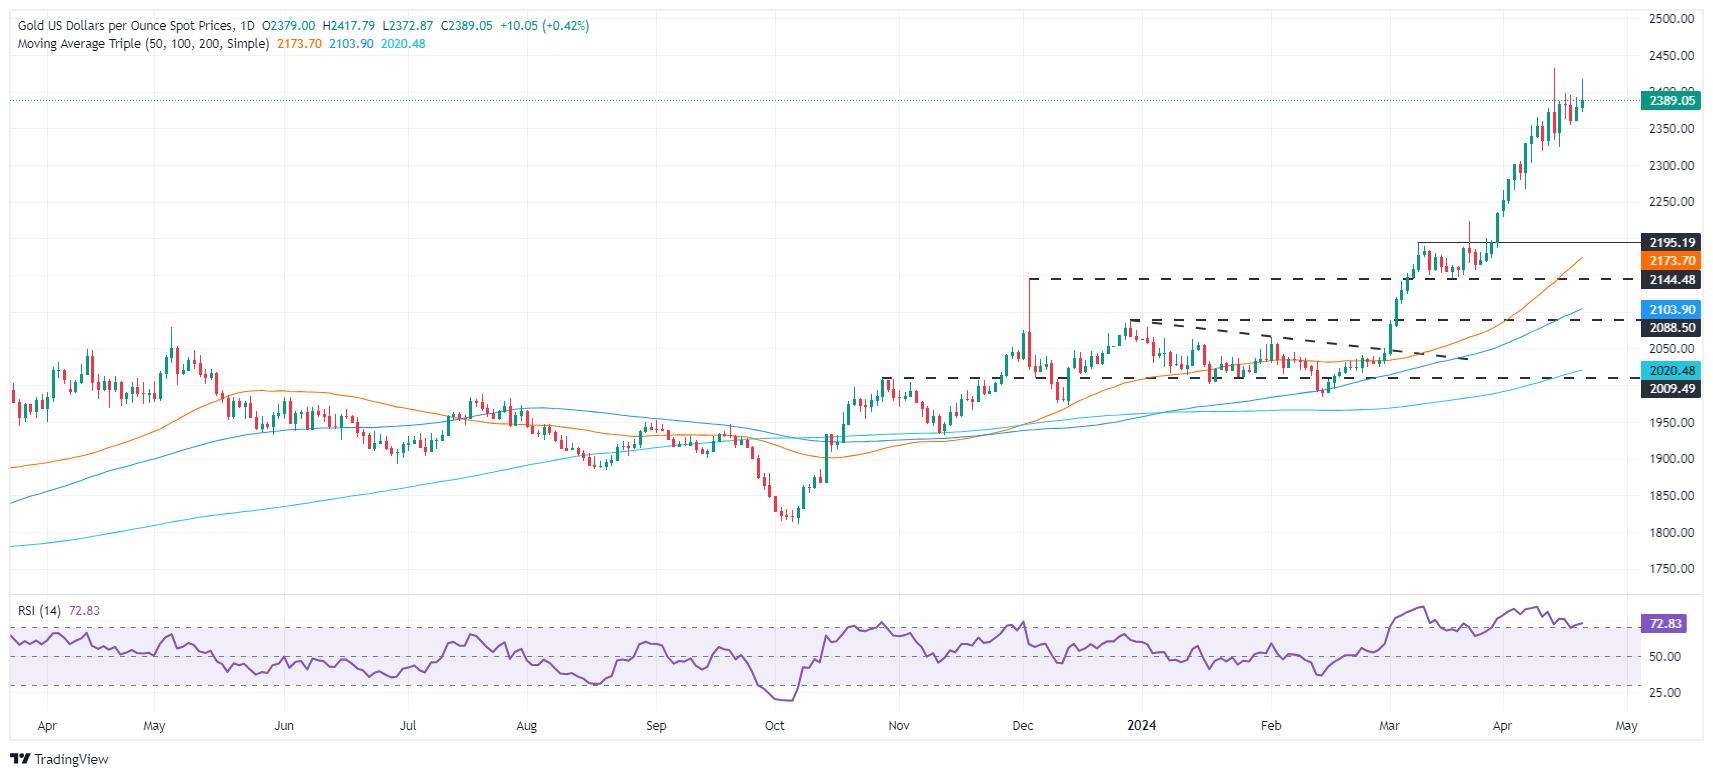
Gold price is upwardly biased, though it seems that buyers could be losing momentum as Friday’s spike to $2,417 was courtesy of risk aversion. The Relative Strength Index (RSI) remains at overbought levels, but it hasn’t surpassed the last peak, which means there’s a slight divergence between price action and momentum. That could pave the way for a pullback, but the most likely scenario is a continuation of the uptrend.
That said, XAU/USD's first resistance would be $2,400, followed by Friday’s high of $2,417. A breach of the latter will expose the all-time high of $2,431. On the other hand, if XAU/USD is headed for a correction, the first support would be the $2,350 mark, followed by the April 15 daily low of $2,324. Once surpassed, Gold might test $2,300.
Gold FAQs
Gold has played a key role in human’s history as it has been widely used as a store of value and medium of exchange. Currently, apart from its shine and usage for jewelry, the precious metal is widely seen as a safe-haven asset, meaning that it is considered a good investment during turbulent times. Gold is also widely seen as a hedge against inflation and against depreciating currencies as it doesn’t rely on any specific issuer or government.
Central banks are the biggest Gold holders. In their aim to support their currencies in turbulent times, central banks tend to diversify their reserves and buy Gold to improve the perceived strength of the economy and the currency. High Gold reserves can be a source of trust for a country’s solvency. Central banks added 1,136 tonnes of Gold worth around $70 billion to their reserves in 2022, according to data from the World Gold Council. This is the highest yearly purchase since records began. Central banks from emerging economies such as China, India and Turkey are quickly increasing their Gold reserves.
Gold has an inverse correlation with the US Dollar and US Treasuries, which are both major reserve and safe-haven assets. When the Dollar depreciates, Gold tends to rise, enabling investors and central banks to diversify their assets in turbulent times. Gold is also inversely correlated with risk assets. A rally in the stock market tends to weaken Gold price, while sell-offs in riskier markets tend to favor the precious metal.
The price can move due to a wide range of factors. Geopolitical instability or fears of a deep recession can quickly make Gold price escalate due to its safe-haven status. As a yield-less asset, Gold tends to rise with lower interest rates, while higher cost of money usually weighs down on the yellow metal. Still, most moves depend on how the US Dollar (USD) behaves as the asset is priced in dollars (XAU/USD). A strong Dollar tends to keep the price of Gold controlled, whereas a weaker Dollar is likely to push Gold prices up.
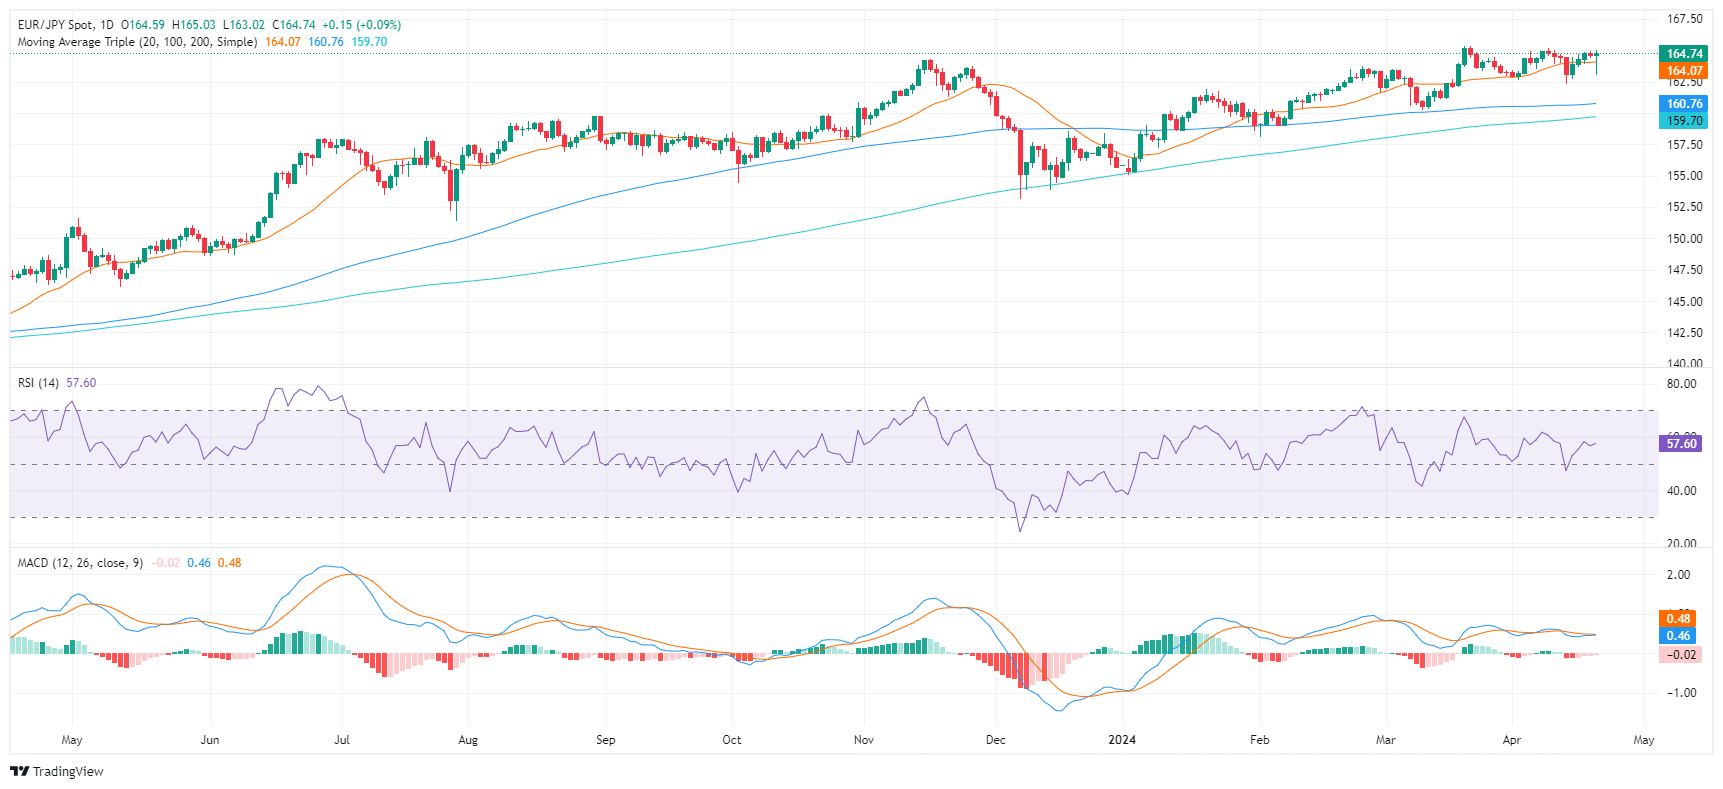
- Flattening indicators on the daily chart may signal a period of consolidation.
- The flat RSI slope and falling MACD bars on the hourly chart translate into a neutral sentiment for the session.
The EUR/JPY currency pair stands at 164.71, reflecting a persistent bullish upsurge as it cleared daily losses and defended the 20-day Simple Moving Averages (SMA). However, caution is warranted considering the shifting market environment as the flattening momentum, revealed on the daily and hourly chart may cool down the bullish outlook.
On the daily chart, the Relative Strength Index (RSI) pair is trending positive, at 58 but flattened. Simultaneously, the Moving Average Convergence Divergence (MACD) reveals red bars, hinting at a steady selling pressure.
EUR/JPY daily chart
Taking into account the hourly chart, the latest RSI value is just above the middle ground at 53, also with a flat slope. This signifies neutrality within the market. Meanwhile, the MACD decreasing green bars, signaling a potential slowdown in the upward pressure.
EUR/JPY hourly chart
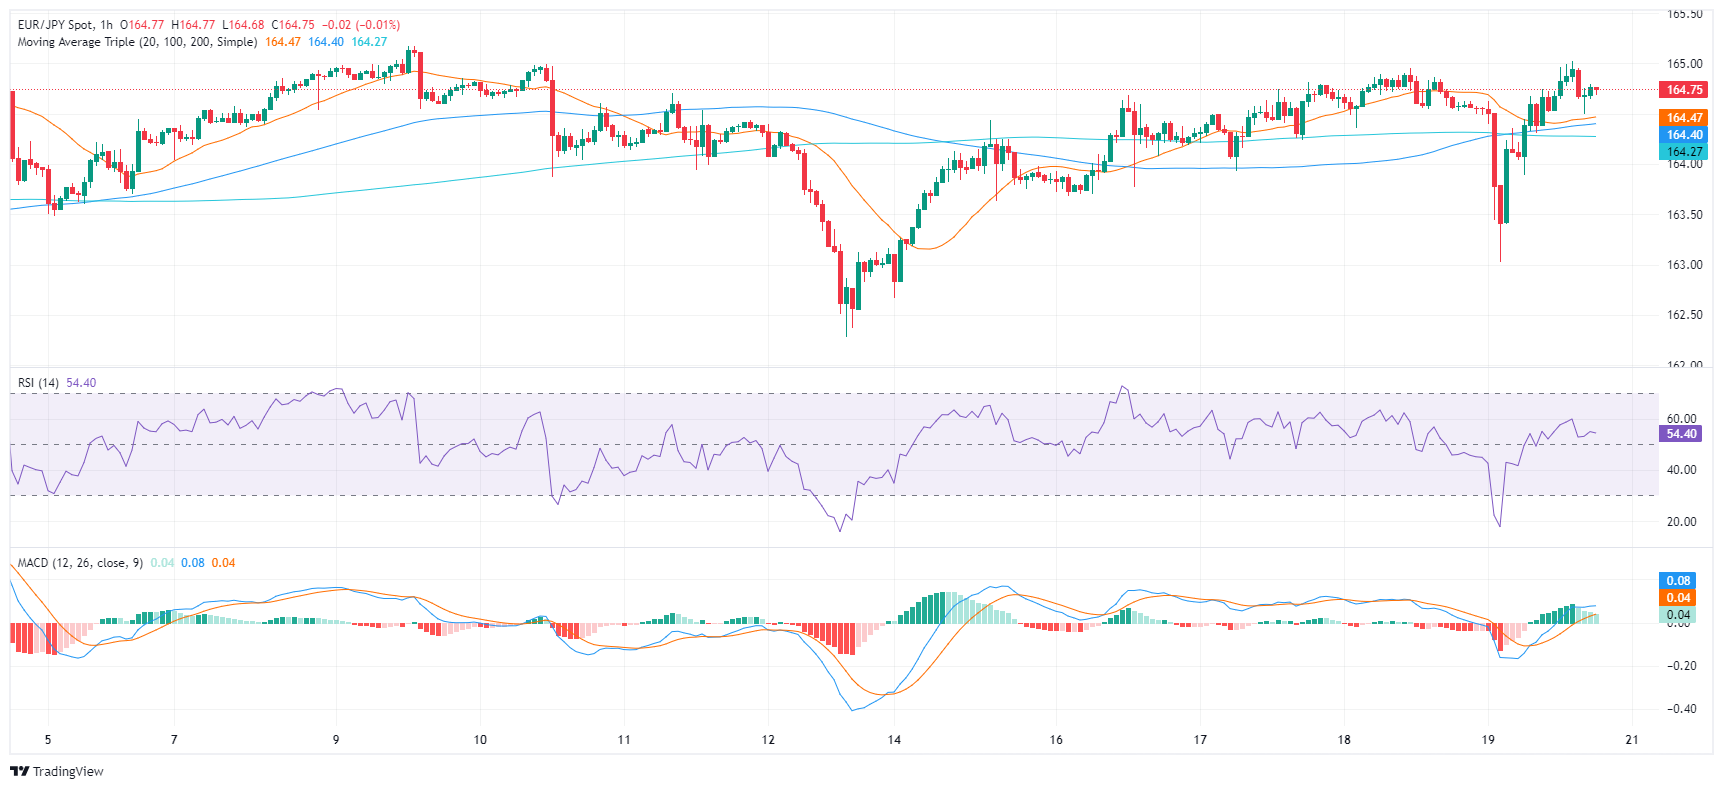
In light of the recent market conditions, the EUR/JPY lies above its 20,100, and 200-day SMA, depicting a sturdy ascending pattern in its broader outlook. It suggests the pair have shown resilience in maintaining the bullish momentum both from a short-term and long-term perspective. On Friday, the cross held onto the 20-day SMA at 164.00, suggesting that the bulls remain resilient. Essentially, if the pair continues to stay above the SMA's, it could extend its upward trajectory, enhancing its technical stance in the forthcoming sessions.
- The Euro remains contained above 1.0600 support yet with bullish attempts capped below 1.0690
- The broader bias remains unchanged, with the pair on a bearish trend from early March highs near 1.1000.
- The diverging ECB - Fed monetary policy outlook is expected to keep the pair under pressure.
Euro bears have been contained at 1.0605 support area this week, but the pair remained trading sideways, with upside attempts capped below 1.0690. The pair is on track to close the week little changed, following a 1.8% sell-off in the previous week.
A somewhat softer US Dollar has given the common currency some oxygen on Friday, although the broader bearish trend remains unchanged. The diverging monetary policy outlook between the ECB and the Fed is expected to weigh on the pair.
This week’s data has endorsed the view of a ‘no landing” in the US economy, which is strengthening the case for the Fed’s Hawkish sector. Earlier on Friday, Chicago Fed President Austen Goolsbee reiterated that the progress on inflation has stalled and that it will take longer than expected to achieve the 2% target. The Dollar has reacted with a moderate appreciation.
On the contrary, ECB’s President Lagarde suggested that interest rate cuts will likely come in June. This puts the European Central Bank in the unusual situation of acting ahead of the Fed, which is expected to keep the Euro under pressure.
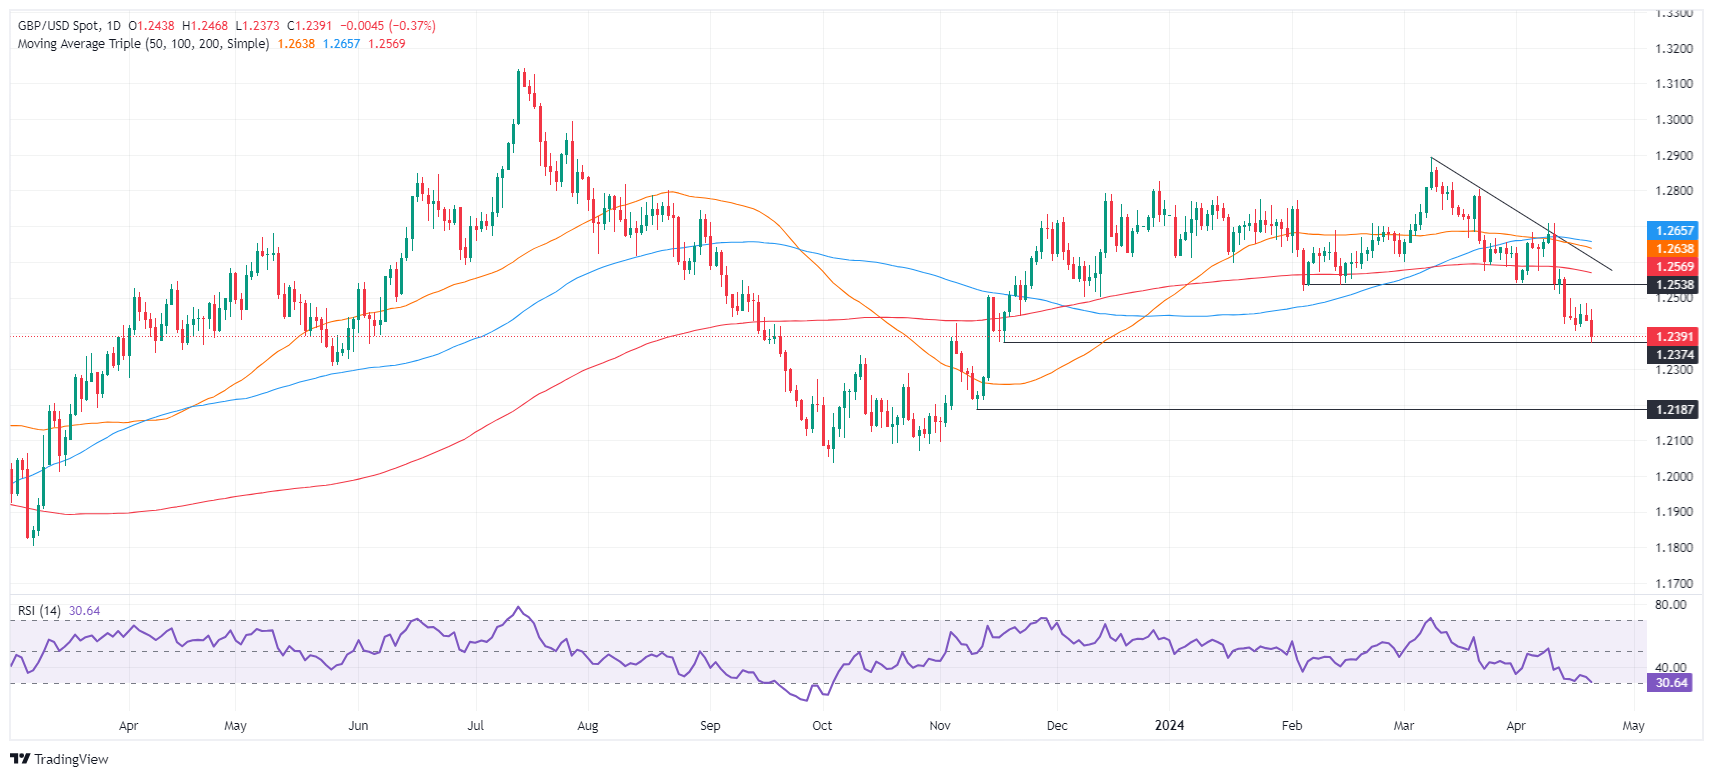
- GBP/USD falls 0.48% to 1.2376, influenced by rising geopolitical risks and statements from major central banks.
- Bank of England's Deputy Governor comments on inflation risks fail to support Sterling as it hits new lows.
- Mixed economic data from the UK with stagnant retail sales in March, contrasting with modest annual growth.
The Pound Sterling tumbles against the US Dollar during the mid-North American session after a volatile trading day due to an escalation of the Israel-Iran conflict. Major central bank speakers led by the Bank of England (BoE) and the Federal Reserve (Fed), continued to set the tone for the financial markets. The GBP/USD trades at 1.2376, down 0.48%.
GBP/USD slides as Israel-Iran conflict escalates
According to Reuters, there were explosions over an Iranian city on Friday, in what sources described as an Israel attack. However, Iranian authorities downtoned the event and stated they had no plans for retaliation. As a consequence, the GBP/USD tumbled toward 1.2388, a new five-month low, before recovering some ground.
Words from the BoE’s Deputy Governor Dave Ramsden failed to underpin Cable, which refreshed five-month lows at 1.2372. Ramsden said he would consider the implications of Forex for inflation, adding that the bank would do what makes sense in terms of the BoE’s mandate. He added the disinflation process would be bumpy, but risks are tilted to the downside.
In addition, Chicago’s Fed President Austan Goolsbee adopted a neutral stance, slightly boosting the Greenback. He commented that progress on inflation has stalled, suggesting that a pause would allow incoming data to provide insight into the disinflation process.
British Retail Sales showed signs of stagnation during the European session in March compared to February’s reading. Analysts were expecting sales to grow 0.3% MoM, which came at 0%, while core sales tumbled from 0.3% to -0.3%. On an annual basis, the Office for National Statistics (ONS) revealed that sales rose by 0.8%, which is up from a drop of -0.3% in February.
GBP/USD Price Analysis: Technical outlook
After breaching below 1.2400, the GBP/USD could resume its ongoing downtrend. Unless buyers regain the 1.2400 mark, sellers are in charge. The first support would be the November 17 low of 1.2373, followed by the November 10 low of 1.2187. On the other hand, if buyers reclaim 1.24000, the next key resistance area would be the April 18 high at 1.2484, ahead of 1.2500.
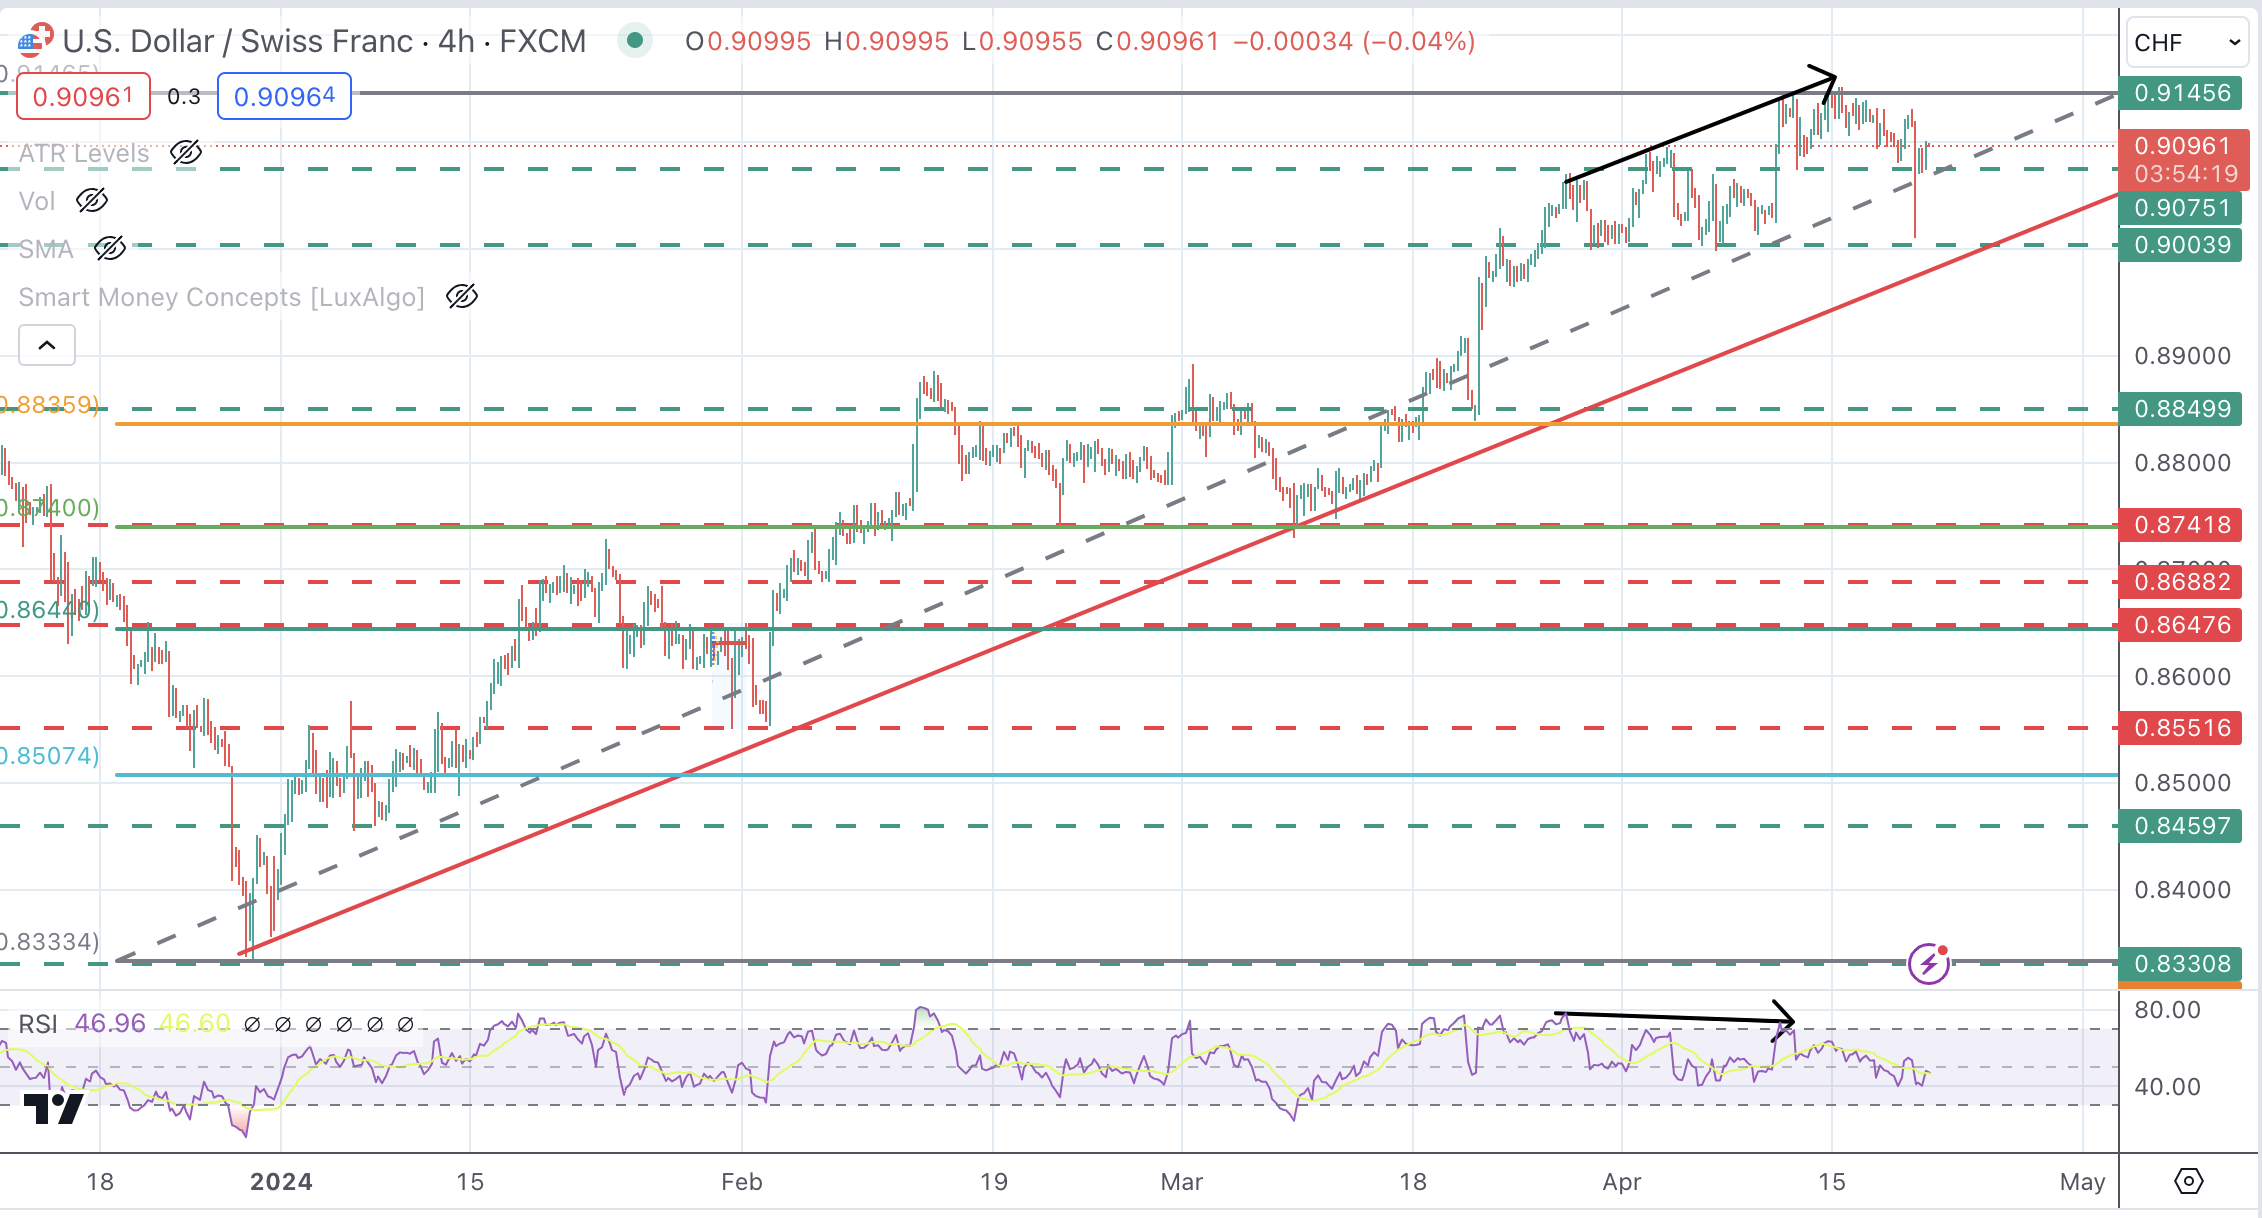
- The US Dollar pares previous losses and returns to levels right below 0.9100
- A doji candle in the weekly chart and the bearish divergence on intra-day charts suggest the possibility of a deeper correction.
- USD/CHF bears need to breach 0.9075 support level.
The US Dollar has retraced previous losses, as news of an Israeli attack on Iran boosted the safe-haven CHF, to consolidate at previous ranges, above the 0.9075 resistance area.
On Friday, Chicago Fed President Austen Goolsbee has reiterated the the lack of progress on inflation and reaffirmed the data-dependant approach on further monetary policy decisions. The Dollar has traded moderately higher following these comments
Fundamentals are Dollar-supportive, as the Federal Reserve is likely to keep rates at high levels for a longer time, while the SNB has cut rates already and is likely to cut them again later this year.
USD/CHF Technical Analysis
The pair, however, has been trading without a clear direction below the 0.9145 resistance area following a strong rally from early January. The weekly chart is set to print a Doji candle, which often indicates that a potential correction might be ahead.
A bearish divergence on the 4-hour chart is also pointing to that direction, although bears need to confirm below 0.9075 to confirm a trend shift. Below there, the next targets would be the 0.9000 area and the trendline support at 0.8980. On the upside, a bullish reaction beyond 0.9245 would expose October’s high, at 0.9240.
USD/CHF 4-Hour Chart
- DXY Index demonstrates slight losses yet sustains near early November highs.
- The downward movements may be seen as buyers running out of momentum.
- Hawkish bets on the Fed and a sour market mood may limit the losses.
The US Dollar Index (DXY) is currently trading at 106.09, a mild loss from its recent peak of 106.35. Despite this, the index remains geared toward testing its November 1 high of 107.10. However, the outlook for the Greenback remains positive as Middle East tensions and hawkish bets on the Federal Reserve (Fed) may drive demand back to the USD.
The US economy exhibits robust growth with persistent inflation, which made the Fed change its messaging to a more hawkish one, triggering a rally of US Treasury yields and hence benefiting the US Dollar.
Daily digest market movers: DXY slightly corrects, while outlook remains positive
- Higher Middle East tensions cultivate risk-off sentiment, affecting global markets.
- Fundamentals and hawkish Federal Reserve (Fed) rhetoric ensure the US Dollar's uptrend continues.
- For the next Fed meeting, signs show some officials considering rate hikes, a major departure from the previous intentions of rate cuts. This could significantly impact markets if market pricing realigns itself to this new direction.
- In the US Treasury bond market, the 2-year, 5-year, and 10-year bond yields are all falling. Specifically, the 2-year yield trades at 4.97%, the 5-year at 4.65%, and the 10-year at 4.60%, but all remain near multi-month highs.
- The first rate cut is now expected to hurdle past the May, June, and July meetings to appear in September.
DXY technical analysis: DXY showing bearish momentum, but bulls are still in the game
On the daily chart, The Relative Strength Index (RSI) operates in positive territory but exhibits a negative slope, implying that a move down is possible and reflects bearish momentum. Concurrently, the Moving Average Convergence Divergence (MACD) underscores this sentiment as the decreasing green bars suggest an imminent bearish crossover, highlighting ongoing selling momentum.
However, despite short-term downward pressures, the bulls have not yet thrown in the towel. This is substantiated by the DXY's position above the 20, 100, and 200-day Simple Moving Averages (SMAs), which indicates that bulls still have control over the overall trend.
US Dollar FAQs
The US Dollar (USD) is the official currency of the United States of America, and the ‘de facto’ currency of a significant number of other countries where it is found in circulation alongside local notes. It is the most heavily traded currency in the world, accounting for over 88% of all global foreign exchange turnover, or an average of $6.6 trillion in transactions per day, according to data from 2022. Following the second world war, the USD took over from the British Pound as the world’s reserve currency. For most of its history, the US Dollar was backed by Gold, until the Bretton Woods Agreement in 1971 when the Gold Standard went away.
The most important single factor impacting on the value of the US Dollar is monetary policy, which is shaped by the Federal Reserve (Fed). The Fed has two mandates: to achieve price stability (control inflation) and foster full employment. Its primary tool to achieve these two goals is by adjusting interest rates. When prices are rising too quickly and inflation is above the Fed’s 2% target, the Fed will raise rates, which helps the USD value. When inflation falls below 2% or the Unemployment Rate is too high, the Fed may lower interest rates, which weighs on the Greenback.
In extreme situations, the Federal Reserve can also print more Dollars and enact quantitative easing (QE). QE is the process by which the Fed substantially increases the flow of credit in a stuck financial system. It is a non-standard policy measure used when credit has dried up because banks will not lend to each other (out of the fear of counterparty default). It is a last resort when simply lowering interest rates is unlikely to achieve the necessary result. It was the Fed’s weapon of choice to combat the credit crunch that occurred during the Great Financial Crisis in 2008. It involves the Fed printing more Dollars and using them to buy US government bonds predominantly from financial institutions. QE usually leads to a weaker US Dollar.
Quantitative tightening (QT) is the reverse process whereby the Federal Reserve stops buying bonds from financial institutions and does not reinvest the principal from the bonds it holds maturing in new purchases. It is usually positive for the US Dollar.
Another week dominated by bets regarding the most-likely timing of the Fed's start of the easing cycle saw the US Dollar rise to new highs, while conviction of an interest rate cut by the ECB in June remained on the rise… and dragged EUR/USD to as low as the 1.0600 neighbourhood.
It was a choppy week for the Greenback despite reaching new higher around 106.50 when measured by the USD Index (DXY). The Chicago Fed National Activity Index is due on April 22, seconded by flash PMIs and New Home Sales on April 23. In addition, Durable Goods Orders are expected on April 24, while the GDP Growth Rate, Initial Jobless Claims and Pending Home Sales are all due on April 25. The release of inflation tracked by the PCE, Personal Income, Personal Spending and the final Michigan Consumer Sentiment will close the week on April 26.
EUR/USD managed to regain some balance after bottoming out in five-month lows around 1.0600. The European Commission will publish its preliminary Consumer Confidence gauge on April 22, while advanced PMIs in the euro bloc are due on April 23 followed by Germany's IFO Business Climate on April 24. Still in Germany, Consumer Confidence measured by GfK is expected on April 25.
In quite an erratic week, GBP/USD dropped to yearly lows in the sub-1.2400 region just to regain some composure afterwards. In the UK, Public Sector Net Borrowing and flash PMIs are due on April 23 ahead of Gfk's Consumer Confidence on April 26.
USD/JPY extended its consolidative theme north of 154.00 amidst persistent market chatter around FX intervention. The Japanese calendar will see Foreign Bond Investment figures and the final Coincident Index and Leading Economic Index on April 25 prior to the BoJ interest rate decision and Quarterly Outlook Report on April 26.
Further losses saw AUD/USD clinch its second week in a row in the negative territory, breaking below the 0.6300 support for the first time since mid-November. Data-wise, In Australia, the flash Judo Bank PMIs are due on April 23 seconded by the Inflation Rate on April 24.
Anticipating Economic Perspectives: Voices on the Horizon
- BoE's Haskel and Pill along with ECB's Nagel, speak on April 23.
- ECB's Nagel speaks on April 24 and 25.
- SNB's Jordan speaks on April 26.
Central Banks: Upcoming Meetings to Shape Monetary Policies
- The Bank Indonesia (BI) is expected to hold rates at 6.0% on April 24.
- The BoJ is seen keeping its rate unchanged on April 26.
- Dow Jones gains while NASDAQ, S&P 500 slide.
- Geopolitical concerns have eased, but investors remain wary of risk.
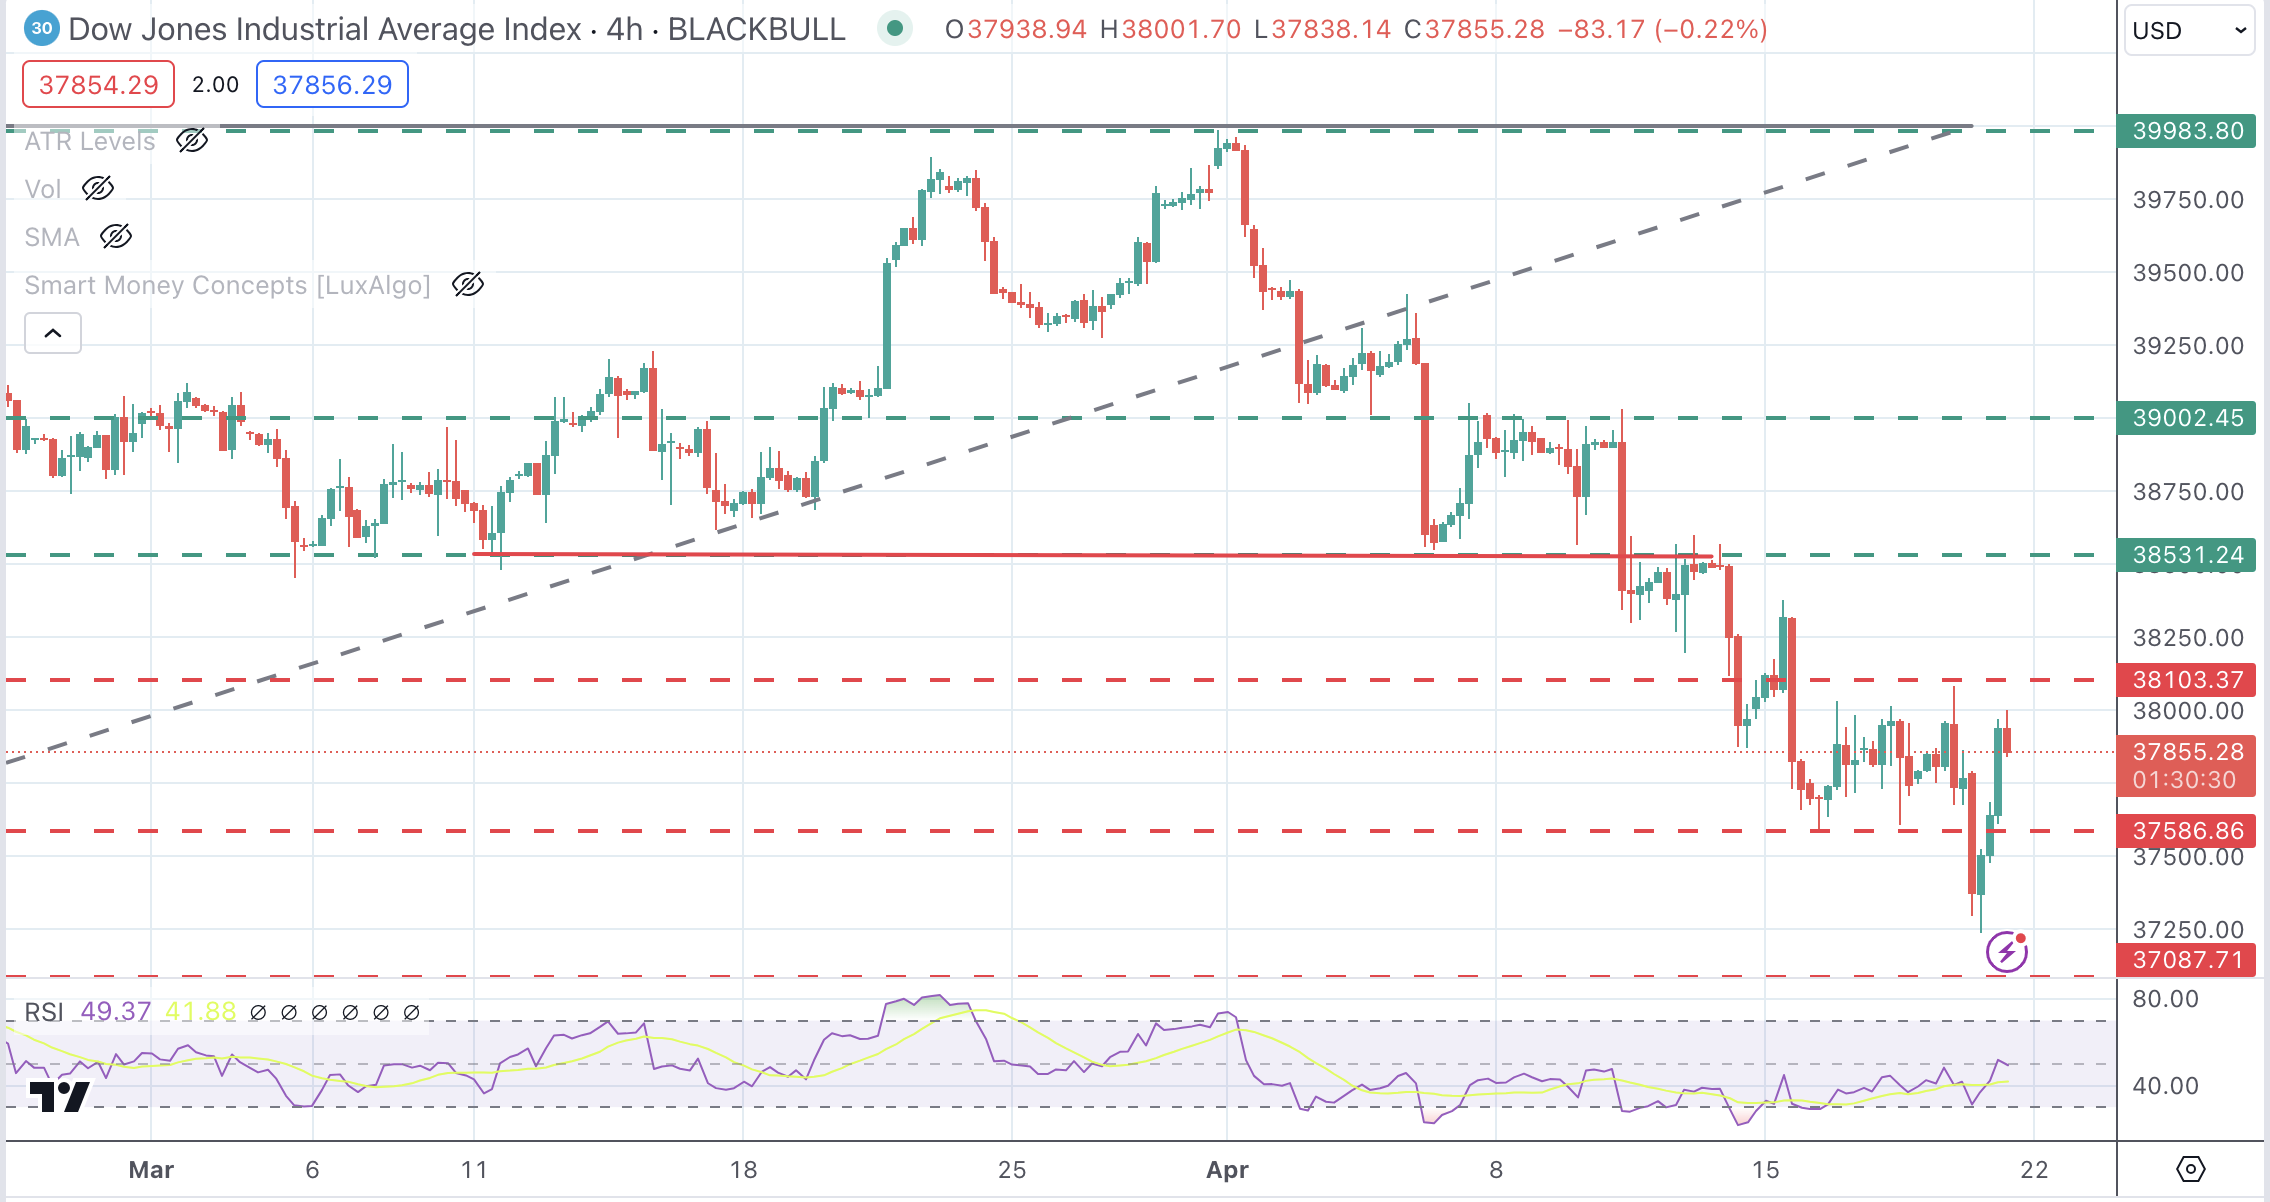
- Dow Jones trend needs to break resistances at 38,105 and 38,531 to cancel the bearish bias.
The Dow Jones Industrial Average (DJIA) is trading moderately higher on Friday with Wall Street indexes mixed on looming geopolitical concerns.
News from an Israeli attack on Iran has boosted risk aversion although the Islamic Republic has downplayed the incident and showed no intention to retaliate.
The US economic calendar is light today. Chicago Federal Reserve President Austan Goolsbee reiterated the lack of progress on inflation but showed confidence that core inflation will return to the 2% level. US yields are pulling back, but uninspiring earnings reports have left markets in no man’s land.
The Dow Jones is outperforming with a 0.4% advance to 37,941, while the S&P 500 drops 0.3 % to 4,994 and the NASDAQ dives 1% to 15,439.
Dow Jones news
A majority of the Wall Street sectors are posting gains with Energy stocks leading gains thanks to a 1.2% advance, followed by Utilities, up 1.2%. On the negative side, Communication Services drops 1.6%, and Technology is down 1.4%.
American Express (UNH) rose 3.1% to $493.51 and is the best performer for the second day in a row, fuelled by the strong quarterly earnings results. Next is United Health Group (UNH) with a 2.1% gain to $503.76. On the losing end, Amazon (AMZN) drops 2.1% to $175.47, and Intel (INTC) loses 1.6% to $34.45.
Dow Jones technical outlook
The DJIA is trimming some losses on Friday, although the broader bearish trend from March highs near 40,000 remains intact. The resistance area at 38,103 should be breached to ease downside pressure and clear the path toward 38,530.
On the downside, the support level at 37,087 is the 38.2% Fibonacci retracement of the November-March rally and a previous support area. This might be a tough nut to crack for sellers. Below here, the target is 36,545.
Dow Jones Index 4-Hour Chart
Nasdaq FAQs
The Nasdaq is a stock exchange based in the US that started out life as an electronic stock quotation machine. At first, the Nasdaq only provided quotations for over-the-counter (OTC) stocks but later it became an exchange too. By 1991, the Nasdaq had grown to account for 46% of the entire US securities’ market. In 1998, it became the first stock exchange in the US to provide online trading. The Nasdaq also produces several indices, the most comprehensive of which is the Nasdaq Composite representing all 2,500-plus stocks on the Nasdaq, and the Nasdaq 100.
The Nasdaq 100 is a large-cap index made up of 100 non-financial companies from the Nasdaq stock exchange. Although it only includes a fraction of the thousands of stocks in the Nasdaq, it accounts for over 90% of the movement. The influence of each company on the index is market-cap weighted. The Nasdaq 100 includes companies with a significant focus on technology although it also encompasses companies from other industries and from outside the US. The average annual return of the Nasdaq 100 has been 17.23% since 1986.
There are a number of ways to trade the Nasdaq 100. Most retail brokers and spread betting platforms offer bets using Contracts for Difference (CFD). For longer-term investors, Exchange-Traded Funds (ETFs) trade like shares that mimic the movement of the index without the investor needing to buy all 100 constituent companies. An example ETF is the Invesco QQQ Trust (QQQ). Nasdaq 100 futures contracts allow traders to speculate on the future direction of the index. Options provide the right, but not the obligation, to buy or sell the Nasdaq 100 at a specific price (strike price) in the future.
Many different factors drive the Nasdaq 100 but mainly it is the aggregate performance of the component companies revealed in their quarterly and annual company earnings reports. US and global macroeconomic data also contributes as it impacts on investor sentiment, which if positive drives gains. The level of interest rates, set by the Federal Reserve (Fed), also influences the Nasdaq 100 as it affects the cost of credit, on which many corporations are heavily reliant. As such the level of inflation can be a major driver too as well as other metrics which impact on the decisions of the Fed.
- Mexican Peso dips to six-month low, reacting sharply to the geopolitical conflict between Israel and Iran.
- Retail Sales in Mexico show improvement, offering some support and reducing losses in USD/MXN from earlier peaks.
- Banxico Deputy Governor Galia Borja comments on the ongoing challenge to reach inflation targets.
The Mexican Peso remains on the defensive after plummeting close to 5% against the US Dollar during the overnight session for North American traders. Newswires that Israel attacked Iran in retaliation for the April 13 attack triggered a massive flight to safe-haven assets, a headwind for the Mexican currency. However, economic data from Mexico lent a lifeline to the Peso, which fell to a six-month low. The USD/MXN trades at 17.23, up by close to 1%.
According to Reuters, Israel attacked Iran in response to the April 13 drone attacks. There were reports of explosions in the Iranian city of Isfahan, which houses a military base. However, Iran is now downplaying the level of damage, and it appears there might not be a military response.
In Mexico, the National Statistics Agency (INEGI) revealed that US Retail Sales improved in February compared to January. That triggered a recovery, sending the USD/MXN lower from 17.37 to 17.19. Elsewhere, Bank of Mexico (Banxico) Deputy Governor Galia Borja said, “There was much left to be done” to bring inflation down and move toward Banxico’s 3.0% target.
Across the border, the economic docket in the United States (US) featured a speech by Chicago Federal Reserve President Austan Goolsbee, who shifted more neutral following his previous dovish stance.
Daily digest market movers: Mexican Peso treads water despite being boosted by Retail Sales
- Mexico’s Retail Sales rose by 0.4% MoM in February compared to January, up 3.0% in the twelve months to the same period. This performance improved over the previous month when sales decreased by -0.6% MoM and -0.8% YoY.
- A preliminary report by INEGI revealed that, based on preliminary estimates, Mexico’s economy likely grew 2.1% YoY in March.
- On Wednesday, Bank of Mexico (Banxico) Deputy Governor Jonathan Heath commented that caution is important before normalizing monetary policy amid stubbornly sticky inflation. He added, “Maintaining a restrictive monetary policy is key for some time.”
- The International Monetary Fund (IMF) revised its economic growth forecasts for Mexico, lowering the 2024 growth expectation from 2.7% to 2.4% and the 2025 forecast from 1.5% to 1.4%. The IMF attributed the reduction in the 2025 forecast to anticipated fiscal tightening by the new administration, which is expected to reverse the fiscal expansion that is driving growth this year. This reversal will involve scaling back current spending policies.
- Chicago Fed President Goolsbee said that it makes sense to wait and get more clarity before easing policy, adding that the current restrictive monetary policy is appropriate.
- On Thursday, Atlanta Fed President Raphael Bostic stated the central bank would likely not reduce rates in 2024. Echoing his comments was the New York Fed's John Williams, commenting that current monetary policy is in a good place, indicating no rush to cut rates.
- Data from the Chicago Board of Trade (CBOT) suggests that traders expect the Fed funds rate to finish 2024 at 4.995%, down from 5% a day ago.
Technical analysis: Mexican Peso plummets as USD/MXN buyers reclaim 200-day SMA
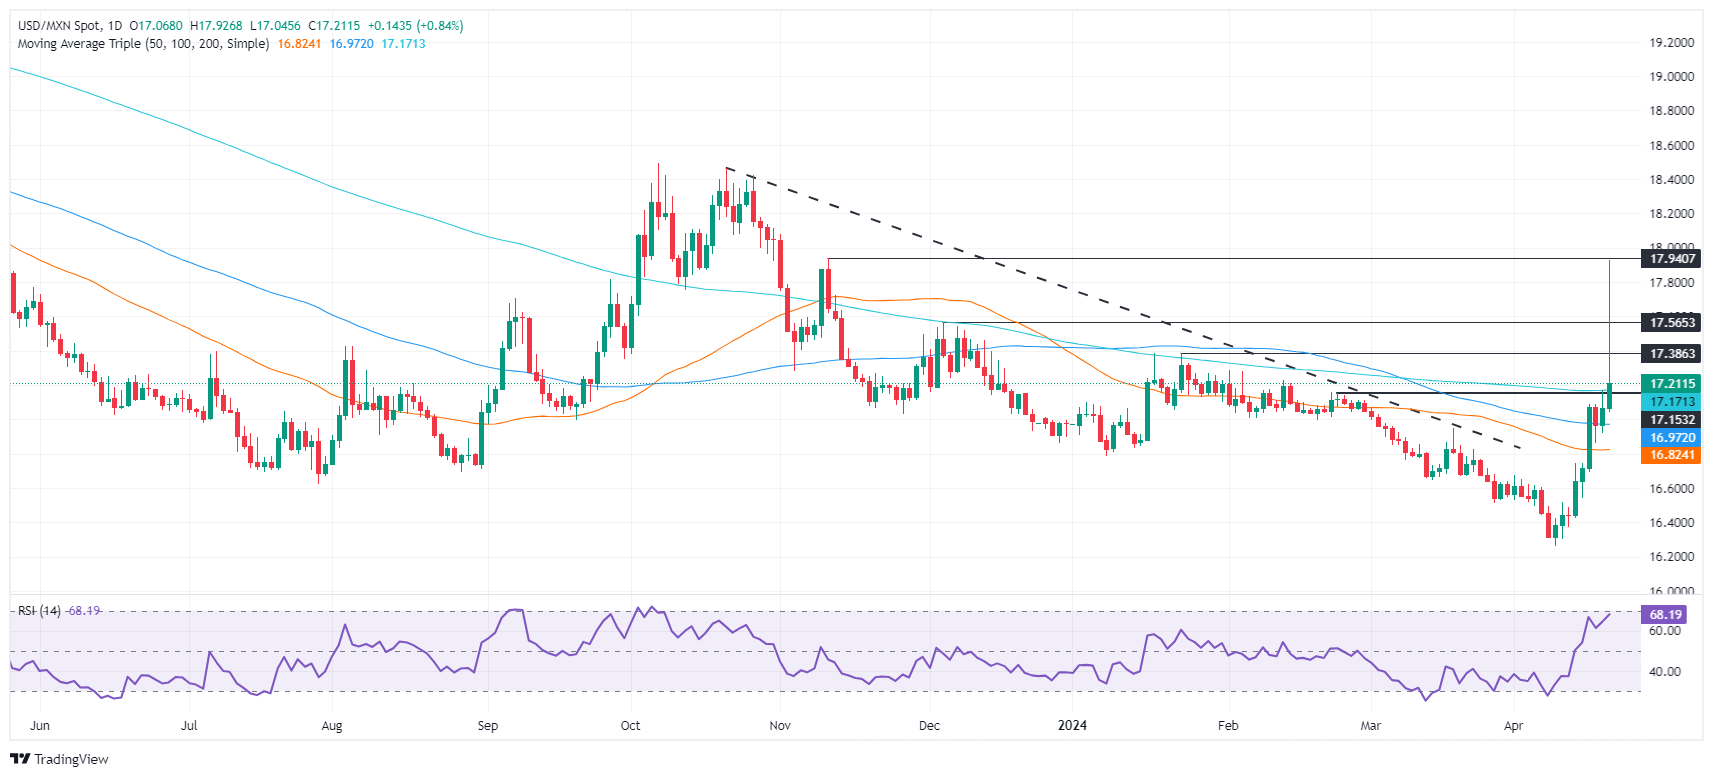
Following the overnight developments, the USD/MXN has shifted to a bullish bias, breaching the 200-day Simple Moving Average (SMA) at 17.16, a key support and resistance level. Traders use this level as a dynamic resistance/support level that depicts an asset's overall trend.
However, USD/MXN buyers are not yet out of the woods. They must achieve a daily close above the January 23 high at 17.38, which would expose the 17.550 figure. Further upside is seen at 17.56, the December 5, 2023 swing high, ahead of the 18.00 mark.
On the other hand, if USD/MXN slides below the 200-day SMA, look for a retracement to the 100-day SMA at 17.08. If it is surpassed, sellers could drag the exchange rate toward the 17.00 figure.
Mexican Peso FAQs
The Mexican Peso (MXN) is the most traded currency among its Latin American peers. Its value is broadly determined by the performance of the Mexican economy, the country’s central bank’s policy, the amount of foreign investment in the country and even the levels of remittances sent by Mexicans who live abroad, particularly in the United States. Geopolitical trends can also move MXN: for example, the process of nearshoring – or the decision by some firms to relocate manufacturing capacity and supply chains closer to their home countries – is also seen as a catalyst for the Mexican currency as the country is considered a key manufacturing hub in the American continent. Another catalyst for MXN is Oil prices as Mexico is a key exporter of the commodity.
The main objective of Mexico’s central bank, also known as Banxico, is to maintain inflation at low and stable levels (at or close to its target of 3%, the midpoint in a tolerance band of between 2% and 4%). To this end, the bank sets an appropriate level of interest rates. When inflation is too high, Banxico will attempt to tame it by raising interest rates, making it more expensive for households and businesses to borrow money, thus cooling demand and the overall economy. Higher interest rates are generally positive for the Mexican Peso (MXN) as they lead to higher yields, making the country a more attractive place for investors. On the contrary, lower interest rates tend to weaken MXN.
Macroeconomic data releases are key to assess the state of the economy and can have an impact on the Mexican Peso (MXN) valuation. A strong Mexican economy, based on high economic growth, low unemployment and high confidence is good for MXN. Not only does it attract more foreign investment but it may encourage the Bank of Mexico (Banxico) to increase interest rates, particularly if this strength comes together with elevated inflation. However, if economic data is weak, MXN is likely to depreciate.
As an emerging-market currency, the Mexican Peso (MXN) tends to strive during risk-on periods, or when investors perceive that broader market risks are low and thus are eager to engage with investments that carry a higher risk. Conversely, MXN tends to weaken at times of market turbulence or economic uncertainty as investors tend to sell higher-risk assets and flee to the more-stable safe havens.
- Canadian Dollar extends recovery in calm Friday trading session.
- Iran has downplayed the alleged drone attack from Israel, which has eased risk aversion.
- USD/CAD is testing the neckline of a bearish S&H pattern at 1.3725.
The Canadian Dollar (CAD) is trading higher for the third consecutive session on Friday and is on track for a moderate weekly recovery after a sharp sell-off over the previous two weeks. A softer US Dollar in the absence of key macroeconomic data and easing fears about the Middle East conflict are contributing to the Loonie’s recovery.
Investors seem to have come to terms with the idea that the Federal Reserve (Fed) will delay and scale down its monetary easing plans, which is allowing some take-profit for the US Dollar. Chicago Fed President Austen Goolsbee has reiterated the lack of progress on inflation, but the impact on the US Dollar has been marginal.
Furthermore, the Iranian authorities have played down rumours about a drone attack by Israel. With no further threat to an escalation of the conflict, the immediate risk aversion has gradually eased, which is good for the CAD.
Daily digest market movers: USD/CAD extends recovery as risk aversion eases
- Canadian Dollar appreciates further, favoured by a light US macroeconomic calendar and easing geopolitical concerns.
- Iranian government has downplayed the alleged attack from Israel and showed no intentions for retaliation, which has calmed markets.
- On Friday, Chicago Fed President Austen Goolsbee commented on the lack of progress on US inflation but remained confident in reaching the 2% core target in a reasonable time frame.
- This week, US data has added evidence of sustained economic growth with a tight labor market. This backs the idea that the US central bank will have to keep rates at a restrictive level for a longer time.
- Data from Canada reflects a softening inflationary trend, which highlights the diverging monetary policy outlook between the BoC and the Fed.
- Bets for a Fed rate cut in July have dropped to 38% from around 50% at the beginning of the week, with investors pricing in 40 bps of cuts in 2024, down from 150 bps in January.
Canadian Dollar price today
The table below shows the percentage change of Canadian Dollar (CAD) against listed major currencies today. Canadian Dollar was the weakest against the Swiss Franc.
| USD | EUR | GBP | CAD | AUD | JPY | NZD | CHF | |
| USD | -0.14% | 0.24% | -0.18% | 0.01% | -0.03% | 0.13% | -0.41% | |
| EUR | 0.14% | 0.39% | -0.05% | 0.15% | 0.11% | 0.28% | -0.25% | |
| GBP | -0.25% | -0.40% | -0.45% | -0.24% | -0.28% | -0.11% | -0.65% | |
| CAD | 0.18% | 0.06% | 0.44% | 0.21% | 0.16% | 0.33% | -0.19% | |
| AUD | -0.01% | -0.15% | 0.24% | -0.21% | -0.04% | 0.13% | -0.40% | |
| JPY | 0.02% | -0.10% | 0.25% | -0.18% | 0.04% | 0.17% | -0.35% | |
| NZD | -0.13% | -0.28% | 0.11% | -0.33% | -0.13% | -0.18% | -0.53% | |
| CHF | 0.39% | 0.25% | 0.64% | 0.19% | 0.40% | 0.35% | 0.53% |
The heat map shows percentage changes of major currencies against each other. The base currency is picked from the left column, while the quote currency is picked from the top row. For example, if you pick the Euro from the left column and move along the horizontal line to the Japanese Yen, the percentage change displayed in the box will represent EUR (base)/JPY (quote).
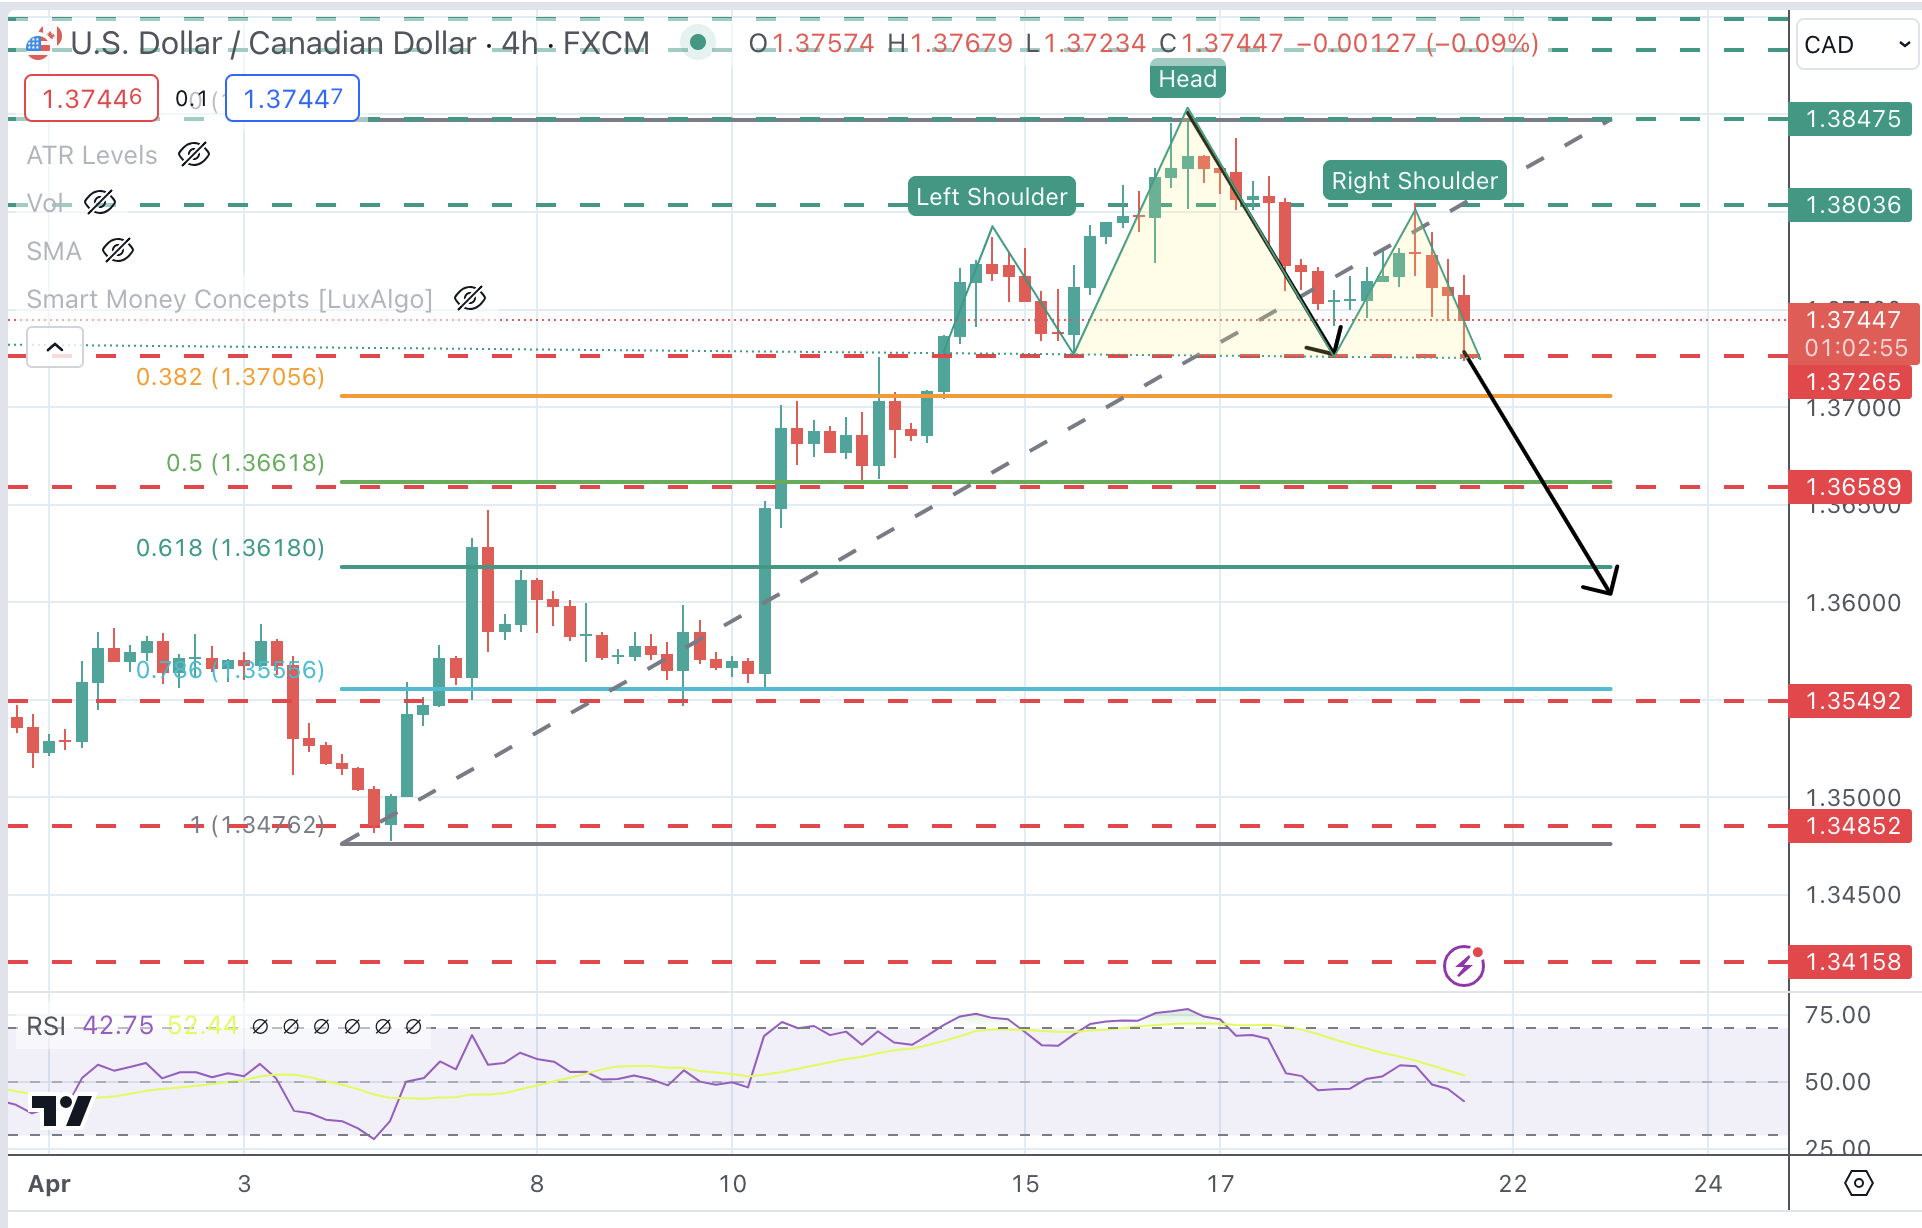
Technical analysis: USD/CAD forms bearish Head & Shoulders pattern with key support at 1.3725
The broader US Dollar trend remains positive, but the reversal from the 1.3800 area earlier on Monday suggests a Head & Shoulders pattern is in progress. This is a common figure to signal a trend shift and comes after a near 3% USD rally in April.
Immediate support is at 1.3725, which is the neckline of the H&S pattern. Below here, the next support levels are 1.3665 and the target of the figure, coincident with the 50% Fibonacci retracement of the April rally at 1.3620. On the upside, above 1.3800 the focus would shift back to the 1.3850 high.
USD/CAD 4-Hour Chart
Canadian Dollar FAQs
The key factors driving the Canadian Dollar (CAD) are the level of interest rates set by the Bank of Canada (BoC), the price of Oil, Canada’s largest export, the health of its economy, inflation and the Trade Balance, which is the difference between the value of Canada’s exports versus its imports. Other factors include market sentiment – whether investors are taking on more risky assets (risk-on) or seeking safe-havens (risk-off) – with risk-on being CAD-positive. As its largest trading partner, the health of the US economy is also a key factor influencing the Canadian Dollar.
The Bank of Canada (BoC) has a significant influence on the Canadian Dollar by setting the level of interest rates that banks can lend to one another. This influences the level of interest rates for everyone. The main goal of the BoC is to maintain inflation at 1-3% by adjusting interest rates up or down. Relatively higher interest rates tend to be positive for the CAD. The Bank of Canada can also use quantitative easing and tightening to influence credit conditions, with the former CAD-negative and the latter CAD-positive.
The price of Oil is a key factor impacting the value of the Canadian Dollar. Petroleum is Canada’s biggest export, so Oil price tends to have an immediate impact on the CAD value. Generally, if Oil price rises CAD also goes up, as aggregate demand for the currency increases. The opposite is the case if the price of Oil falls. Higher Oil prices also tend to result in a greater likelihood of a positive Trade Balance, which is also supportive of the CAD.
While inflation had always traditionally been thought of as a negative factor for a currency since it lowers the value of money, the opposite has actually been the case in modern times with the relaxation of cross-border capital controls. Higher inflation tends to lead central banks to put up interest rates which attracts more capital inflows from global investors seeking a lucrative place to keep their money. This increases demand for the local currency, which in Canada’s case is the Canadian Dollar.
Macroeconomic data releases gauge the health of the economy and can have an impact on the Canadian Dollar. Indicators such as GDP, Manufacturing and Services PMIs, employment, and consumer sentiment surveys can all influence the direction of the CAD. A strong economy is good for the Canadian Dollar. Not only does it attract more foreign investment but it may encourage the Bank of Canada to put up interest rates, leading to a stronger currency. If economic data is weak, however, the CAD is likely to fall.
Federal Reserve Bank of Chicago President Austan Goolsbee argued on Friday that it would make sense to wait to get more clarity on the inflation outlook before taking a policy step.
Key takeaways
"Progress on US inflation has stalled."
"Fed's current restrictive monetary policy is appropriate."
"Proper Fed policy going forward will depend on the data."
"Still hopeful for return to improvement on inflation in months ahead."
"Persistently high housing inflation is main short-run problem."
"There is more space for progress on services inflation from labor supply increases."
"Need to determine if strong GDP, jobs numbers are a sign of overheating that is driving up inflation."
"Not all data suggest labor-market overheating."
Market reaction
The US Dollar Index stays in negative territory near 106.00 following these comments.
"I have become more confident in the evidence that risks to persistence in domestic inflation pressures are receding," Bank of England Deputy Governor Dave Ramsden on Friday, per Reuters.
"There are likely to be bumps in the disinflation process from one month to the next," Ramsden added and said that the balance of domestic risks to the outlook for the UK inflation is now tilted to the downside.
Market reaction
These comments failed to trigger a noticeable market reaction. At the time of press, GBP/USD was up 0.1% on the day at 1.2450.
- AUD/USD clings to gains above 0.6400 as market sentiment improves.
- The appeal for risky assets improved after reports from Iran indicated that the attack in Isfahan was exaggerated.
- Weak Australian Employment data positively influence speculation for early RBA rate cuts.
The AUD/USD pair holds gains above the round-level support of 0.6400 in Friday’s early New York session. The Aussie asset recovers as fears of further escalation in Middle East tensions ease after Iran reported that the drone attack did not harm nuclear facilities in Isfahan. Also, the attack from Israel, which has not been confirmed by them but by US officials appeared to be limited in size. Meanwhile, Iran said that they have no plans for an immediate retaliation.
Market sentiment turns upbeat as the appeal for risky assets improves. The S&P 500 witnesses buying interest at open and recovers losses posted in the European session. 10-year US Treasury yields fall to 4.62% even though Federal Reserve (Fed) policymakers have been endorsing higher interest rates for a longer period.
Fed policymakers have been arguing that they are comfortable with higher interest rates because labor demand is robust and wages are rising. They have warned that the progress in inflation declining to the 2% target is lower than expected.
The US Dollar Index (DXY) whipsaws around 106.00 as the appeal for risk-perceived assets improves. The near-term outlook of the US Dollar is still strong due to upbeat United States economic prospects.
Meanwhile, weak Australian Employment data for March has strengthened speculation for early rate cuts by the Reserve Bank of Australia (RBA). According to the Australian Bureau of Statistics, employers fired 6.6K workers against expectations of fresh 7.2K hiring. In February, 117.6K job-seekers were hired, which was slightly revised higher from 116.5K. The Unemployment Rate rose to 3.8% from 3.7% but remained below the estimates of 3.9%.
- USD/JPY whipsaws lower and then higher on alternating risk-on risk-off caused by Middle East tensions.
- Governor Ueda talks about defending the Yen from further weakness and currency-induced imported inflation.
- USD/JPY price chart shows bearish Hanging Man forming, boding ill for future price action.
USD/JPY is trading in the 154.50s on Friday after declining to a low for the day in the 153.00s on the back of a spike in safe-haven demand that disproportionately favored the Japanese Yen (JPY).
An escalation in Middle East tensions, triggered a flight to safety overnight after news of bomb explosions in Iran. The attacks were thought to be orchestrated by Israel in retaliation for the drone armada sent by Iran on April 13.
Although the US Dollar benefited from the flight to safety, JPY gained more from the shift in sentiment, pushing down USD/JPY which expresses the number of Japanese Yen purchasable with one US Dollar.
The pair subsequently recovered as tensions eased, however, and a senior Iranian official reportedly stated Iran has no immediate plans to retaliate, according to Reuters.
Inflation ticks lower but Ueda adopts hawkish tone
On the data front, the Japanese National Consumer Price Index (CPI) for March increased by 2.7% year-over-year, compared to a 2.8% rise in February, according to the Japan Statistics Bureau.
Despite the decline in inflation observed in the data, however, the Governor of the Bank of Japan (BoJ) Kazuo Ueda issued hawkish rhetoric supporting the Japanese Yen. Ueda said the central bank might consider raising interest rates again if significant declines in the Yen caused currency-related inflation, according to Reuters.
Technical Analysis: USD/JPY looks to post bearish Hanging Man pattern
USD/JPY looks like it may be positing a bearish Hanging Man candlestick pattern on Friday (circled) assuming the close does not differ markedly from the current market price.
If the Hanging Man completes and is followed by a bearish candlestick on Monday it will confirm a short-term bearish reversal pattern and indicate lower prices are likely to follow.
USD/JPY Daily Chart
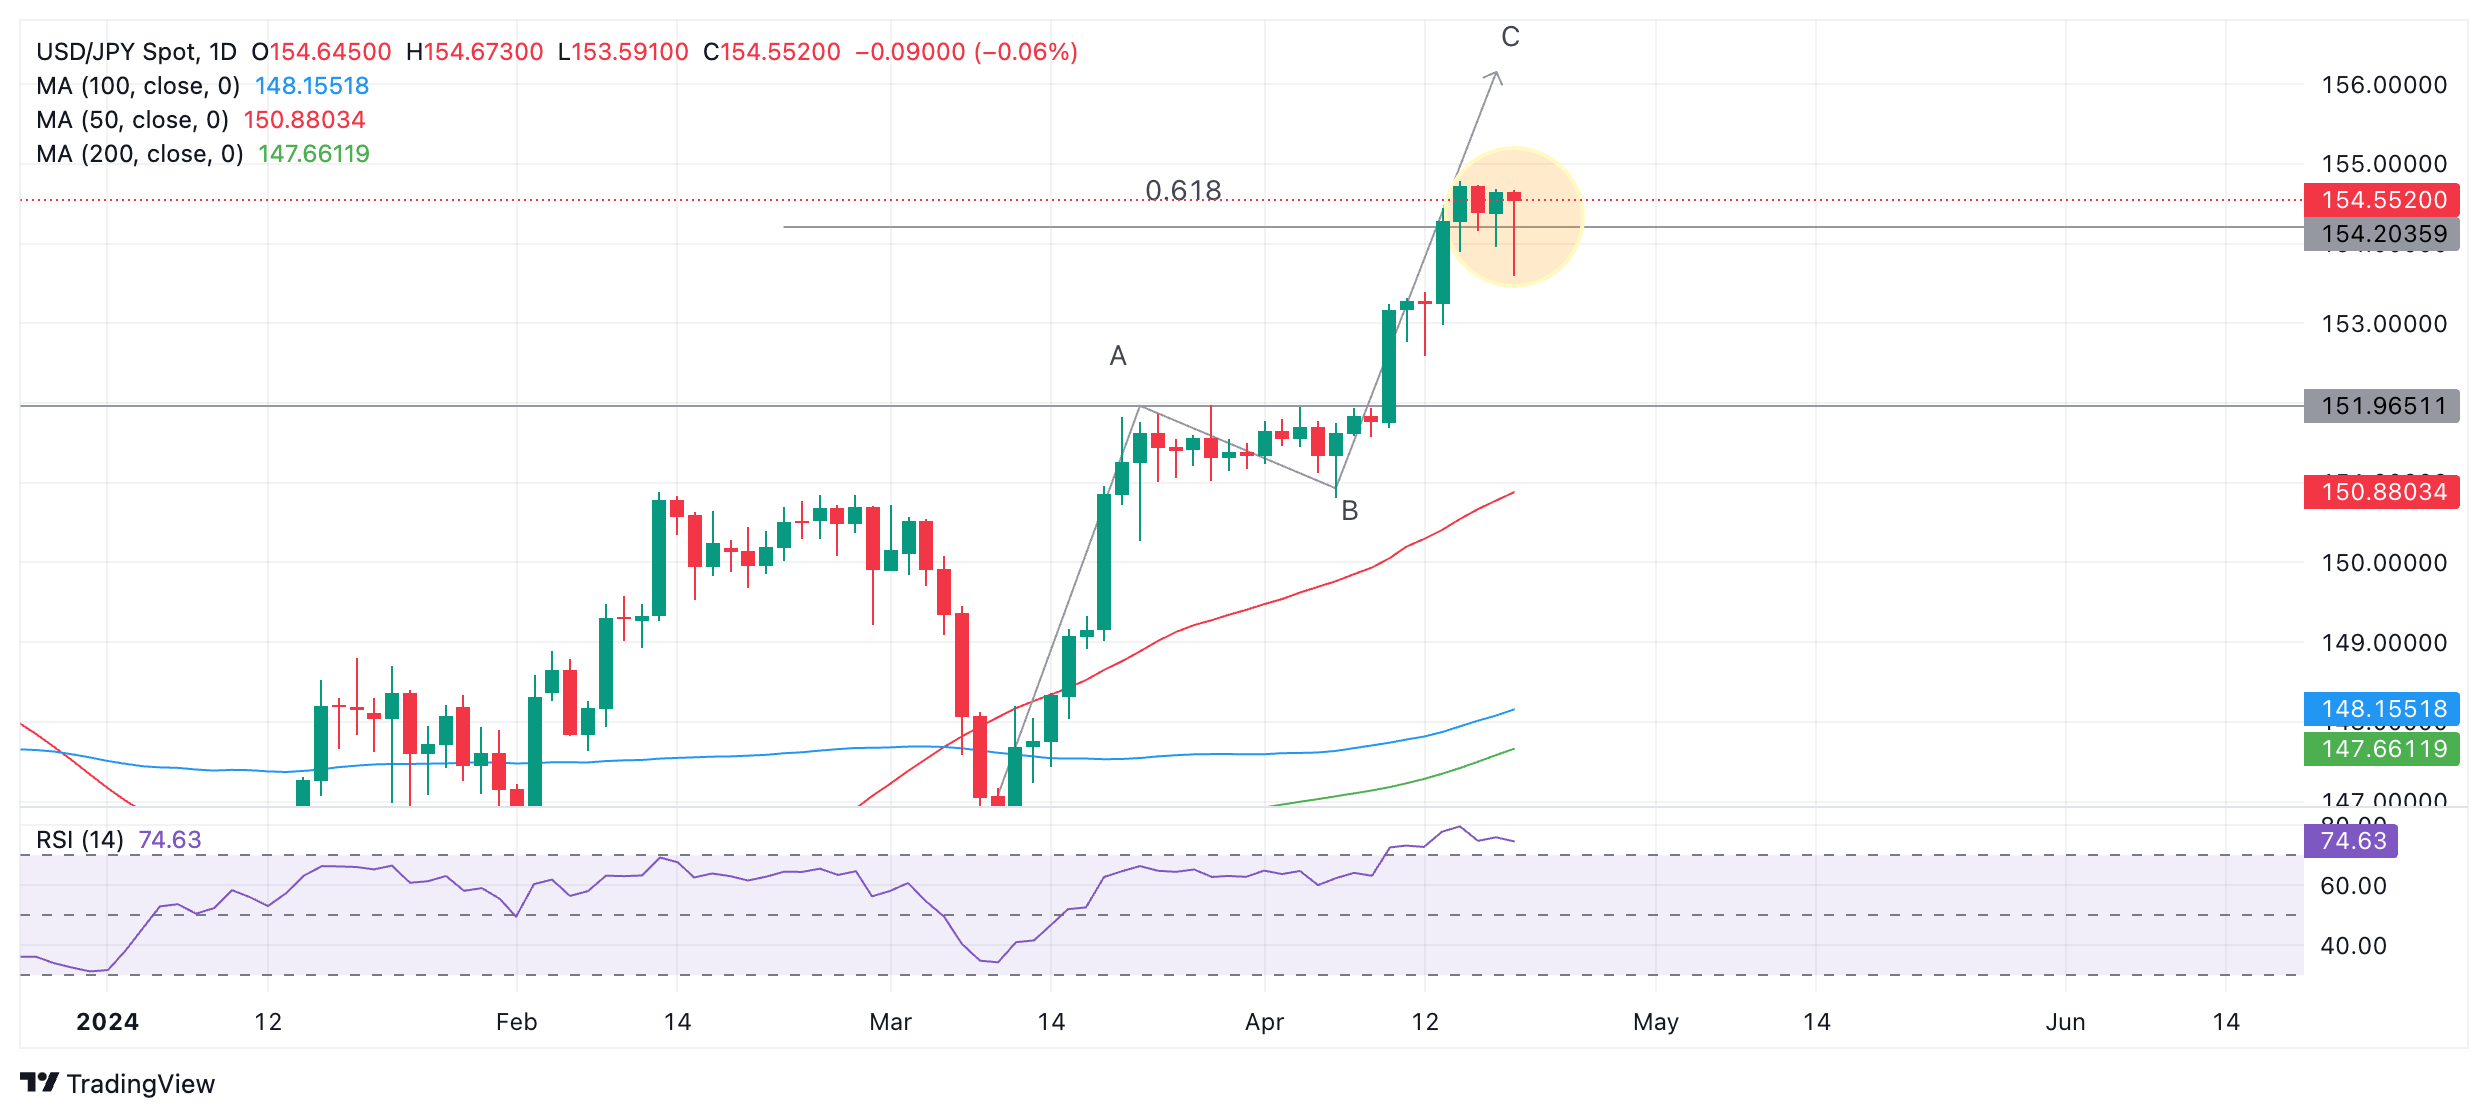
A Measured Move price pattern, composed of three waves, commonly labeled A, B and C has been unfolding since the start of March.
The general rule with these patterns is that the end of wave C can be estimated as occurring where wave C is equal in length to wave A, or a Fibonacci ratio of wave A. At the very least C normally extends to a 0.618 ratio of A.
USD/JPY has already reached the conservative estimate for the end of wave C at the Fib. 0.618 extension of A, at 154.20. This means there is a possibility C may have reached its limit and the Measured Move could be complete.
Once the Measured Move completes it is usually followed by a reversal, which in this case means a decline.
If the end of C equals A, however, it still has higher to go and could reach roughly 156.11.
The Relative Strength Index (RSI) is in overbought territory, suggesting the risk of a pullback is on the horizon. The advice is for bullish traders with a medium-term outlook to not add to their positions. If RSI exits overbought it may be a sign USD/JPY is pulling back.
A break above the 154.78 high could indicate a continuation of the uptrend to the next target at the more 156.11 optimistic end of wave C.
Alternatively, further weakness could lead to a correction back to support at the top of wave A, at 151.96.
European Central Bank (ECB) President Christine Lagarde reiterated on Friday that it would be appropriate to reduce the current level of monetary policy restriction if the inflation criteria are met, per Reuters.
Lagarde added that the ECB's Governing Council is not pre-committed to a particular rate path and noted that risks to the inflation outlook are two-sided.
Market reaction
These comments failed to trigger a noticeable reaction in EUR/USD. At the time of press, the pair was up 0.15% on the day at 1.0660.
- NZD/USD bounces back from 0.5860 as the US Dollar edges down.
- Investors see the RBNZ beginning to reduce interest rates from November.
- The Kiwi asset trades inside the Descending Triangle pattern, suggesting indecisiveness among investors.
The NZD/USD pair turns sideways slightly below 0.5900 in Friday’s European session after recovering sharply from the crucial support of 0.5860.
The Kiwi asset rebounds as the appeal for risk-perceived currencies strengthens after economists cautioned about persistent global inflation. This has increased speculation that central banks other than the Federal Reserve (Fed) will also delay their rate-cut plans to avoid inflation getting rebound again. Initially, only the Fed was expected to begin reducing interest rates later this year due to stubbornly higher price pressures and robust labor demand.
Investors see the Reserve Bank of New Zealand (RBNZ) pivoting to rate cuts from November after NZ Q1 inflation data grew in line with estimates. Price pressures rose by 0.6% as estimated, higher than the prior reading of 0.5%.
The US Dollar Index (DXY) falls slightly to 106.10. The near-term outlook remains strong as the Federal Reserve (Fed) sees interest rates remaining higher for long enough so that inflation could sustainably return to the desired rate of 2%. Currently, traders see the Fed starting to reduce interest rates from the September meeting.
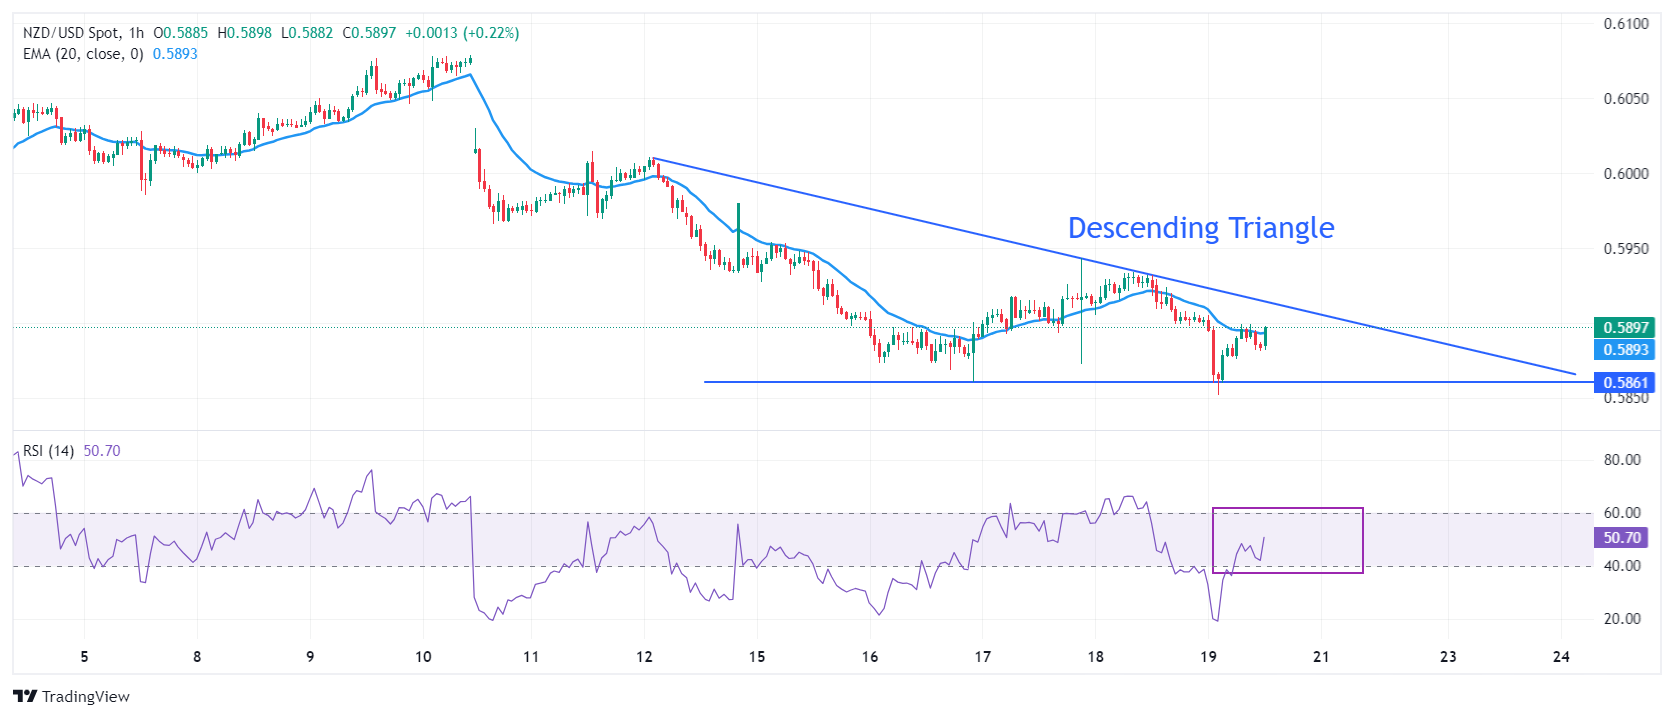
NZD/USD oscillates in a Descending Triangle chart pattern, which exhibits a sharp volatility contraction. The downward-sloping border of the above-mentioned chart pattern is plotted from April 12 high near 0.6000 while the horizontal support is placed from April 16 low at 0.5860.
The Kiwi asset attempts to break above the 20-period Exponential Moving Average (EMA), which trades around 0.5900.
The 14-period Relative Strength Index (RSI) recovers sharply above 40.00. However, the downside bias remains favored until the RSI breaks above 60.00.
Fresh downside would appear if the asset breaks below April 16 low at 0.5860. This would drag the asset toward 8 September 2023 low at 0.5847, followed by the round-level support of 0.5900
On the flip side, a recovery move above March 18 high at 0.6100 will drive the pair toward March 12 low at 0.6135. A breach of the latter will drive the asset further to February 9 high around 0.6160.
NZD/USD hourly chart
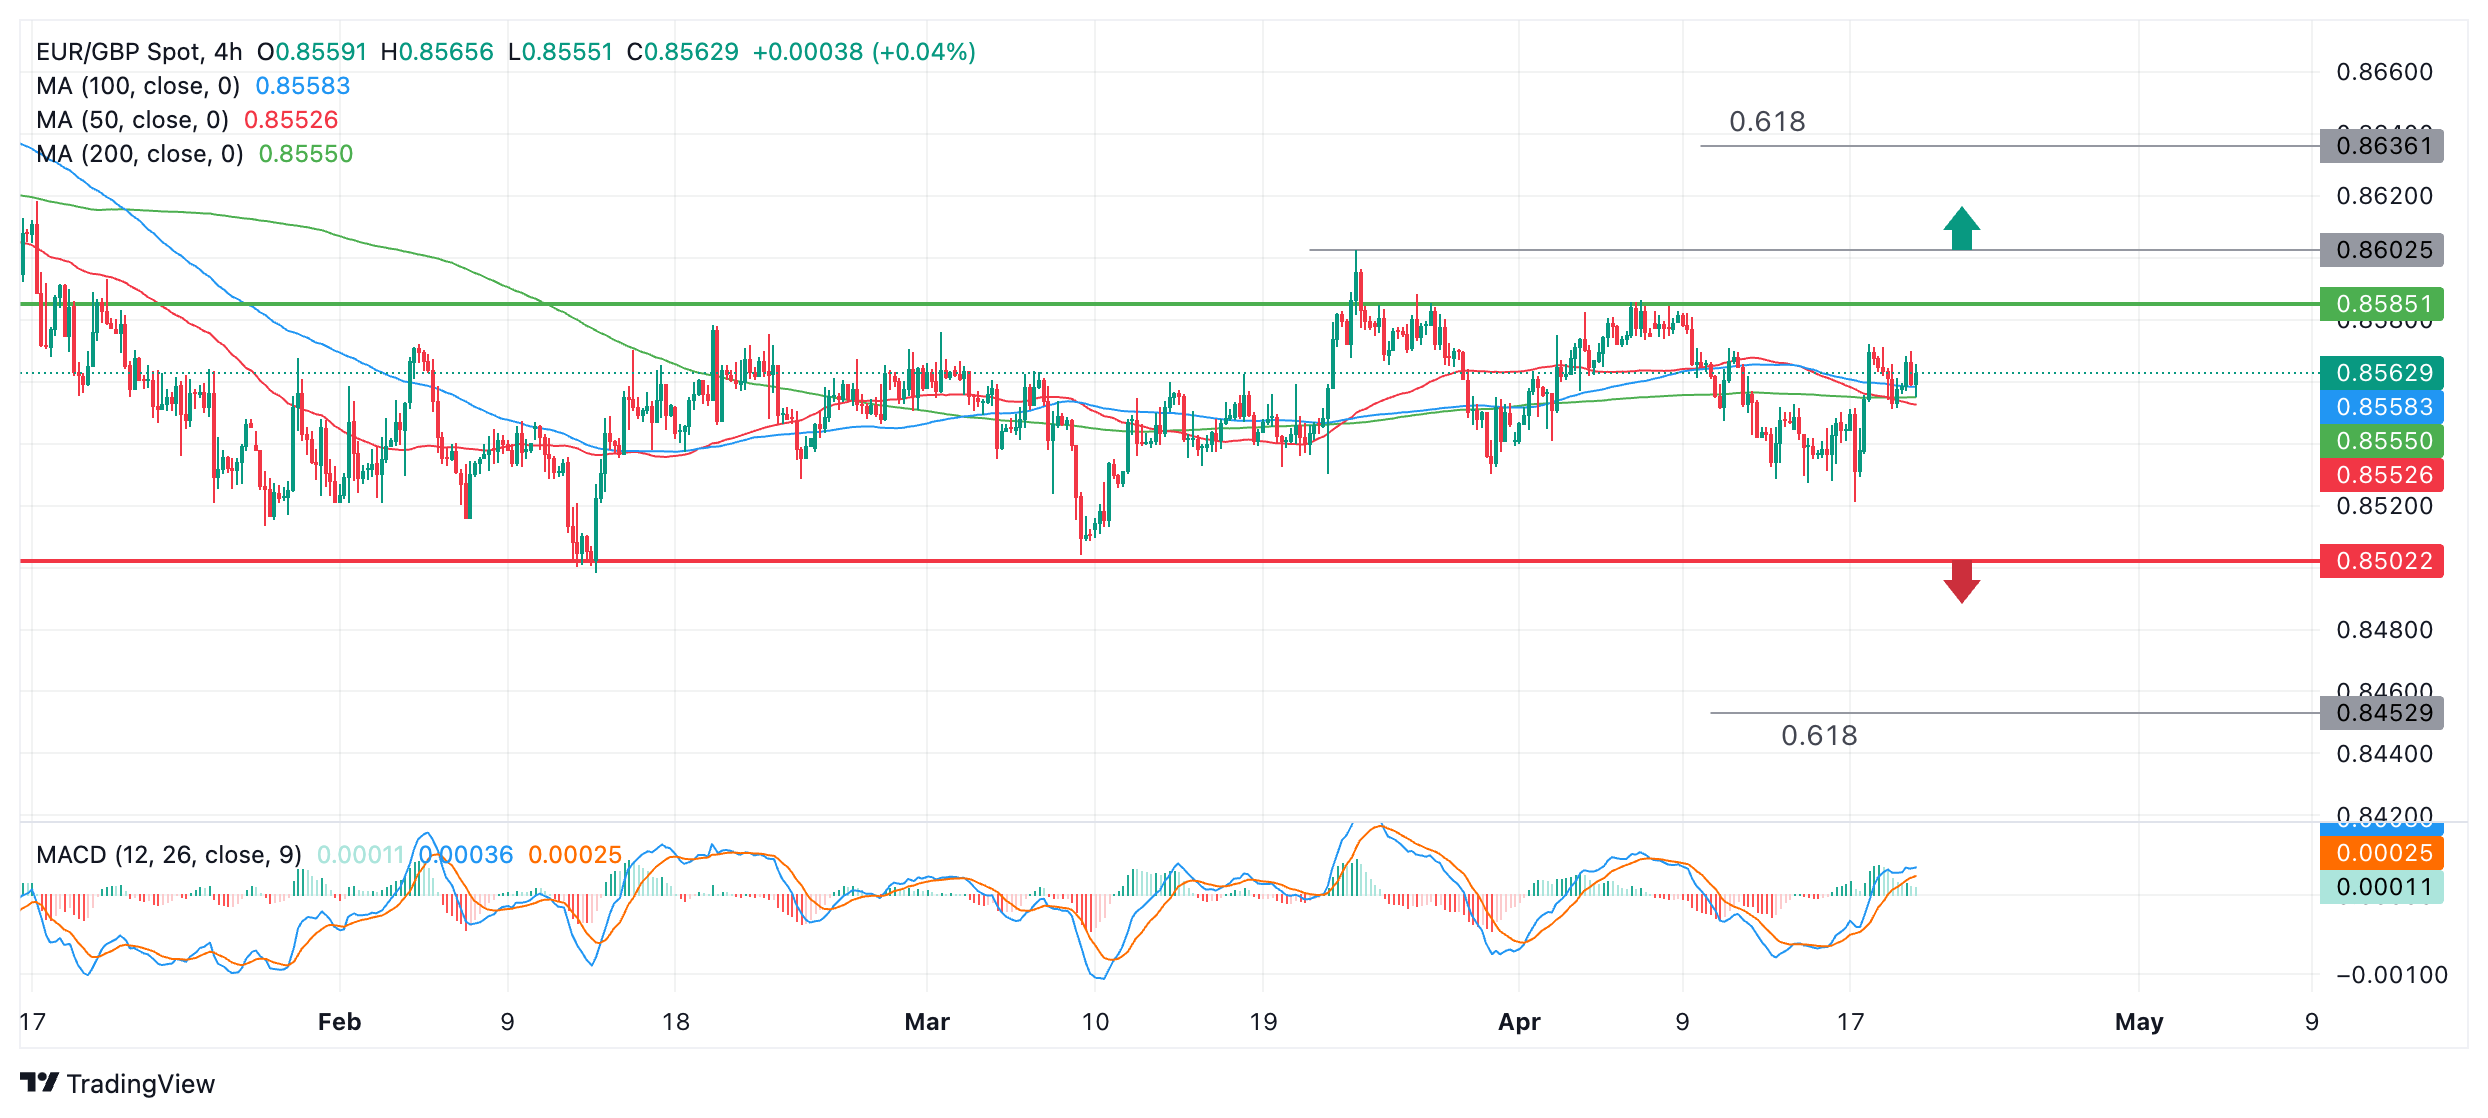
- EUR/GBP is in a sideways trend that has lasted for three months.
- This trend is expected to extend, but at what point would a breakout from the range be assessed as occurring?
- How far would such breakouts be expected to travel?
EUR/GBP price is in a sideways trend which has unfolded over three months. In technical analysis the received wisdom is that the existing trend is expected to continue until the weight of evidence points to a reversal. Since there is no evidence EUR/GBP has changed trend the conclusion must be that it will continue trading sideways.
However, it is a useful exercise to estimate at what levels the sideways trend will have been assessed as ending and a new bullish or bearish trend said to have begun.
EUR/GBP 4-hour Chart
One method to achieve this is to establish the levels of the ceiling and floor of the range. If price breaks above or below these levels it will probably indicate the trend has changed. An upside breakout will probably indicate a new bull trend is starting and vice versa for a downside breakout.
Although the range formed by EUR/GBP’s does not appear to have exact high and low boundaries, it is possible to make a rough estimate of where the ceiling and the floor lie.
The floor is easier to estimate since there have been two swing lows that have bottomed at the same level, 0.8502. This is illustrated by the horizontal red line on the chart above.
The range ceiling is less clearly defined. The very highest peak in the sideways market was achieved on March 22 at 0.8602 (circled).
Another level that could be a ceiling is at 0.8585 where price has topped on two separate occasions (green horizontal line) and even 0.8571 where price has touched multiple times (green dotted line).
Which of the three should be chosen is a matter of choice. It is a tenet of technical analysis, however, that a level gains importance the more times it is tested, and so the hypothetical ceiling should at least have been touched more than once.
This rules out the March 22 high, which was only reached once. The next level at 0.8585 offers a good compromise as it has been touched twice and lies between the 0.8602 peak of the range and the 0.8571 multiple-touch level. It is this midpoint level which has been chosen for this analysis.
When price breaks out of a range it usually travels a distance that can be roughly worked out based on the height of the range. The conservative target for how far a breakout will travel is to take the 0.681 Fibonacci ratio of the height of the range and extrapolate it from the boundary higher or lower.
Based on this forecasting method, a breakout above the ceiling of the range at 0.8585 would be expected to travel to a target at 0.8636. A breakout from the bottom of the range, meanwhile, would be forecast to travel to a target at 0.8453.
These moves would constitute considerable deviations from the central tendency of the range and probably, therefore, also indicate a change in the short-term trend – from sideways to bullish for a break higher, and sideways to bearish for a break lower. As such they provide key evidence for assessing whether the trend may have changed.
A break above the March 22 peak would provide added confirmation of an upside break as there is always a risk price could retest the level and then fall back down into the range.
To avoid false breakout signals, only decisive breaks above or below the range high or low should be counted as indicating a valid breakout. A decisive break would be one characterized by a longer-than-average daily candlestick that pierces the floor or ceiling and closes near its low or high respectively, or three candlesticks in a row that pierce above or below the level.
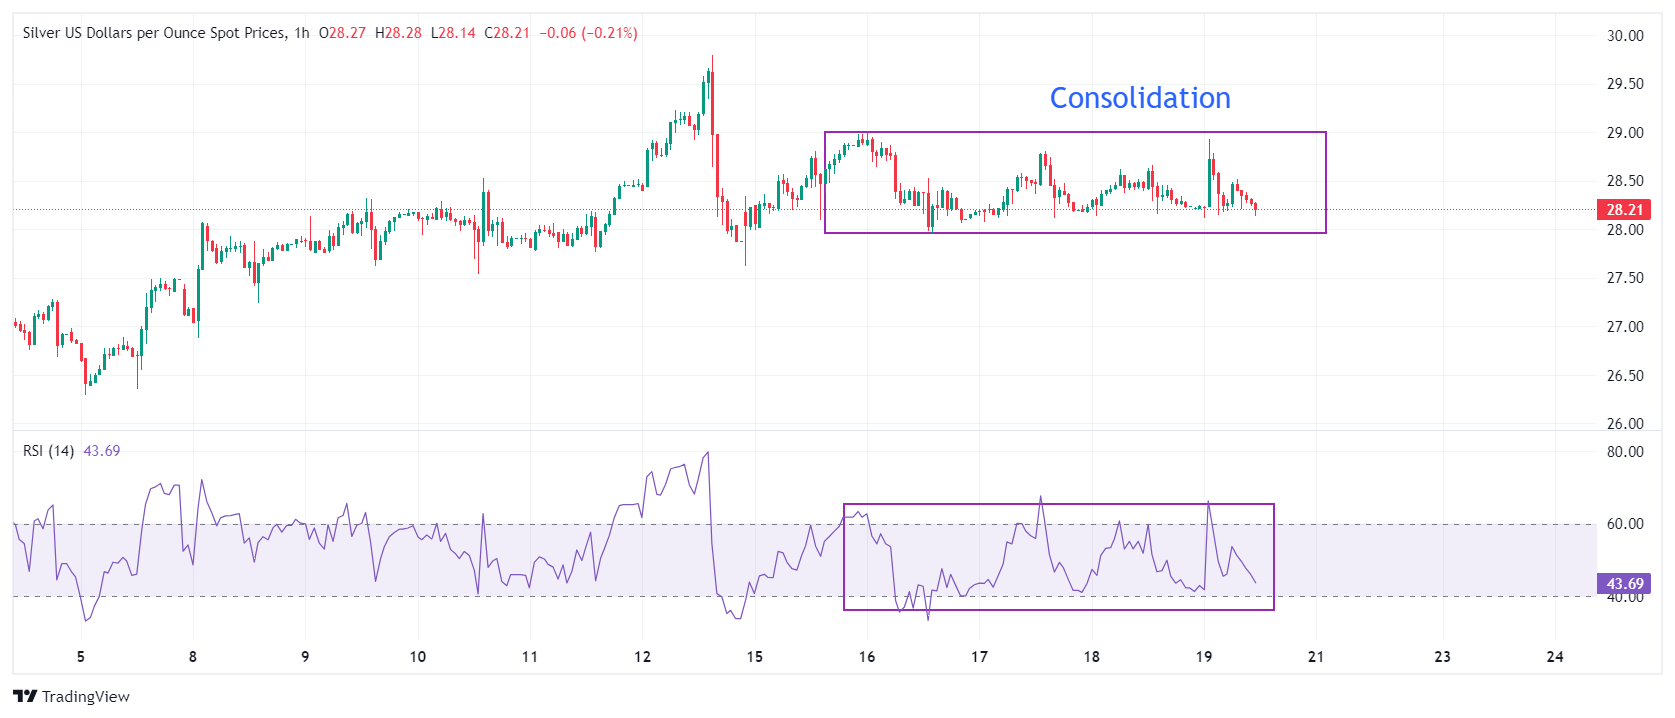
- Silver price retreats from day’s high amid no signs of retaliation from Iran after limited airstrike from Israel.
- Fed’s hawkish guidance fails to prompt US bond yields.
- Fed Williams is comfortable with more rate hikes if inflation remains persistent.
Silver price (XAG/USD) falls back while attempting to recapture crucial resistance of $29.00 in Friday’s European session. The white metal surrenders early gains, prompted by reports from the Middle East that Iran’s air defence destroyed three drones by the Israeli army. Israel has not yet confirmed that they made those attacks in retaliation to an airstrike by Iran on their state.
The near-term outlook for Silver remains firm as worsening geopolitical tensions will keep the safe-haven demand intact. Meanwhile, global markets exhibit an asset-specific action as risk-perceived currencies have recovered losses reported in early Asia, while global equites remain under pressure. S&P 500 futures have posted significant losses in the European session.
Yields on interest-bearing assets from the United States economy have plummeted despite the Federal Reserve (Fed) lean towards keeping interest rates higher for a longer period. 10-year US Treasury yields fall to 4.59%. A decline in bond yields diminish the opportunity cost of investment in bullions.
On Thursday, New York Fed President John Williams said he doesn't see urgency for rate cuts and warned that the central bank is ready to hike again if data suggests persistent price pressures.
The US Dollar Index (DXY) holds the 106.00 ground as Fed policymakers support keeping interest rates higher due to stubbornly high inflation, which has been fed by tight labor market conditions.
Silver technical analysis
Silver price remains in a tight range between $28 and $29 from last four trading sessions on an hourly timeframe. This demonstrates a sharp volatility contraction, which could explode in either direction. The 14-period Relative Strength Index (RSI) oscillates inside the 40.00-60.00 range, indicating indecisiveness among market participants.
Silver hourly chart
- Gold price trades close to $2,400 amid worsening geopolitical tensions.
- The US Dollar’s upside stalls as investors see other central banks postponing rate cut plans.
- US bond yields are down despite the Fed maintaining a hawkish stance.
Gold price (XAU/USD) faces pressure to recapture new all-time highs around $2,430 in Friday’s European session. The precious metal still holds some intraday gains, supported by safe-haven flows after worsening Middle East tensions. On Friday, Israel launched a retaliatory attack against Iran targeting the area around the city of Isfahan, Reuters reports. Iran has largely downplayed the attack by saying that their air defence has destroyed three drones. Signs of no further retaliation from Iran and what appears to be a limited airstrike have eased initial fears in markets, prompting Gold to pare gains.
The hawkish interest-rate outlook from Federal Reserve (Fed) policymakers also keeps Gold’s upside limited. Fed policymakers maintain the argument that borrowing costs need to remain higher for a longer period as progress in inflation declining to the 2% target has slowed significantly. Still, this recent hawkish Fed commentary hasn’t translated into a pickup in US Treasury bond yields, with 10-year US Treasury yields falling to 4.58% in Friday’s London session.
The US Dollar Index (DXY), which tracks the US Dollar’s value against six major currencies, edges down to 106.10 as traders reassess expectations for rate cuts from other central banks like the Bank of England (BoE) and the Reserve Bank of New Zealand (RBNZ). While initially it seemed that many central banks would cut rates before the Fed, investors are increasingly pricing in delays as well in other countries amid fears that price pressure could increase again.
Daily digest market movers: Gold price whipsaws after Israel’s attack against Iran
- Gold price surrenders the majority of intraday gains posted after the Israeli military responded to Iran’s attack, Reuters reports. A New York Times report quoted Iranian officials saying that the strike had hit a military air base near the city of Isfahan. However, the Israeli state has not confirmed the drone attack.
- The confirmation of the airstrike by Israel would deepen fears of Iran retaliating again, which would widen the war scope beyond Gaza. Investing in Gold becomes more appealing when geopolitical tensions escalate.
- Meanwhile, deepening uncertainty about when the Federal Reserve (Fed) will start reducing interest rates keeps limiting the upside in Gold. The CME FedWatch tool shows traders are pricing in the September meeting as the moment when the central bank could pivot to rate cuts. However, Fed policymakers refrain from providing a concrete time frame as inflation remains stubborn due to robust consumer spending and tight labor market conditions.
- On Thursday, Atlanta Fed President Raphael Bostic said the progress in inflation declining towards the 2% target will be slower than expected and conditions for rate cuts won’t be favorable for the central bank towards the end of the year. Bostic added he is comfortable being patient and not “in a mad dash hurry” for rate cuts because labor demand is robust and wage growth remains resilient.
- Separately, New York Fed President John Williams also delivered a hawkish interest rate guidance. Williams said he doesn't see the urgency for rate cuts and warned that the central bank is ready to hike again if the data suggests price pressures accelerate.
Technical Analysis: Gold price faces pressure above $2,400
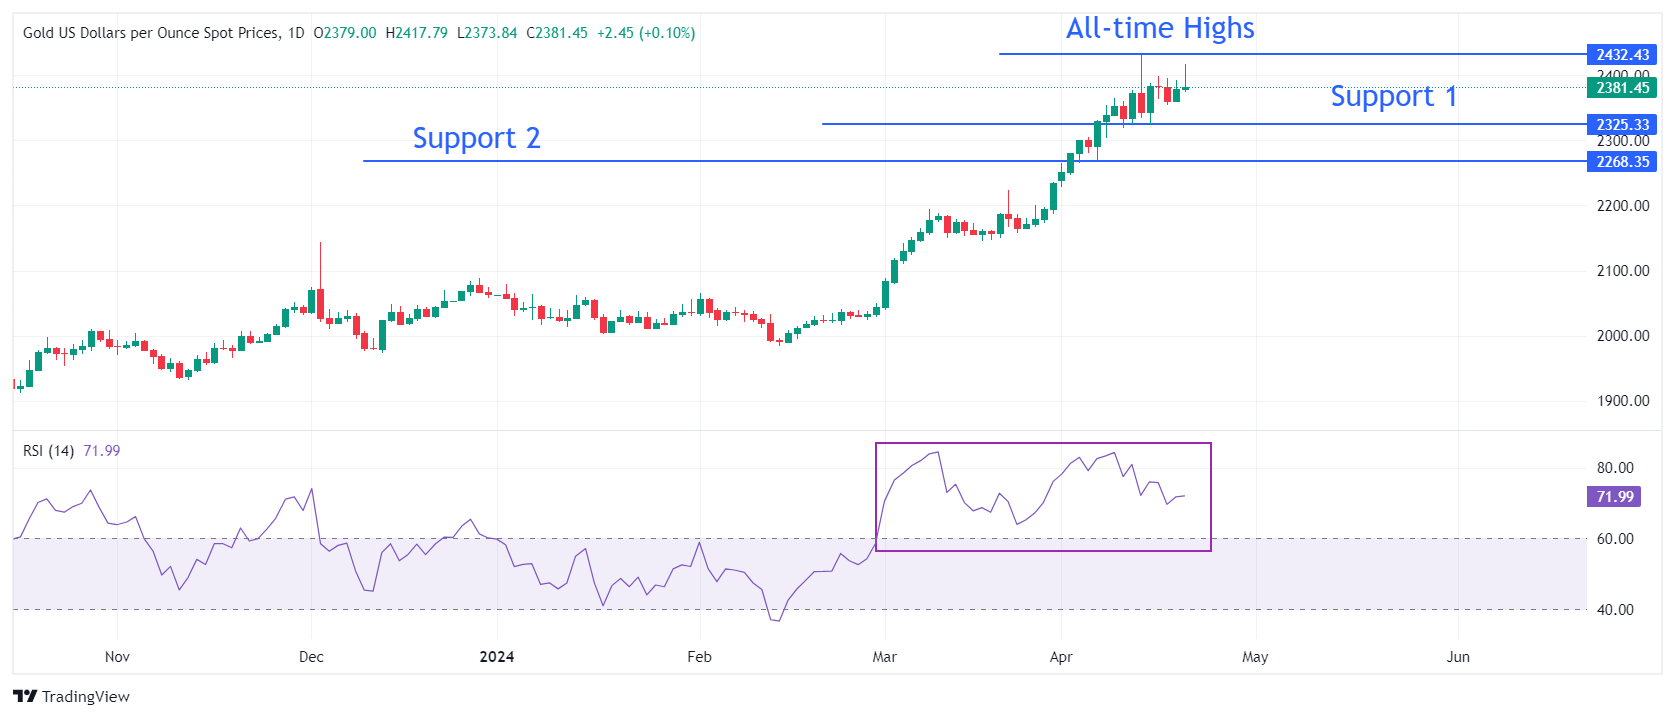
Gold price drops while attempting to sustain above the crucial resistance of $2,400. The precious metal remains in a restricted trajectory as the Fed’s hawkish guidance restricts the upside. Meanwhile, geopolitical uncertainty continues to provide buying interest.
The Gold remains sideways as momentum oscillators cool down after turning extremely overbought. The 14-period Relative Strength Index (RSI) on the daily chart drops slightly after peaking around 85.00. The broader-term demand is intact as the RSI remains in the bullish range of 60.00-80.00.
On the downside, April 5 low near $2,268 and March 21 high at $2,223 will be major support areas.
Gold FAQs
Gold has played a key role in human’s history as it has been widely used as a store of value and medium of exchange. Currently, apart from its shine and usage for jewelry, the precious metal is widely seen as a safe-haven asset, meaning that it is considered a good investment during turbulent times. Gold is also widely seen as a hedge against inflation and against depreciating currencies as it doesn’t rely on any specific issuer or government.
Central banks are the biggest Gold holders. In their aim to support their currencies in turbulent times, central banks tend to diversify their reserves and buy Gold to improve the perceived strength of the economy and the currency. High Gold reserves can be a source of trust for a country’s solvency. Central banks added 1,136 tonnes of Gold worth around $70 billion to their reserves in 2022, according to data from the World Gold Council. This is the highest yearly purchase since records began. Central banks from emerging economies such as China, India and Turkey are quickly increasing their Gold reserves.
Gold has an inverse correlation with the US Dollar and US Treasuries, which are both major reserve and safe-haven assets. When the Dollar depreciates, Gold tends to rise, enabling investors and central banks to diversify their assets in turbulent times. Gold is also inversely correlated with risk assets. A rally in the stock market tends to weaken Gold price, while sell-offs in riskier markets tend to favor the precious metal.
The price can move due to a wide range of factors. Geopolitical instability or fears of a deep recession can quickly make Gold price escalate due to its safe-haven status. As a yield-less asset, Gold tends to rise with lower interest rates, while higher cost of money usually weighs down on the yellow metal. Still, most moves depend on how the US Dollar (USD) behaves as the asset is priced in dollars (XAU/USD). A strong Dollar tends to keep the price of Gold controlled, whereas a weaker Dollar is likely to push Gold prices up.
- USD/CAD avoids the worst excesses of volatility in markets from the reported retaliation of Israel against Iran.
- The flight to safety boosted the US Dollar but the Canadian Dollar benefited equally from surging Oil prices.
- Interest rate differentials remain a bullish factor for the pair as the Fed delays expected interest rate cuts.
USD/CAD is trading in the 1.3750s after edging lower on Friday. The pair has been shielded by the worst excesses of volatility witnessed in markets brought on by the escalating geopolitical situation in the Middle East.
The surge in risk aversion after reports of Israel’s retaliatory attacks on Iran have supported the safe-haven US Dollar (USD) along with the other usual suspects: Gold, JPY, CHF.
Yet the impact on USD/CAD was muted due to the Middle East conflict’s impact on Oil, and the Canadian Dollar’s sensitivity to Oil prices.
WTI Crude Oil prices rose over 4.0% from $81.80 to $85.50 following the news of Israel’s purported attack on Iran. This strengthened CAD because Oil is the country’s primary export.
Beyond the Israeli-Iran conflict, however, other factors are also expected to drive up the price of Oil, according to some analysts.
One factor is the US’s increasingly long list of Oil producing countries who are potential targets for sanctions.
“Less Oil from Iran and Venezuela is likely to reach the market in the coming months, as the US intends to tighten Oil sanctions against Iran and reinstate the Oil sanctions against Venezuela that have been eased in the meantime,” says Commerzbank in a recent note.
Commerzbank sees other bullish factors for Crude in the form of continued OPEC+ supply constraints and increased broad demand for gasoline due to the likelihood that the European Central Bank (ECB) and Federal Reserve (Fed) will start cutting interest rates before the end of the year.
From the perspective of Oil, the outlook favors the CAD side of the USD/CAD pair, and is therefore a bearish factor for USD/CAD.
Diverging outlook on interest rates could support USD/CAD
USD/CAD remains in a short and medium-term uptrend despite the negative spillover effect from Oil prices.
The reason for this is the diverging outlook on the future path of interest rates in the US and Canada. Interest rates are a key FX driver because global capital tends to flow to where interest rates are higher all other things being equal.
This has supported the US Dollar most recently during its early April rally and provided a bullish backwind for USD/CAD.
Interest rates in Canada are expected to fall in the summer amid declining inflation and slower growth but the reverse is increasingly the case in the US.
In the US stronger macroeconomic data, persistently high inflation and a tight labor market are seen as factors likely to keep interest rates comparatively higher for longer.
From expecting three 0.25% rate cuts in 2024 at the start of the year when inflation was tracking lower, the Federal Reserve is now indicating it may only cut twice or perhaps once. Some Federal Reserve officials are even signaling that the central bank should keep interest rates at their present level until more evidence of inflation coming down is available.
Market based indicators of the number of rate cuts have also changed radically with odds now showing the most likely month for the Fed to implement a first rate cut is September, when previously expectations had been zeroed in on June.
The situation in Canada is very different. There, inflation is still tracking lower and the probability of the Bank of Canada (BoC) cutting interest rates by 0.25% in June stands at 70%, according to analysts at Brown Brothers Harriman.
Indeed, on Tuesday, BoC governor Tiff Macklem stated, “there’s some downward momentum in underlying inflation.”
Canadian Consumer Price Index (CPI) data backs this up. Whilst headline inflation crept higher in March – to 2.9% from 2.8% it remains below the BoC's 3.0% target. In addition, the main drivers were rising gasoline prices and the rising US mortgage rates used by many Canadian property owners, according to Tradingeconomics.com.
Both the core-trim and core-median measures of the Consumer Price Index (CPI), however, showed signs of easing – to 3.1% (the lowest since June 2021) and 2.8% (matching the July 2021 low), respectively – according to BBH.
- The US Dollar eases a touch despite safe-haven support on early Friday trading.
- Tensions in the Middle East flared up again with reports of Israel attacking an Iranian military base.
- The US Dollar Index holds above 106.00, though pressure is mounting for a break below it.
The US Dollar Index (DXY), which tracks the US Dollar against a basket of six major currencies, eases and gives up earlier gains driven by the reports of the attack from Israel on Iran, confirmed by US officials. While markets are awaiting any comments or headlines out of Iran, some easing is taking place in safe-haven assets after earlier big inflows in the Greenback, the Japanese Yen (JPY) and the Swiss Franc (CHF). Any harsh rhetoric from Iran might cause a resurgence in the safe-haven demand and further sell-off in risk assets.
On the economic data front, a very thin calendar on Friday, with only Federal Reserve Bank of Chicago President Austan Goolsbee set to speak at a Conference in Chicago. For the main part of the day, markets will be focused on any headline coming out of the Middle East. In terms of rate projections, should Oil prices remain elevated for months to come, the US Federal Reserve (Fed) might have an issue with inflation accelerating because of the rising energy component.
Daily digest market movers: The domino has fallen
- Tensions flare up in the Middle East after Israel targeted an Iranian military airforce base and triggered a shock across the markets in several asset classes:
- Equities are slumping in the red.
- Bonds are demanded, with yields declining.
- Both the Greenback, the Swiss Franc and the Japanese Yen see substantial inflows.
- In the commodity space, both Brent and Crude are ticking up.
- At 14:30 GMT, Federal Reserve Bank of Chicago President Austan Goolsbee participates in a moderated Q&A at the Association for Business Journalists 2024 SABEW Annual Conference in Chicago.
- Surprise comments from European Central Bank (ECB) member Edward Scicluna, who said that the ECB should even consider a 50 basis point cut at its next meeting as inflation is set to undershoot 2%.
- Equity markets are not doing well on the back of the escalation in the Middle East and trade in the red across the board. However, European and US equity futures are off their lows in the first part of European trading hours.
- According to the CME Group’s FedWatch Tool, expectations are further cementing a no-change to the Fed’s monetary policy in June.
- The benchmark 10-year US Treasury Note trades around 4.59%, rather stable after a brief surge to 4.63% earlier on Friday.
US Dollar Index Technical Analysis: Rate differential remains main driver
The US Dollar Index (DXY) might be facing some selling pressure despite the current tensions escalating in the Middle East. This sounds contradictory but makes sense, seeing that bond prices are jumping higher, pushing yields lower and both the Japanese Yen and the Swiss Franc outpacing the Greenback in terms of inflows in the race to safe havens. This paints a very mixed picture, and with markets already having priced in the events from this morning, the US Dollar could be set to ease a touch, with the DXY possibly briefly sliding back below 106.00 by the close on Friday.
On the upside, the fresh Tuesday’s high at 106.52 is the level to beat. Further up and above the 107.00 round level, the DXY Index could meet resistance at 107.35, the October 3 high.
On the downside, the first important level is 105.88, a pivotal level since March 2023. Further down, 105.12 and 104.60 should also act as support ahead of the region with both the 55-day and the 200-day Simple Moving Averages (SMAs) at 104.17 and 103.91, respectively.
US Dollar FAQs
The US Dollar (USD) is the official currency of the United States of America, and the ‘de facto’ currency of a significant number of other countries where it is found in circulation alongside local notes. It is the most heavily traded currency in the world, accounting for over 88% of all global foreign exchange turnover, or an average of $6.6 trillion in transactions per day, according to data from 2022. Following the second world war, the USD took over from the British Pound as the world’s reserve currency. For most of its history, the US Dollar was backed by Gold, until the Bretton Woods Agreement in 1971 when the Gold Standard went away.
The most important single factor impacting on the value of the US Dollar is monetary policy, which is shaped by the Federal Reserve (Fed). The Fed has two mandates: to achieve price stability (control inflation) and foster full employment. Its primary tool to achieve these two goals is by adjusting interest rates. When prices are rising too quickly and inflation is above the Fed’s 2% target, the Fed will raise rates, which helps the USD value. When inflation falls below 2% or the Unemployment Rate is too high, the Fed may lower interest rates, which weighs on the Greenback.
In extreme situations, the Federal Reserve can also print more Dollars and enact quantitative easing (QE). QE is the process by which the Fed substantially increases the flow of credit in a stuck financial system. It is a non-standard policy measure used when credit has dried up because banks will not lend to each other (out of the fear of counterparty default). It is a last resort when simply lowering interest rates is unlikely to achieve the necessary result. It was the Fed’s weapon of choice to combat the credit crunch that occurred during the Great Financial Crisis in 2008. It involves the Fed printing more Dollars and using them to buy US government bonds predominantly from financial institutions. QE usually leads to a weaker US Dollar.
Quantitative tightening (QT) is the reverse process whereby the Federal Reserve stops buying bonds from financial institutions and does not reinvest the principal from the bonds it holds maturing in new purchases. It is usually positive for the US Dollar.
- Oil retreats from its peak above $85 after news that Israel reportedly launched a retaliatory strike on Iran.
- WTI Oil prices broke above $85.00, while Brent pricesbriefly ticked $90.
- The US Dollar Index advances in the green as risk-off sentiment prevails.
Oil prices jumped higher on early Friday trading after Israel retaliated against Iran by attacking targets in the Western of the country, two US officials confirmed to Bloomberg. Iran restricted its airspace and confirmed together with the United Nations nuclear watchdog that no nuclear facilities were hit. The retaliatory attack adds to the possibility of a direct confrontation between Israel and Iran after years of a proxy war between the two.
The US Dollar is seeing substantial inflow from several fronts: flight to safe-haven assets is the main one as investors seek refuge amid fears that the attack could be an inflection point, dragging the whole Middle East in this dispute. Secondly, the Greenback also benefits from the recent spike in energy prices, particularly Oil, as it could cause a second-round effect in inflation in the coming months if this situation lingers on for an extended period. This opens room for even another interest-rate hike from the US Federal Reserve (Fed), although it is not the base case scenario for nearly every Fed member.
Crude Oil (WTI) trades at $83.08 and Brent Crude at $87.55 at the time of writing.
Oil news and market movers: Crucial what US will do next
- Stephen Dainton, head of investment bank management at Barclays, said to Bloomberg that the retreat in Oil might be taking place this Friday with markets digesting the headlines, though, from now on Oil will trade in a higher range and might not slide back below $80 anytime soon
- The US Embassy in Jerusalem has issued a security alert for government officials and their families, according to Reuters.
- Iran’s communication via state television appears to be downplaying the situation, downsizing the attacks to just a few minor blasts. The New York Times, though, mentioned three Iranian officials saying that a military air base near the city of Isfahan was hit by the attack.
- Meanwhile, Israel Minister President Benjamin Netanyahu faces criticism from his National Security Minister Itamar Ben Gvir, who said in a tweet that the attack was a “weak” attempt.
Oil Technical Analysis: Initial easing before next step higher
Oil prices rallied over 4% on the back of the headlines coming from the Middle East in early morning trading on Friday. Expect to see some easing throughout this Friday if markets assume the response from Israel was contained and Iran keeps its head cool and does not retaliate. Still, markets are likely to remain very headline-sensitive until Iran officially communicates.
With geopolitical tensions lingering, the $83.34 and $90 handle should remain in grasp. One small barrier in the way is $89.64, the peak from October 20. In case of further escalating tensions, expect even September’s peak at $94 to become a possibility, and a fresh 18-month high could be on the cards.
On the downside, $80.63 is the next candidate as a pivotal supportive level. A touch softer, the convergence with the 55-day and the 200-day Simple Moving Averages (SMAs) at $79.88 and $79.57 should halt any further downturn.
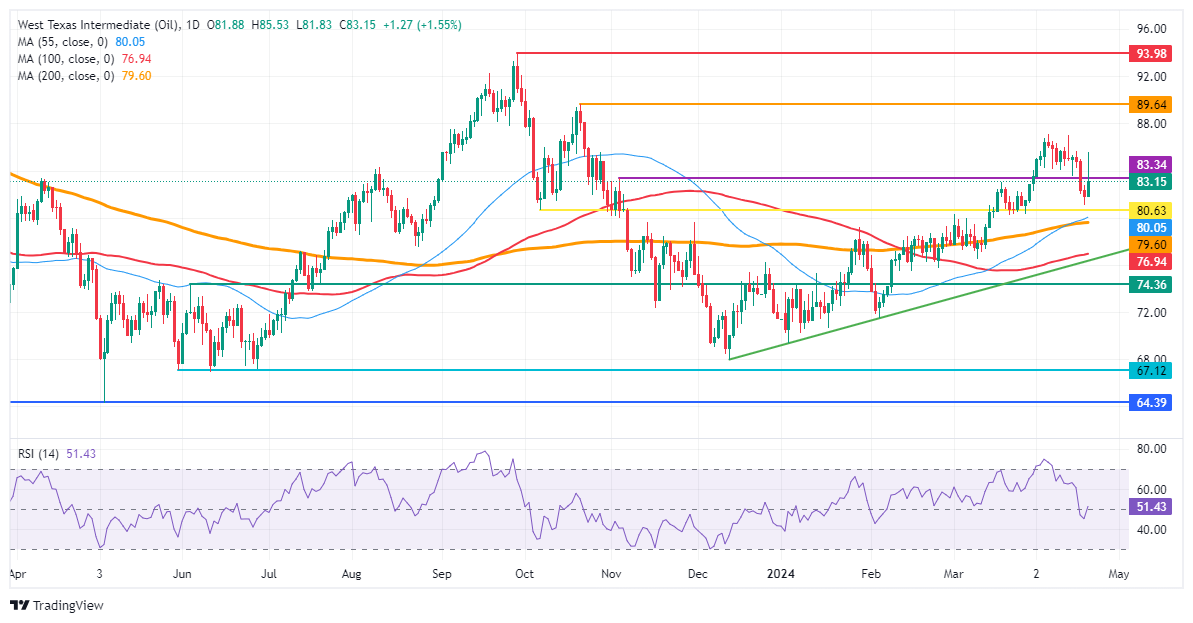
US WTI Crude Oil: Daily Chart
WTI Oil FAQs
WTI Oil is a type of Crude Oil sold on international markets. The WTI stands for West Texas Intermediate, one of three major types including Brent and Dubai Crude. WTI is also referred to as “light” and “sweet” because of its relatively low gravity and sulfur content respectively. It is considered a high quality Oil that is easily refined. It is sourced in the United States and distributed via the Cushing hub, which is considered “The Pipeline Crossroads of the World”. It is a benchmark for the Oil market and WTI price is frequently quoted in the media.
Like all assets, supply and demand are the key drivers of WTI Oil price. As such, global growth can be a driver of increased demand and vice versa for weak global growth. Political instability, wars, and sanctions can disrupt supply and impact prices. The decisions of OPEC, a group of major Oil-producing countries, is another key driver of price. The value of the US Dollar influences the price of WTI Crude Oil, since Oil is predominantly traded in US Dollars, thus a weaker US Dollar can make Oil more affordable and vice versa.
The weekly Oil inventory reports published by the American Petroleum Institute (API) and the Energy Information Agency (EIA) impact the price of WTI Oil. Changes in inventories reflect fluctuating supply and demand. If the data shows a drop in inventories it can indicate increased demand, pushing up Oil price. Higher inventories can reflect increased supply, pushing down prices. API’s report is published every Tuesday and EIA’s the day after. Their results are usually similar, falling within 1% of each other 75% of the time. The EIA data is considered more reliable, since it is a government agency.
OPEC (Organization of the Petroleum Exporting Countries) is a group of 13 Oil-producing nations who collectively decide production quotas for member countries at twice-yearly meetings. Their decisions often impact WTI Oil prices. When OPEC decides to lower quotas, it can tighten supply, pushing up Oil prices. When OPEC increases production, it has the opposite effect. OPEC+ refers to an expanded group that includes ten extra non-OPEC members, the most notable of which is Russia.
- The Mexican Peso rips lower in a volatile sell-off after markets switch risk averse on geopolitical tensions.
- Israel purportedly retaliates against Iran, with explosions heard in the Iranian city of Isfahan.
- USD/MXN surges to just below 18.00 on the news but then retreats and settles in the 17.30s.
The Mexican Peso (MXN) is trading in the 17.30s on Friday after an extremely volatile 24 hours in which the currency depreciated by over five percentage points in some pairs as a result of a mass exodus to safety.
The Mexican Peso was roiled by news reports of an Israeli attack on Iran in retaliation for the April 13 drone attacks by Iran against Israel. According to Reuters, explosions were heard in the Iranian city of Isfahan where a military base is located.
Markets reacted in an extreme way with investors piling into safe-haven assets such as Gold, the Japanese Yen (JPY), the Swiss Franc (CHF) and the US Dollar (USD). At the other end of the spectrum, currencies perceived as “risky” such as the Mexican Peso and the South African Rand got hammered.
This caused the sudden whipsaw in the Mexican Peso’s pairs, as investors in their droves dropped the currency like a hot taco.
Fedspeak also stokes Mexican Peso weakness against USD
The Mexican Peso’s sharp decline was not caused solely by the flight to safety from Israel’s retaliation, but in the case of its most traded pair, the USD/MXN, also because of the impact of more hawkish talk from rate-setters at the US Federal Reserve (Fed).
From expecting three 0.25% interest rate cuts from the Fed in 2024, the mood music now coming out of the US central bank suggests officials only expect one, possibly two, and in extreme cases no cuts to the Fed Funds Rate materializing this year.
Atlanta Fed President Raphael Bostic said on Thursday that US inflation is returning to the Fed’s 2.0% target at a slower pace than anticipated and that interest-rate cuts are likely – but not until year-end.
New York Fed President John Williams went further, saying he didn’t feel an urgency to cut interest rates and that monetary policy is in a good place.
US data also arguably supported the notion that borrowing costs are where they should be due to inflationary tendencies.
The Index of Prices Paid component of the Philadelphia Fed Manufacturing Survey – a regional barometer of inflation – surged unexpectedly to 23.00 (prior 3.7) in April, suggesting price pressures remain very much alive and kicking.
A steady reading for Initial Jobless Claims further reinforced the view that the US labor market is tight and likely to continue to stoke inflation.
Since higher inflation will require the maintenance of higher interest rates to combat it, the odds of the Federal Reserve cutting interest rates keep falling. This is positive for the US Dollar since higher interest rates tend to increase foreign capital inflows.
On the data front, Mexican Peso traders will be keeping an eye on Mexican Retail Sales data out at 12:00 GMT on Friday, although the likelihood of it moving the dial for the Peso remains low.
Technical Analysis: USD/MXN surges
USD/MXN – the value of one US Dollar in Mexican Pesos – broke out of the bullish Pennant price pattern it had formed on the 4-hour chart, surged up to the target for the pattern at roughly 17.43, and then surpassed it.
The breakout higher now suggests a bullish reversal has occurred in both the short and intermediate term trends. This now favors long positions over those time horizons (up to 6 months).
USD/MXN 4-hour Chart
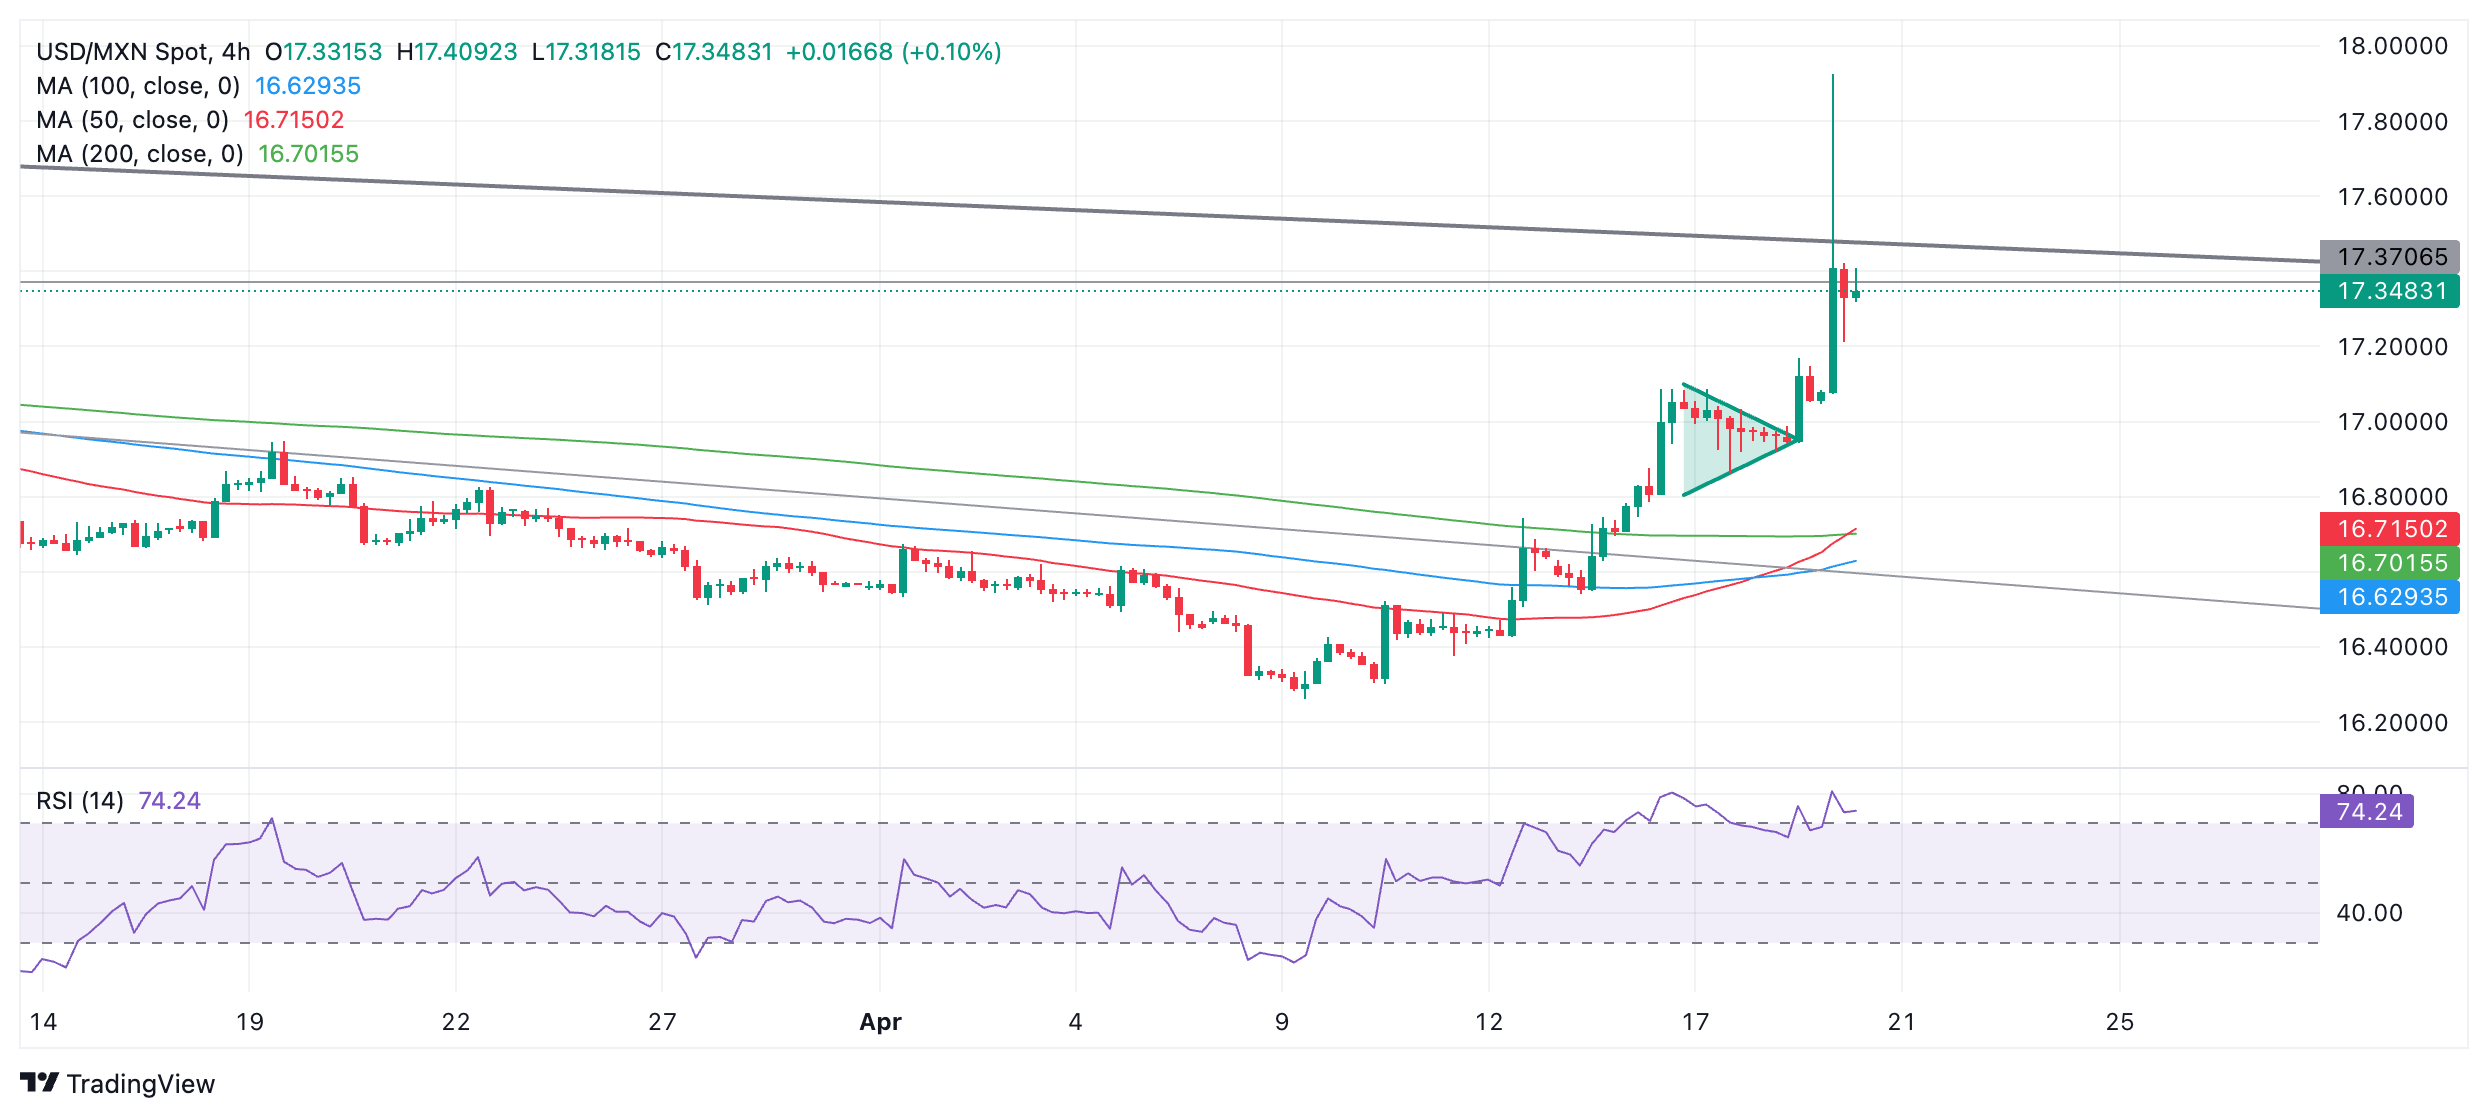
USD/MXN pierced but ultimately failed to hold above a major trendline for the long-term downtrend, suggesting caution should be exercised before becoming uber-bullish over the long term.
That said, peaks and troughs keep rising on the 4-hour chart and, as the old adage goes, “The trend is your friend until the bend at the end,” so more upside is the default expectation in the near term.
The Relative Strength Index (RSI) has risen into overbought territory, suggesting an increasing risk of a pullback. However, RSI is often overbought for long periods of time in strongly trending markets. Nevertheless, traders are advised not to add to their long positions and wait for a pullback into neutral territory before reloading their longs.
A decisive break above the trendline at roughly 17.45 would provide reconfirmation of further upside, and activate an upside target at roughly 18.15.
A decisive break would be one characterized by a longer-than-average green daily candlestick that pierces above the trendline and closes near its high, or three green candlesticks in a row that pierce above the level.
If a pullback persists, support from the 200-day Simple Moving Average (SMA) at 17.17 is likely to provide a foothold for the backsliding price.
Mexican Peso FAQs
The Mexican Peso (MXN) is the most traded currency among its Latin American peers. Its value is broadly determined by the performance of the Mexican economy, the country’s central bank’s policy, the amount of foreign investment in the country and even the levels of remittances sent by Mexicans who live abroad, particularly in the United States. Geopolitical trends can also move MXN: for example, the process of nearshoring – or the decision by some firms to relocate manufacturing capacity and supply chains closer to their home countries – is also seen as a catalyst for the Mexican currency as the country is considered a key manufacturing hub in the American continent. Another catalyst for MXN is Oil prices as Mexico is a key exporter of the commodity.
The main objective of Mexico’s central bank, also known as Banxico, is to maintain inflation at low and stable levels (at or close to its target of 3%, the midpoint in a tolerance band of between 2% and 4%). To this end, the bank sets an appropriate level of interest rates. When inflation is too high, Banxico will attempt to tame it by raising interest rates, making it more expensive for households and businesses to borrow money, thus cooling demand and the overall economy. Higher interest rates are generally positive for the Mexican Peso (MXN) as they lead to higher yields, making the country a more attractive place for investors. On the contrary, lower interest rates tend to weaken MXN.
Macroeconomic data releases are key to assess the state of the economy and can have an impact on the Mexican Peso (MXN) valuation. A strong Mexican economy, based on high economic growth, low unemployment and high confidence is good for MXN. Not only does it attract more foreign investment but it may encourage the Bank of Mexico (Banxico) to increase interest rates, particularly if this strength comes together with elevated inflation. However, if economic data is weak, MXN is likely to depreciate.
As an emerging-market currency, the Mexican Peso (MXN) tends to strive during risk-on periods, or when investors perceive that broader market risks are low and thus are eager to engage with investments that carry a higher risk. Conversely, MXN tends to weaken at times of market turbulence or economic uncertainty as investors tend to sell higher-risk assets and flee to the more-stable safe havens.
Silver prices (XAG/USD) rose on Friday, according to FXStreet data. Silver trades at $28.32 per troy ounce, up 0.28% from the $28.24 it cost on Thursday.
Silver prices have increased by 11.19% since the beginning of the year.
| Unit measure | Today Price |
|---|---|
| Silver price per troy ounce | $28.32 |
| Silver price per gram | $0.91 |
The Gold/Silver ratio, which shows the number of troy ounces of Silver needed to equal the value of one troy ounce of Gold, stood at 84.19 on Friday, down from 84.24 on Thursday.
Investors might use this ratio to determine the relative valuation of Gold and Silver. Some may consider a high ratio as an indicator that Silver is undervalued – or Gold is overvalued – and might buy Silver or sell Gold accordingly. Conversely, a low ratio might suggest that Gold is undervalued relative to Silver.
(An automation tool was used in creating this post.)
Silver FAQs
Silver is a precious metal highly traded among investors. It has been historically used as a store of value and a medium of exchange. Although less popular than Gold, traders may turn to Silver to diversify their investment portfolio, for its intrinsic value or as a potential hedge during high-inflation periods. Investors can buy physical Silver, in coins or in bars, or trade it through vehicles such as Exchange Traded Funds, which track its price on international markets.
Silver prices can move due to a wide range of factors. Geopolitical instability or fears of a deep recession can make Silver price escalate due to its safe-haven status, although to a lesser extent than Gold's. As a yieldless asset, Silver tends to rise with lower interest rates. Its moves also depend on how the US Dollar (USD) behaves as the asset is priced in dollars (XAG/USD). A strong Dollar tends to keep the price of Silver at bay, whereas a weaker Dollar is likely to propel prices up. Other factors such as investment demand, mining supply – Silver is much more abundant than Gold – and recycling rates can also affect prices.
Silver is widely used in industry, particularly in sectors such as electronics or solar energy, as it has one of the highest electric conductivity of all metals – more than Copper and Gold. A surge in demand can increase prices, while a decline tends to lower them. Dynamics in the US, Chinese and Indian economies can also contribute to price swings: for the US and particularly China, their big industrial sectors use Silver in various processes; in India, consumers’ demand for the precious metal for jewellery also plays a key role in setting prices.
Silver prices tend to follow Gold's moves. When Gold prices rise, Silver typically follows suit, as their status as safe-haven assets is similar. The Gold/Silver ratio, which shows the number of ounces of Silver needed to equal the value of one ounce of Gold, may help to determine the relative valuation between both metals. Some investors may consider a high ratio as an indicator that Silver is undervalued, or Gold is overvalued. On the contrary, a low ratio might suggest that Gold is undervalued relative to Silver.
Gold prices rose in India on Friday, according to data from India's Multi Commodity Exchange (MCX).
Gold price stood at 73,280 Indian Rupees (INR) per 10 grams, up INR 250 compared with the INR 73,030 it cost on Thursday.
As for futures contracts, Gold prices decreased to INR 72,635 per 10 gms from INR 72,898 per 10 gms.
Prices for Silver futures contracts increased to INR 83,280 per kg from INR 83,273 per kg.
| Major Indian city | Gold Price |
|---|---|
| Ahmedabad | 75,735 |
| Mumbai | 75,675 |
| New Delhi | 75,645 |
| Chennai | 75,820 |
| Kolkata | 75,835 |
Global Market Movers: Comex Gold price glitters on mounting geopolitical tensions
- Comex Gold price remains supported amid a cautious market environment, following reports of Israeli missiles striking a site in Iran.
- Iran’s Fars News Agency reported explosions at the central Isfahan airport.
- The gains in the US Dollar could limit the advance of the Gold prices.
- Hawkish US Federal Reserve (Fed) commentaries also continue to justify a delayed policy pivot, keep the US Dollar underpinned at the expense of Gold price.
(An automation tool was used in creating this post.)
Gold FAQs
Gold has played a key role in human’s history as it has been widely used as a store of value and medium of exchange. Currently, apart from its shine and usage for jewelry, the precious metal is widely seen as a safe-haven asset, meaning that it is considered a good investment during turbulent times. Gold is also widely seen as a hedge against inflation and against depreciating currencies as it doesn’t rely on any specific issuer or government.
Central banks are the biggest Gold holders. In their aim to support their currencies in turbulent times, central banks tend to diversify their reserves and buy Gold to improve the perceived strength of the economy and the currency. High Gold reserves can be a source of trust for a country’s solvency. Central banks added 1,136 tonnes of Gold worth around $70 billion to their reserves in 2022, according to data from the World Gold Council. This is the highest yearly purchase since records began. Central banks from emerging economies such as China, India and Turkey are quickly increasing their Gold reserves.
Gold has an inverse correlation with the US Dollar and US Treasuries, which are both major reserve and safe-haven assets. When the Dollar depreciates, Gold tends to rise, enabling investors and central banks to diversify their assets in turbulent times. Gold is also inversely correlated with risk assets. A rally in the stock market tends to weaken Gold price, while sell-offs in riskier markets tend to favor the precious metal.
The price can move due to a wide range of factors. Geopolitical instability or fears of a deep recession can quickly make Gold price escalate due to its safe-haven status. As a yield-less asset, Gold tends to rise with lower interest rates, while higher cost of money usually weighs down on the yellow metal. Still, most moves depend on how the US Dollar (USD) behaves as the asset is priced in dollars (XAU/USD). A strong Dollar tends to keep the price of Gold controlled, whereas a weaker Dollar is likely to push Gold prices up.
- USD/CHF trims daily losses on expectations of de-escalating the Israel-Iran situation.
- An Iranian official stated there is currently no immediate plan for retaliation against the Israeli airstrikes.
- The US Dollar may gain ground on higher US Treasury yields as Fed officials conveyed hawkish messages on Thursday.
USD/CHF trades around 0.9080 during the European hours on Friday. The pair trims intraday losses after the statement made by an Iranian official that there is no immediate plan of retaliation against Israeli airstrikes.
The safe-haven Swiss Franc (CHF) strengthened as risk aversion spread across financial markets, triggered by reports from ABC News confirming Israeli missile strikes on a site in Iran on Friday, which heightened tensions in the Middle East. Additionally, Reuters cited Iran’s Fars News Agency reporting that locals heard explosions at the central Isfahan airport.
In the near term, the Swiss Franc is anticipated to encounter downward pressure as the Swiss National Bank (SNB) is projected to further decrease interest rates. With price pressures in the Swiss economy persisting below the targeted rate of 2%, SNB might implement another rate cut during its upcoming June meeting.
The US Dollar Index (DXY), which gauges the US Dollar (USD) against six major currencies, edges lower to near 106.10. Nevertheless, hawkish comments from Federal Reserve (Fed) officials on Thursday prompted a rise in US Treasury yields. At present, 2-year and 10-year yields on US Treasury bonds are at 4.96% and 4.58%, respectively. The higher yields may attract support for the Greenback, thus underpinning the USD/CHF.
Atlanta Fed President Raphael Bostic emphasized that US inflation is unreasonably high and stressed the need for the Fed to continue making strides in addressing inflation. Additionally, New York Fed President John Williams underscored the Fed's dedication to being guided by data and indicated that he does not currently see an urgent necessity to decrease interest rates.
- EUR/USD has recovered after an early sell-off due to news of an escalation in the conflict in the Middle East.
- Israel purportedly launched drones at Iran in retaliation for its April 13 attack.
- EUR/USD is consolidating in a downtrend.
EUR/USD is trading in the lower 1.0600s at the time of writing, after recovering slightly from an early bout of weakness. News reports of an escalation in the Middle East conflict had prompted a flight to the safe-haven US Dollar (USD), with a resulting decline in EUR/USD.
Overnight, reports of explosions in the Iranian city of Isfahan, which houses a military barracks, according to Reuters, suggested Israel has retaliated against Iran for its April 13 drone attack. The escalation had a direct impact on markets, with demand for safe-havens assets – Gold, CHF, JPY and USD – ratcheting up.
EUR/USD, which measures the number of US Dollars that can be bought with one Euro, fell back down to 1.0610 on the news, close to the 1.0601 April 16 year-to-date (YTD) low. Since then the exchange rate has recovered a bit, and is currently exchanging hands in the 1.0630s.
EUR/USD pressured by ECB comments
EUR/USD started Thursday bullishly after the President of the European Central Bank (ECB) Christine Lagarde stated “The game (of fighting inflation) is not over,” suggesting perhaps some doubt as to whether it was time to start cutting interest rates. Given the maintenance of higher interest rates is positive for a currency since it attracts greater inflows of foreign capital, the Euro (EUR) strengthened following her remarks.
EUR/USD reversed course after touching technical resistance just shy of 1.0700 and resumed its short-term downtrend as a roll-call of other ECB officials expressed the opposite view, i.e that cutting interest rates was necessary if not overdue.
The President of the Banque de France and ECB governing council member François Villeroy de Galhau, for example, stated that a cut to borrowing costs was due, and delaying could be detrimental to growth, placing the ECB “behind the curve”.
Vice-President of the ECB Luis de Guindos was more tempered, saying the central bank would reduce rates if the data evolved as expected. ECB governing council member Joachim Nagel said a June rate cut appeared increasingly likely, although certain inflation data remained higher than expected.
Fed members adopt increasingly hawkish line
EUR/USD’s reversal lower on Thursday gained momentum after the release of the Philadelphia Fed Manufacturing Survey’s Index Prices Paid component – a regional inflation metric – shot up unexpectedly to 23.00 (prior 3.7), suggesting price pressures remain alive and kicking.
Flat Initial Jobless Claims further reinforced the view that the US labor market is likely to continue to be a source of inflation.
Commentary from Federal Reserve rate-setters suggested a shift to an increasingly hawkish stance (meaning in favor of high interest rates for longer).
Atlanta Fed President Raphael Bostic said US inflation is returning to the Fed’s 2.0% target at a slower pace than many had anticipated, adding he’d be comfortable being patient, and that interest rate cuts are likely – but not until year end.
New York Fed President John Williams went further, saying he didn’t feel an urgency to cut interest rates and that monetary policy is in a good place.
Technical Analysis: EUR/USD consolidates within a bear trend
EUR/USD seems to be messing around in the gap between the YTD lows at 1.0601 and the resistance from the last major swing low in February at just shy of 1.0700.
The short and medium-term trends are bearish, suggesting more weakness will eventually come.
EUR/USD Daily Chart
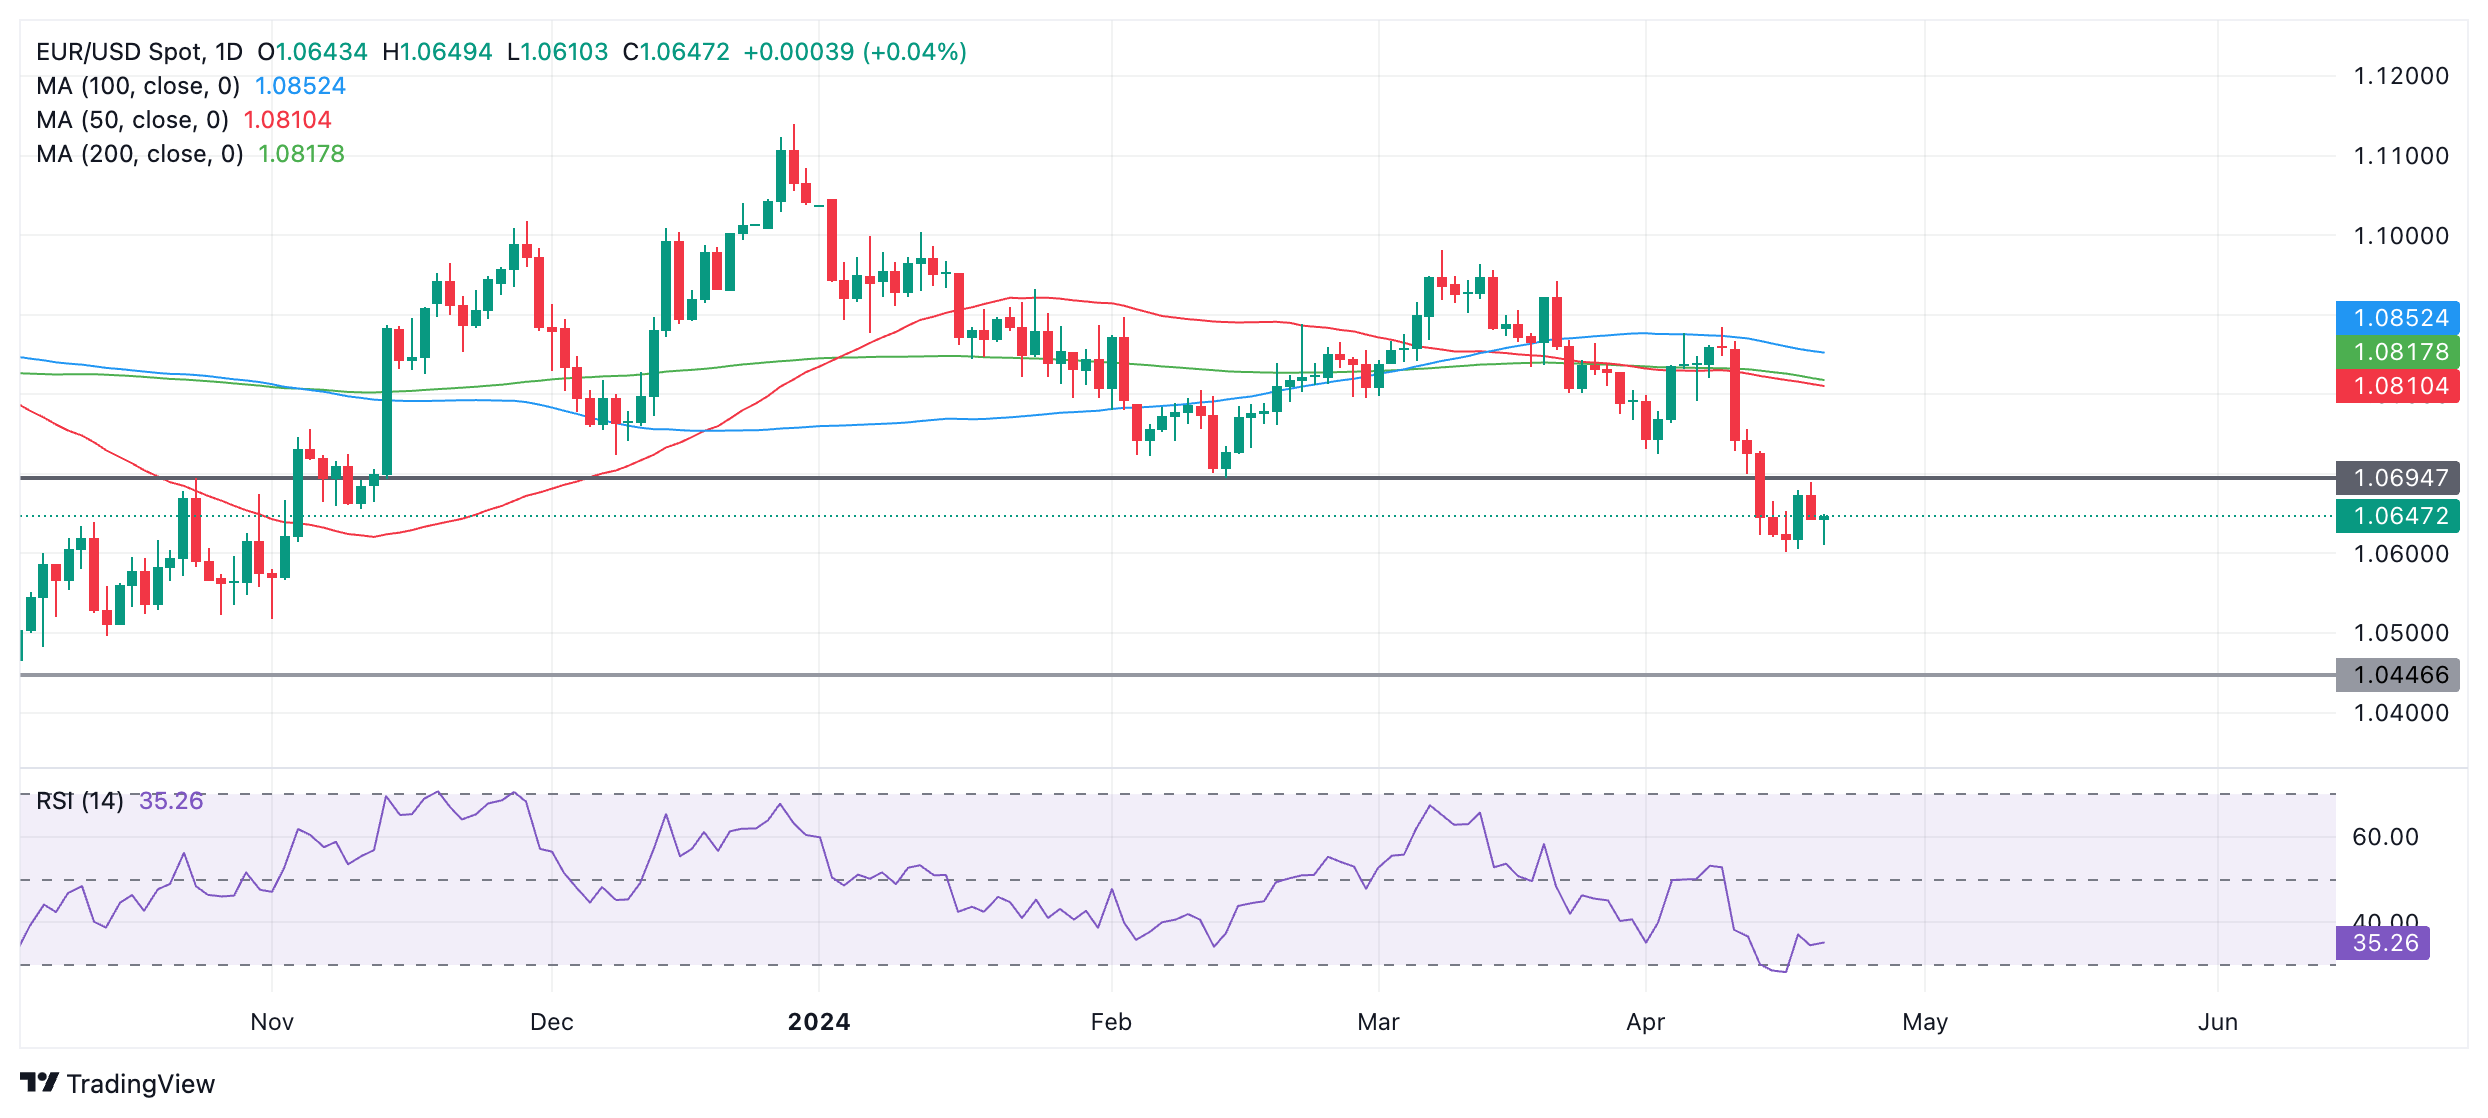
The Relative Strength Index (RSI) has exited oversold conditions, indicating renewed potential for more downside.
A break below the 1.0601 April lows would post a lower low and give renewed confidence to bears. After that, the next concrete target is at 1.0446, the October 2023 low.
Resistance at around 1.0700 will need to be overcome for bulls to reappear. In the case of a really bullish move, the April 2 swing low at 1.0725 provides the next upside target followed by 1.0800, where a cluster of major Moving Averages coils.
Euro FAQs
The Euro is the currency for the 20 European Union countries that belong to the Eurozone. It is the second most heavily traded currency in the world behind the US Dollar. In 2022, it accounted for 31% of all foreign exchange transactions, with an average daily turnover of over $2.2 trillion a day. EUR/USD is the most heavily traded currency pair in the world, accounting for an estimated 30% off all transactions, followed by EUR/JPY (4%), EUR/GBP (3%) and EUR/AUD (2%).
The European Central Bank (ECB) in Frankfurt, Germany, is the reserve bank for the Eurozone. The ECB sets interest rates and manages monetary policy. The ECB’s primary mandate is to maintain price stability, which means either controlling inflation or stimulating growth. Its primary tool is the raising or lowering of interest rates. Relatively high interest rates – or the expectation of higher rates – will usually benefit the Euro and vice versa. The ECB Governing Council makes monetary policy decisions at meetings held eight times a year. Decisions are made by heads of the Eurozone national banks and six permanent members, including the President of the ECB, Christine Lagarde.
Eurozone inflation data, measured by the Harmonized Index of Consumer Prices (HICP), is an important econometric for the Euro. If inflation rises more than expected, especially if above the ECB’s 2% target, it obliges the ECB to raise interest rates to bring it back under control. Relatively high interest rates compared to its counterparts will usually benefit the Euro, as it makes the region more attractive as a place for global investors to park their money.
Data releases gauge the health of the economy and can impact on the Euro. Indicators such as GDP, Manufacturing and Services PMIs, employment, and consumer sentiment surveys can all influence the direction of the single currency. A strong economy is good for the Euro. Not only does it attract more foreign investment but it may encourage the ECB to put up interest rates, which will directly strengthen the Euro. Otherwise, if economic data is weak, the Euro is likely to fall. Economic data for the four largest economies in the euro area (Germany, France, Italy and Spain) are especially significant, as they account for 75% of the Eurozone’s economy.
Another significant data release for the Euro is the Trade Balance. This indicator measures the difference between what a country earns from its exports and what it spends on imports over a given period. If a country produces highly sought after exports then its currency will gain in value purely from the extra demand created from foreign buyers seeking to purchase these goods. Therefore, a positive net Trade Balance strengthens a currency and vice versa for a negative balance.
- USD/JPY maintains its position around 154.50 after partially recovering its daily losses on Friday.
- Reuters reported that an Iranian official stated there is currently no immediate plan for retaliation against the Israeli airstrikes.
- The Greenback gained traction after Fed officials conveyed hawkish messages on Thursday.
USD/JPY reverses its losses as a senior Iranian official reportedly stated that there is no immediate plan for retaliation against the Israeli missiles strike on Iran on Friday, as per a Reuters report. This has reduced the likelihood of escalating tensions in the Middle East. The pair holds steady around 154.50 during the early European session on Friday.
The Japanese Yen (JPY) strengthened as risk aversion sentiment spread across financial markets following ABC News' report of Israeli missiles striking a site in Iran. Additionally, the JPY received marginal support from the release of Japan's inflation data on Friday. Overall, the Yen's strength exerted pressure on the USD/JPY pair.
The National Consumer Price Index (CPI) for March increased by 2.7% year-over-year, compared to a 2.8% rise in February, according to the latest data from the Japan Statistics Bureau. This index measures the price fluctuations of goods and services purchased by households.
On Thursday, hawkish remarks from Bank of Japan’s (BoJ) Governor Kazuo Ueda supported the JPY. According to a Reuters report, Ueda mentioned in a press conference that the central bank might consider raising interest rates again if significant declines in the Yen substantially boost inflation.
Meanwhile, on the US side, Federal Reserve (Fed) officials conveyed hawkish messages on Thursday, resulting in a surge in US Treasury yields and the US Dollar (USD), which consequently limited the losses of the USD/JPY pair.
Traders are anticipated to closely monitor upcoming speeches from Federal Reserve officials. Atlanta Fed President Raphael Bostic will discuss the US economic outlook at the University of Miami, Florida. Additionally, Chicago Fed President Austan Goolsbee will participate in a moderated Q&A session at the Association for Business Journalists 2024 SABEW Annual Conference in Chicago.
- The Pound Sterling finds cushion near 1.2400 after mixed UK Retail Sales data for March.
- Geopolitical fears and a strong outlook for the US Dollar restrict the upside in the GBP/USD pair.
- Fed's Bostic said he is comfortable with interest rates remaining high.
The Pound Sterling (GBP) finds a temporary support near almost five-month low around 1.2400 in Friday’s London session. The GBP/USD pair remains on the backfoot due to deepening geopolitical tensions after Israel reportedly launched an attack against Iran, which improved the appeal for the safe-haven US Dollar. Moreover, continued hawkish guidance on interest rates from Federal Reserve (Fed) policymakers kept the US Dollar Index (DXY) above the crucial support of 106.00.
On Thursday, Atlanta Fed President Raphael Bostic said progress in inflation towards the 2% target will be slower than expected. Bostic also said he is comfortable with interest rates remaining high as labor demand is robust and wage growth remains resilient.
On the economic calendar front, the United Kingdom Retail Sales report for March has highlighted the consequences of higher interest rates. UK Retail Sales remained stagnant month-on-month as a decline in food and non-store retailing was offset by spending on fuel and non-food items.
Daily digest market movers: Pound Sterling finds support after mixed UK Retail Sales data
- The Pound Sterling finds interim support near 1.2400. The near-term outlook remains weak as the market mood turns risk-off due to fears of further escalation in Middle East tensions. Israel retaliated to Iran’s attack with drones in Friday’s early Asian session, Reuters reported citing several US officials. Iranian state media said that the air defense system brought down three drones over the central city of Isfahan.
- UK Retail Sales were unchanged in March compared with the previous month, according to data from the country's Office for National Statistics, less than the 0.3% increase forecasted by economists. In February, Retail Sales grew by a meagre 0.1%. On an annual basis, Retail Sales grew sharply by 0.8% after contracting by 0.3% in February.
- Retail Sales data indicate the current status of consumer spending, which accounts for a major part of economic growth. A stagnant performance on a month-on-month basis indicates that the BoE's high interest rates have significantly impacted consumer spending.
- Going forward, headlines surrounding the Middle East conflict and speculation about BoE rate cuts will guide the next move in the Pound Sterling. On the latter, markets currently anticipate the BoE starting to lower rates in November as March inflation data declined at a slower pace than estimated.
- On Thursday, BoE policymaker Megan Greene said in the Atlantic Council think tank in Washington: "The numbers that we're seeing in terms of wage growth and services inflation just aren't consistent with a sustainable 2% (consumer price) inflation target." When asked about a potential time frame for rate cuts, Greene said: "I don't think it's imminent."
Technical Analysis: Pound Sterling attempts to sustain above 1.2400
The Pound Sterling refreshes an almost five-month low near 1.2400 against the US Dollar. The GBP/USD pair is expected to see more downside as the longer-term outlook is bearish. The asset remains below the 200-day Exponential Moving Average (EMA), which trades around 1.2560. The Cable experienced a sharp downside after a breakdown of the Head and Shoulder chart pattern formed on a daily time frame.
Adding to that, 14-period Relative Strength Index (RSI) oscillates inside the bearish range of between 20.00 and 40.00, suggesting momentum leans to the downside.
Pound Sterling FAQs
The Pound Sterling (GBP) is the oldest currency in the world (886 AD) and the official currency of the United Kingdom. It is the fourth most traded unit for foreign exchange (FX) in the world, accounting for 12% of all transactions, averaging $630 billion a day, according to 2022 data. Its key trading pairs are GBP/USD, aka ‘Cable’, which accounts for 11% of FX, GBP/JPY, or the ‘Dragon’ as it is known by traders (3%), and EUR/GBP (2%). The Pound Sterling is issued by the Bank of England (BoE).
The single most important factor influencing the value of the Pound Sterling is monetary policy decided by the Bank of England. The BoE bases its decisions on whether it has achieved its primary goal of “price stability” – a steady inflation rate of around 2%. Its primary tool for achieving this is the adjustment of interest rates. When inflation is too high, the BoE will try to rein it in by raising interest rates, making it more expensive for people and businesses to access credit. This is generally positive for GBP, as higher interest rates make the UK a more attractive place for global investors to park their money. When inflation falls too low it is a sign economic growth is slowing. In this scenario, the BoE will consider lowering interest rates to cheapen credit so businesses will borrow more to invest in growth-generating projects.
Data releases gauge the health of the economy and can impact the value of the Pound Sterling. Indicators such as GDP, Manufacturing and Services PMIs, and employment can all influence the direction of the GBP. A strong economy is good for Sterling. Not only does it attract more foreign investment but it may encourage the BoE to put up interest rates, which will directly strengthen GBP. Otherwise, if economic data is weak, the Pound Sterling is likely to fall.
Another significant data release for the Pound Sterling is the Trade Balance. This indicator measures the difference between what a country earns from its exports and what it spends on imports over a given period. If a country produces highly sought-after exports, its currency will benefit purely from the extra demand created from foreign buyers seeking to purchase these goods. Therefore, a positive net Trade Balance strengthens a currency and vice versa for a negative balance.
Here is what you need to know on Friday, April 19:
Safe-haven flows dominate the action in financial markets on the last trading day of the week as investors seek refuge on growing fears over a deepening conflict in the Middle East. The economic calendar will not feature any high-tier data releases and market participants will keep a close eye on geopolitical headlines.
In the early hours of Friday, reports of Israeli missiles striking Iran triggered a flight to safety. Although Israel is yet to officially confirm a retaliatory attack against Iran, several news outlets, such CBS and CNN, reported US officials saying that Israel has carried out the strike. On the other hand, Iranian state media said that the air defense system brought down three drones over the central city of Isfahan. Moreover, a senior Iranian official told Reuters that there was no plan for an immediate retaliation because there was no clarification on who was behind the incident.
Risk-aversion grips financial markets after Israeli missiles strike a site in Iran.
Reflecting the risk-averse market atmosphere, US stock index futures are down between 0.55% and 0.8% in the early European session. Meanwhile, the US Dollar Index holds relatively steady above 106.00 after closing in positive territory on Thursday.
US Dollar price this week
The table below shows the percentage change of US Dollar (USD) against listed major currencies this week. US Dollar was the strongest against the New Zealand Dollar.
| USD | EUR | GBP | CAD | AUD | JPY | NZD | CHF | |
| USD | 0.06% | 0.28% | 0.08% | 0.99% | 0.75% | 1.01% | -0.49% | |
| EUR | -0.03% | 0.23% | 0.06% | 1.00% | 0.71% | 0.97% | -0.53% | |
| GBP | -0.27% | -0.21% | -0.18% | 0.72% | 0.48% | 0.73% | -0.76% | |
| CAD | -0.09% | -0.04% | 0.17% | 0.94% | 0.63% | 0.92% | -0.59% | |
| AUD | -1.04% | -0.99% | -0.79% | -0.95% | -0.29% | -0.03% | -1.54% | |
| JPY | -0.74% | -0.68% | -0.46% | -0.66% | 0.24% | 0.28% | -1.25% | |
| NZD | -1.02% | -0.97% | -0.75% | -0.93% | 0.02% | -0.27% | -1.51% | |
| CHF | 0.49% | 0.55% | 0.77% | 0.58% | 1.47% | 1.23% | 1.49% |
The heat map shows percentage changes of major currencies against each other. The base currency is picked from the left column, while the quote currency is picked from the top row. For example, if you pick the Euro from the left column and move along the horizontal line to the Japanese Yen, the percentage change displayed in the box will represent EUR (base)/JPY (quote).
With the immediate reaction to the news, crude oil prices shot higher. After reaching a daily high of $85.58 during the Asian trading hours, the barrel of West Texas Intermediate (WTI) erased a large portion of its gains and was last seen rising 1.6% on the day at $83.15.
Gold spiked above $2,410 following the reports but returned to the $2,380 area into the European morning.
EUR/USD turned south and came within a touching distance of 1.0600 early Friday. The pair managed to erase its losses and was last seen trading flat on the day, slightly below 1.0650.
GBP/USD slumped to its weakest level since November below 1.2400 in the Asian session. The pair reversed its direction and recovered toward 1.2430 heading into the European session. The UK's Office for National Statistics reported on Friday that Retail Sales grew 0.8% on a yearly basis in March following the 0.3% contraction recorded in February.
During the Asian trading hours, the data from Japan showed that the National Consumer Price Index (CPI) rose 2.7% on a yearly basis in March, down slightly from the 2.8% increase recorded in February. This reading came in line with the market expectation. In the meantime, Bank of Japan (BoJ) Governor Kazuo Ueda said that they may raise interest rates again if the Yen's declines considerably increase inflation, highlighting the impact currency moves may have on the timing of the next policy shift. After falling sharply toward 153.50 earlier in the day, USD/JPY retraced its decline and was last seen trading virtually unchanged on the day near 154.50.
Risk sentiment FAQs
In the world of financial jargon the two widely used terms “risk-on” and “risk off'' refer to the level of risk that investors are willing to stomach during the period referenced. In a “risk-on” market, investors are optimistic about the future and more willing to buy risky assets. In a “risk-off” market investors start to ‘play it safe’ because they are worried about the future, and therefore buy less risky assets that are more certain of bringing a return, even if it is relatively modest.
Typically, during periods of “risk-on”, stock markets will rise, most commodities – except Gold – will also gain in value, since they benefit from a positive growth outlook. The currencies of nations that are heavy commodity exporters strengthen because of increased demand, and Cryptocurrencies rise. In a “risk-off” market, Bonds go up – especially major government Bonds – Gold shines, and safe-haven currencies such as the Japanese Yen, Swiss Franc and US Dollar all benefit.
The Australian Dollar (AUD), the Canadian Dollar (CAD), the New Zealand Dollar (NZD) and minor FX like the Ruble (RUB) and the South African Rand (ZAR), all tend to rise in markets that are “risk-on”. This is because the economies of these currencies are heavily reliant on commodity exports for growth, and commodities tend to rise in price during risk-on periods. This is because investors foresee greater demand for raw materials in the future due to heightened economic activity.
The major currencies that tend to rise during periods of “risk-off” are the US Dollar (USD), the Japanese Yen (JPY) and the Swiss Franc (CHF). The US Dollar, because it is the world’s reserve currency, and because in times of crisis investors buy US government debt, which is seen as safe because the largest economy in the world is unlikely to default. The Yen, from increased demand for Japanese government bonds, because a high proportion are held by domestic investors who are unlikely to dump them – even in a crisis. The Swiss Franc, because strict Swiss banking laws offer investors enhanced capital protection.
- GBP/JPY loses momentum around 191.65, down 0.31% on the day.
- The UK Retail Sales came in at 0% MoM in March from a 0.1% rise in the previous reading, weaker than expected.
- The report that an Israeli missile has hit Iran lift the Japanese Yen against the Pound Sterling.
The GBP/JPY cross edges lower to 191.72 during the early European session on Friday. The downbeat UK Retail Sales weigh on the Pound Sterling (GBP). Additionally, the rising tension between Israel and Iran heightens concerns of a wider conflict in the Middle East, providing some support to safe-haven currencies like the Japanese Yen (JPY) and creating a headwind for the GBP/JPY cross.
The latest data from the Office for National Statistics showed on Friday that UK Retail Sales arrived at 0% MoM in March from a 0.1% rise in the previous reading, weaker than the market expectation of 0.3%. Meanwhile, the Retail Sales ex-fuel dropped by 0.3% MoM, compared with a 0.3% increase in February. In response to the UK Retail Sales figures, The Pound Sterling (GBP) remains under selling pressure against the JPY.
On the other hand, Bank of Japan (BoJ) board member Asahi Noguchi said on Thursday that the “main scenario is that future rate hikes are likely to be slow, but that depends on economic data, while BoJ Governor Kazuo Ueda said that the Japanese central bank may raise interest rates again if the Yen's declines considerably increase inflation. Ueda further stated that the impact of FX moves might affect the timing of the next policy shift.
Early Friday, US officials told CBS News that an Israeli missile had hit Iran. Blasts were reported in the central province of Isfahan, however, it is unclear what was targeted. Iran is on high alert after Israel said that it would retaliate to an Iranian strike on Saturday night. The escalating tensions between Israel and Iran could boost the safe-haven flow demand and continue to lift the JPY.
FX option expiries for Apr 19 NY cut at 10:00 Eastern Time, via DTCC, can be found below
- EUR/USD: EUR amounts
- 1.0500 575m
- 1.0570 618m
- 1.0600 650m
- 1.0640 1b
- 1.0645 905m
- 1.0675 625m
- USD/JPY: USD amounts
- 155.00 2b
- AUD/USD: AUD amounts
- 0.6400 467m
- 0.6415 900m
- 0.6420 472m
- USD/CAD: USD amounts
- 1.3700 1.8b
- 1.3775 789m
- 1.3820 514m
- The UK Retail Sales arrived at 0% MoM in March, miss estimates.
- Core Retail Sales for the UK drops 0.3% MoM in March.
- GBP/USD stays weak near 1.2400 after mixed UK data.
The UK Retail Sales came in at 0% over the month in March vs. 0.3% expected and 0.1% in February, the latest data published by the Office for National Statistics (ONS) showed Friday.
The Core Retail Sales, stripping the auto motor fuel sales, dropped by 0.3% MoM, compared with a 0.3% growth in February.
The annual Retail Sales in the United Kingdom rebounded by 0.8% in March versus February’s -0.3% while the Core Retail Sales increased by 0.4% in the reported month versus -0.4% previous.
Market reaction to UK Retail Sales report
GBP/USD maintains the offered near 1.2400 after the UK Retail Sales data. The spot is trading 0.22% lower on the day.
Pound Sterling price today
The table below shows the percentage change of Pound Sterling (GBP) against listed major currencies today. Pound Sterling was the weakest against the Swiss Franc.
| USD | EUR | GBP | CAD | AUD | JPY | NZD | CHF | |
| USD | 0.13% | 0.25% | 0.13% | 0.46% | -0.20% | 0.42% | -0.49% | |
| EUR | -0.13% | 0.13% | 0.00% | 0.33% | -0.31% | 0.29% | -0.54% | |
| GBP | -0.25% | -0.13% | -0.12% | 0.21% | -0.44% | 0.17% | -0.67% | |
| CAD | -0.13% | 0.00% | 0.12% | 0.33% | -0.32% | 0.29% | -0.54% | |
| AUD | -0.46% | -0.33% | -0.17% | -0.33% | -0.65% | -0.03% | -0.87% | |
| JPY | 0.18% | 0.33% | 0.42% | 0.31% | 0.65% | 0.60% | -0.22% | |
| NZD | -0.41% | -0.28% | -0.15% | -0.28% | 0.05% | -0.61% | -0.82% | |
| CHF | 0.40% | 0.53% | 0.66% | 0.53% | 0.86% | 0.21% | 0.82% |
The heat map shows percentage changes of major currencies against each other. The base currency is picked from the left column, while the quote currency is picked from the top row. For example, if you pick the Euro from the left column and move along the horizontal line to the Japanese Yen, the percentage change displayed in the box will represent EUR (base)/JPY (quote).
- NZD/USD attracts some sellers near 0.5880 on the renewed USD demand on Friday.
- US officials revealed that Israel carried out military strikes against Iran, boosting safe-haven currencies like the USD.
- The annual inflation rate in New Zealand remains above the central bank target range, keeping the RBNZ holding rates longer.
The NZD/USD pair remains under selling pressure around 0.5880 on Friday during the early European session. The risk-off environment amid the escalating tension between Israel and Iran lifts the Greenback and weighs on NZD/USD. Meanwhile, the US Dollar Index (DXY) edges higher above 106.20, nearly the highest level since November 2023.
US officials revealed that Israel carried out military strikes against Iran. The officials said Israel told the Biden administration early on Thursday that an attack would be launched within the next 24 to 48 hours. Israeli officials informed the US that Iran's nuclear facilities would not be targeted, according to CNN. Investors will monitor the developments surrounding geopolitical tensions in the Middle East. The turmoil and conflict in this region could boost safe-haven flows, benefiting the US Dollar.
Apart from this, the higher possibility that the US Federal Reserve (Fed) might delay interest rate cuts further provides some support to the USD. Several Fed officials agreed that US inflation remains high and that the US central bank needs more confidence in its trajectory.
On the Kiwi front, data released from Statistics New Zealand showed that the nation’s inflation has continued to fall. However, it remains above the Reserve Bank of New Zealand’s (RBNZ) target range of 1 to 3%. This might convince the RBNZ to keep the interest rate high for longer, which might help the New Zealand Dollar (NZD) to limit its losses.
- USD/CAD surrenders some of its intraday gains as Iranian media denies any foreign attack on its cities.
- The higher WTI price provides support for the Canadian Dollar.
- The Greenback gained traction after Fed officials conveyed hawkish messages on Thursday.
USD/CAD pares its intraday gains, trading around 1.3780 during the Asian session on Friday. However, the pair received upward support as the safe-haven US Dollar (USD) gained traction following news of Israeli missiles striking a site in Iran, exacerbating tensions in the Middle East. However, Iranian media has refuted reports of a foreign attack on Iranian cities, including Isfahan.
According to Reuters, citing Iran’s Fars News Agency, locals reported hearing explosions at the central Isfahan airport. However, the cause of these explosions remains unknown.
The Canadian Dollar receives some support from the higher crude Oil prices, given the fact that Canada is the largest Oil exporter to the United States (US). Western Texas Intermediate (WTI), the US crude oil benchmark, trades around $83.80, by the press time. The prices of crude Oil appreciated as US officials confirmed that Israeli missiles had hit a site in Iran.
On the US Dollar's front, Federal Reserve (Fed) officials conveyed hawkish messages on Thursday, leading to a surge in US Treasury yields and the US Dollar, consequently, underpinning the USD/CAD pair.
Traders are expected to closely monitor Atlanta Fed President Raphael Bostic, who will speak regarding the US economic outlook at the University of Miami, Florida. Additionally, Chicago Fed President Austan Goolsbee will participate in a moderated Q&A session at the Association for Business Journalists 2024 SABEW Annual Conference in Chicago.
- The Australian Dollar loses ground on heightened risk aversion as Israeli missiles struck a site in Iran.
- Australia’s equity market falls to a two-month low of 7,489 on Friday.
- The US Dollar gains ground after hawkish remarks from Fed officials made on Thursday.
The Australian Dollar (AUD) extends losses for the second consecutive day on Friday, as riskier assets face pressure due to heightened risk aversion across financial markets. This sentiment intensified following confirmation from ABC News that Israeli missiles had struck a site in Iran, exacerbating tensions in the Middle East.
The Australian Dollar (AUD) faces challenges alongside a decline in the ASX 200 Index on Friday, nearing its two-month low of 7,489. This trend was influenced by weak cues from Wall Street overnight. Additionally, Australia’s 10-year government bond yield fell below 4.3%, retracting from over four-month highs, as investors anticipated a dovish outlook from the Reserve Bank of Australia (RBA) regarding monetary policy.
The US Dollar Index (DXY), which measures the US Dollar (USD) against six major currencies, advances amid heightened concerns over the potential escalation of the Israel-Gaza conflict in the Middle East. This has attracted investors seeking safe-haven assets. Furthermore, hawkish remarks from Federal Reserve (Fed) officials on Thursday triggered a surge in US Treasury yields and the US Dollar, subsequently exerting downward pressure on the AUD/USD pair.
Traders are expected to closely monitor upcoming speeches from Federal Reserve officials. Atlanta Fed President Raphael Bostic is set to partake in a moderated discussion regarding the US economic outlook at the University of Miami, Florida. Additionally, Chicago Fed President Austan Goolsbee is anticipated to participate in a moderated Q&A session at the Association for Business Journalists 2024 SABEW Annual Conference in Chicago.
Daily Digest Market Movers: Australian Dollar depreciates on risk aversion, dovish RBA’s outlook
- According to Reuters, citing Iran’s Fars News Agency, locals reported hearing explosions at the central Isfahan airport. However, the cause of these explosions remains unknown. Investigations are underway to ascertain the precise details of the incident.
- Atlanta Fed President Raphael Bostic highlighted that US inflation is excessively high and emphasized that the Fed still needs to make progress on addressing inflation. Meanwhile, New York Fed President John Williams stressed the Fed's commitment to being data-dependent and expressed that he does not currently perceive an immediate need to lower interest rates.
- US Initial Jobless Claims reported a figure of 212,000 for the week ending on April 12, compared to the expected 215,000.
- US Philadelphia Fed Manufacturing Survey showed an improvement in the manufacturing sector trends with a higher reading of 15.5 for April, exceeding the expected 1.5 and 3.2 prior.
- US Existing Home Sales Change (MoM) reduced by 4.3% in March, swinging from the previous increase of 9.5%.
- Australia’s Employment Change posted a reading of -6.6K for March, against the expected 7.2K and 117.6K prior. Unemployment Rate rose to 3.8% in March, lower than the expected 3.9% but higher than the previous reading of 3.7%.
Technical Analysis: Australian Dollar falls below the psychological level of 0.6400
The Australian Dollar trades around 0.6390 on Friday. The latest break below the descending channel on the daily chart denotes a strengthening of the bearish bias. Additionally, the 14-day Relative Strength Index (RSI) suggests a bearish sentiment for the AUD/USD pair as it remains below the 50 level. Notable support is identified at the major level of 0.6350, following the psychological level of 0.6300. On the upside, immediate resistance for the AUD/USD pair is anticipated at the psychological level of 0.6400. A breakthrough above the latte could lead the pair to explore the region around the major level of 0.6450 and the nine-day Exponential Moving Average (EMA) at 0.6455.
AUD/USD: Daily Chart
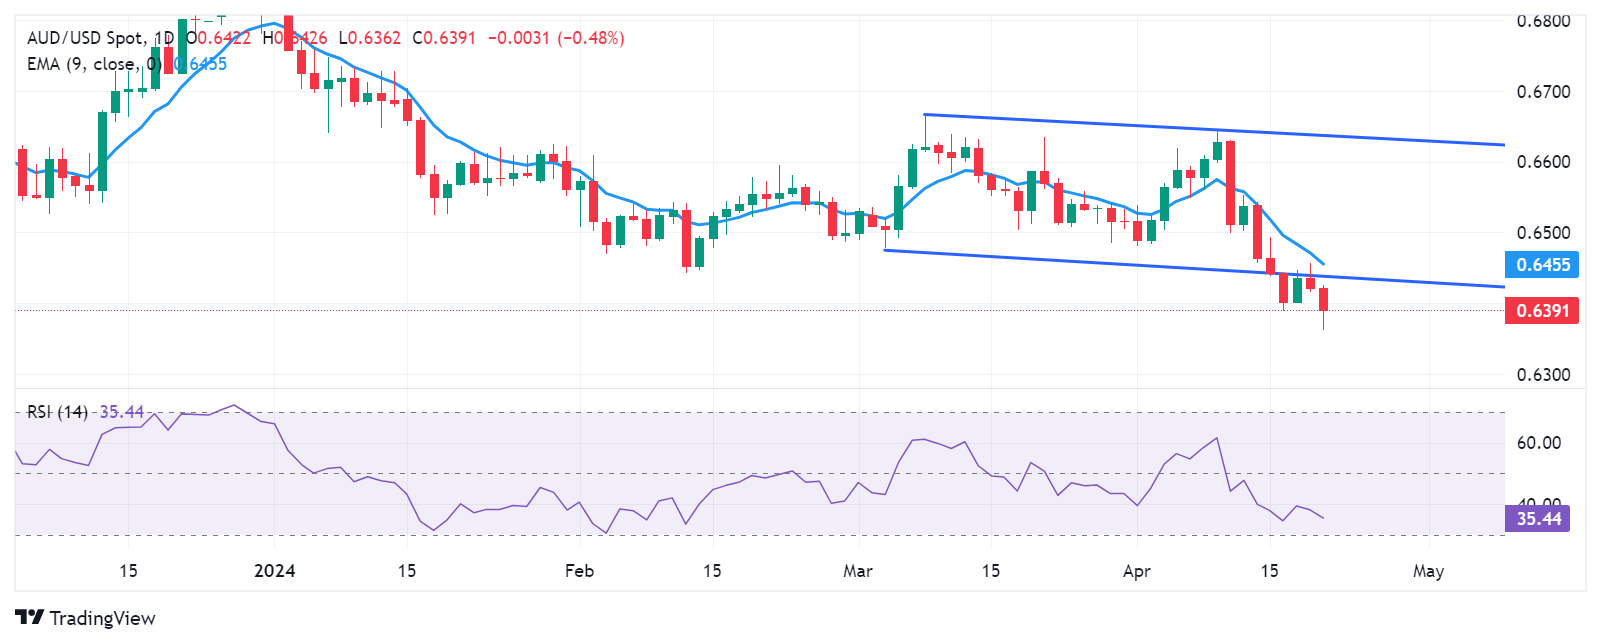
Australian Dollar price today
The table below shows the percentage change of Australian Dollar (AUD) against listed major currencies today. Australian Dollar was the weakest against the Swiss Franc.
| USD | EUR | GBP | CAD | AUD | JPY | NZD | CHF | |
| USD | 0.05% | 0.11% | 0.05% | 0.44% | -0.17% | 0.38% | -0.52% | |
| EUR | -0.05% | 0.08% | 0.00% | 0.40% | -0.19% | 0.30% | -0.54% | |
| GBP | -0.11% | -0.06% | -0.06% | 0.33% | -0.28% | 0.23% | -0.63% | |
| CAD | -0.03% | 0.02% | 0.08% | 0.41% | -0.19% | 0.35% | -0.55% | |
| AUD | -0.49% | -0.45% | -0.38% | -0.45% | -0.66% | -0.11% | -1.01% | |
| JPY | 0.15% | 0.23% | 0.29% | 0.20% | 0.61% | 0.53% | -0.35% | |
| NZD | -0.38% | -0.31% | -0.23% | -0.31% | 0.10% | -0.50% | -0.85% | |
| CHF | 0.51% | 0.57% | 0.62% | 0.56% | 0.95% | 0.34% | 0.85% |
The heat map shows percentage changes of major currencies against each other. The base currency is picked from the left column, while the quote currency is picked from the top row. For example, if you pick the Euro from the left column and move along the horizontal line to the Japanese Yen, the percentage change displayed in the box will represent EUR (base)/JPY (quote).
Australian Dollar FAQs
One of the most significant factors for the Australian Dollar (AUD) is the level of interest rates set by the Reserve Bank of Australia (RBA). Because Australia is a resource-rich country another key driver is the price of its biggest export, Iron Ore. The health of the Chinese economy, its largest trading partner, is a factor, as well as inflation in Australia, its growth rate and Trade Balance. Market sentiment – whether investors are taking on more risky assets (risk-on) or seeking safe-havens (risk-off) – is also a factor, with risk-on positive for AUD.
The Reserve Bank of Australia (RBA) influences the Australian Dollar (AUD) by setting the level of interest rates that Australian banks can lend to each other. This influences the level of interest rates in the economy as a whole. The main goal of the RBA is to maintain a stable inflation rate of 2-3% by adjusting interest rates up or down. Relatively high interest rates compared to other major central banks support the AUD, and the opposite for relatively low. The RBA can also use quantitative easing and tightening to influence credit conditions, with the former AUD-negative and the latter AUD-positive.
China is Australia’s largest trading partner so the health of the Chinese economy is a major influence on the value of the Australian Dollar (AUD). When the Chinese economy is doing well it purchases more raw materials, goods and services from Australia, lifting demand for the AUD, and pushing up its value. The opposite is the case when the Chinese economy is not growing as fast as expected. Positive or negative surprises in Chinese growth data, therefore, often have a direct impact on the Australian Dollar and its pairs.
Iron Ore is Australia’s largest export, accounting for $118 billion a year according to data from 2021, with China as its primary destination. The price of Iron Ore, therefore, can be a driver of the Australian Dollar. Generally, if the price of Iron Ore rises, AUD also goes up, as aggregate demand for the currency increases. The opposite is the case if the price of Iron Ore falls. Higher Iron Ore prices also tend to result in a greater likelihood of a positive Trade Balance for Australia, which is also positive of the AUD.
The Trade Balance, which is the difference between what a country earns from its exports versus what it pays for its imports, is another factor that can influence the value of the Australian Dollar. If Australia produces highly sought after exports, then its currency will gain in value purely from the surplus demand created from foreign buyers seeking to purchase its exports versus what it spends to purchase imports. Therefore, a positive net Trade Balance strengthens the AUD, with the opposite effect if the Trade Balance is negative.
- Indian Rupee weakens on Friday due to geopolitical tension risks, renewed USD demand.
- The fear of a wider conflict between Israel and Iran exerts some selling pressure on the INR.
- Investors await the RBI Monetary Policy Committee (MPC) Meeting Minutes, which are due on Friday.
Indian Rupee (INR) trades on a weaker note on Friday amid geopolitical fears and foreign fund outflows. The escalating tension between Israel and Iran heightens concerns of a wider conflict in the Middle East, triggering the fear of oil supply disruption. Higher oil prices hurt the INR, as India is the third-largest consumer and importer of crude oil. Furthermore, the higher demand for the US dollar (USD) on safe-haven appeal might lift the pair.
However, the USD/INR’s potential upside is limited as the Reserve Bank of India (RBI) is likely to intervene in the foreign exchange (FX) market to prevent the volatility of local currency. Investors will monitor the RBI Monetary Policy Committee (MPC) Meeting Minutes on Friday. Also, Chicago Fed Austan Goolsbee is set to speak.
Daily Digest Market Movers: The Indian Rupee remains vulnerable amid Middle East tensions
- Trimming trade deficit, expectations of USD inflows in debt markets, and strong growth momentum have been supportive for the INR,” said Dilip Parmar, Research Analyst, HDFC Securities.
- Israeli missiles attacked a site target in Iran, ABC News said late Thursday, citing a US source, while Iranian state media claimed an explosion in the country's center days after Iran carried out a retaliatory drone strike on Israel.
- The International Monetary Fund (IMF) raised India’s GDP growth forecast for 2024–25 to 6.8% in its update to the World Economic Outlook (WEO).
- The US Initial Jobless Claims for the week ending April 13 increased below market consensus, rising by 212,000 from the previous weekly gain of 212K (revised from 211K).
- The Philadelphia Fed Manufacturing Index jumped to 15.5 in April from 3.2 in March, beating the estimation of 1.5. The US Existing Home Sales dropped by 4.3% MoM to 4.19 million from 4.38 million, worse than the anticipated 4.2 million.
- Atlanta Fed President Raphael Bostic said US inflation is expected to return to the 2% target at a slower pace than many had anticipated, adding that he’s comfortable being patient and that rate cuts are likely by year-end.
- New York Fed President John Williams said that he doesn't feel an urgency to cut rates and that monetary policy is in a good place.
Technical analysis: USD/INR maintains a bullish outlook
The Indian Rupee trades weaker on the day. USD/INR keeps the bullish stance unchanged as the pair is above the key 100-day Exponential Moving Average (EMA) on the daily timeframe. The upward momentum is confirmed by the 14-day Relative Strength Index (RSI), which hovers around 65.00, suggesting that support zones are more likely to hold than to break.
The first upside barrier of the pair will emerge near an all-time high of 83.72. A decisive break above this level will pave the way to the 84.00 psychological round figure. On the other hand, a low of April 18 at 83.50 acts as an initial support level, followed by a low of April 12 at 83.30. A downside break below the 100-day EMA at 83.12 might spark a sharp decline.
US Dollar price today
The table below shows the percentage change of US Dollar (USD) against listed major currencies today. US Dollar was the strongest against the .
| USD | EUR | GBP | CAD | AUD | JPY | NZD | CHF | |
| USD | 0.08% | 0.16% | 0.09% | 0.56% | -0.23% | 0.46% | -0.56% | |
| EUR | -0.08% | 0.08% | 0.00% | 0.47% | -0.31% | 0.38% | -0.64% | |
| GBP | -0.15% | -0.08% | -0.07% | 0.40% | -0.38% | 0.30% | -0.73% | |
| CAD | -0.10% | 0.00% | 0.07% | 0.47% | -0.31% | 0.37% | -0.65% | |
| AUD | -0.55% | -0.48% | -0.39% | -0.47% | -0.78% | -0.09% | -1.13% | |
| JPY | 0.21% | 0.30% | 0.34% | 0.34% | 0.79% | 0.66% | -0.33% | |
| NZD | -0.46% | -0.38% | -0.29% | -0.37% | 0.11% | -0.69% | -1.02% | |
| CHF | 0.57% | 0.64% | 0.72% | 0.65% | 1.11% | 0.33% | 1.02% |
The heat map shows percentage changes of major currencies against each other. The base currency is picked from the left column, while the quote currency is picked from the top row. For example, if you pick the Euro from the left column and move along the horizontal line to the Japanese Yen, the percentage change displayed in the box will represent EUR (base)/JPY (quote).
Indian Rupee FAQs
The Indian Rupee (INR) is one of the most sensitive currencies to external factors. The price of Crude Oil (the country is highly dependent on imported Oil), the value of the US Dollar – most trade is conducted in USD – and the level of foreign investment, are all influential. Direct intervention by the Reserve Bank of India (RBI) in FX markets to keep the exchange rate stable, as well as the level of interest rates set by the RBI, are further major influencing factors on the Rupee.
The Reserve Bank of India (RBI) actively intervenes in forex markets to maintain a stable exchange rate, to help facilitate trade. In addition, the RBI tries to maintain the inflation rate at its 4% target by adjusting interest rates. Higher interest rates usually strengthen the Rupee. This is due to the role of the ‘carry trade’ in which investors borrow in countries with lower interest rates so as to place their money in countries’ offering relatively higher interest rates and profit from the difference.
Macroeconomic factors that influence the value of the Rupee include inflation, interest rates, the economic growth rate (GDP), the balance of trade, and inflows from foreign investment. A higher growth rate can lead to more overseas investment, pushing up demand for the Rupee. A less negative balance of trade will eventually lead to a stronger Rupee. Higher interest rates, especially real rates (interest rates less inflation) are also positive for the Rupee. A risk-on environment can lead to greater inflows of Foreign Direct and Indirect Investment (FDI and FII), which also benefit the Rupee.
Higher inflation, particularly, if it is comparatively higher than India’s peers, is generally negative for the currency as it reflects devaluation through oversupply. Inflation also increases the cost of exports, leading to more Rupees being sold to purchase foreign imports, which is Rupee-negative. At the same time, higher inflation usually leads to the Reserve Bank of India (RBI) raising interest rates and this can be positive for the Rupee, due to increased demand from international investors. The opposite effect is true of lower inflation.
- Gold price rises as risk aversion intensifies following reports of Israeli missiles striking a site in Iran.
- Iran’s Fars News Agency reported explosions at the central Isfahan airport.
- The gains in the US Dollar could limit the advance of the Gold prices.
Gold price surges to nearly $2,410 per troy ounce during the Asian session on Friday. The safe-haven yellow metal gains ground as risk aversion sweeps across the financial markets following confirmation from ABC News that Israeli missiles struck a site in Iran, exacerbating tensions in the Middle East.
According to Reuters, citing Iran’s Fars News Agency, locals reported hearing explosions at the central Isfahan airport. However, the cause of these explosions remains unknown. Investigations are ongoing to determine the exact details of the incident.
On the US Dollar's front, Federal Reserve (Fed) officials conveyed hawkish messages on Thursday, leading to a surge in US Treasury yields and the Greenback, consequently curtailing the upward momentum of non-yielding assets like Gold. The stronger USD renders bullion more expensive for holders of other currencies.
Atlanta Fed President Raphael Bostic highlighted that US inflation is excessively high and emphasized that the Fed still needs to make progress on addressing inflation. Meanwhile, New York Fed President John Williams stressed the Fed's commitment to being data-dependent and expressed that he does not currently perceive an immediate need to lower interest rates.
| Raw materials | Closed | Change, % |
|---|---|---|
| Silver | 28.225 | 0.02 |
| Gold | 2377.02 | 0.53 |
| Palladium | 1021.14 | -0.85 |
- WTI snaps the three-day winning streak near $85.00 on Friday.
- Israel retaliates as missiles strike a site in Iran, boosting the black gold price.
- The expectation that the US Fed will delay interest rate cuts to September might cap the WTI’s upside.
Western Texas Intermediate (WTI), the US crude oil benchmark, is trading around $85.00 on Friday. The black gold gains traction on the day amid the escalating tension between Israel and Iran after a US official confirmed that Israeli missiles had hit a site in Iran.
On Friday, ABC News reported that explosions were heard at an airport in the Iranian city of Isfahan but the cause was not immediately known. Several flights were diverted over Iranian airspace. Over the weekend, Iran unleashed hundreds of drones and missiles in retaliation for a purported Israeli raid on its Syrian embassy building. The tension between Israel and Iran heightened concerns of a wider conflict in the Middle East, triggering the fear of oil supply disruption.
On the other hand, several Fed officials have made hawkish comments in recent days. Atlanta Fed President Raphael Bostic said that US inflation is too high and Fed still has a way to go on inflation, while New York Fed President John Williams emphasized that the Fed is data dependent and he doesn't feel an urgency to cut rates. Earlier this week, Fed Cleveland President Loretta Mester said that inflation is higher than expected and the central bank needs more confidence in its trajectory.
Risk-aversion is in full swing across the financial markets after ABC News confirmed reports that Israeli missiles struck a site in Iran, leading to further escalation in the Middle East geopolitical tensions.
Reuters reported, citing Iran’s Fars News Agency, that locals heard explosions in central Isfahan airport; although the reason for the explosions is unknown.
"The cause of these sounds is still unknown, and investigations continue until the exact details of the incident are determined," the semi-official Fars news agency said.
Earlier, reports came in, citing that a radar battalion hit in Syria near the city of Izraa. Another chatter was that there were 'explosions' near the city of Isfahan in central Iran. Finally, speculations over warplane activity across parts of Iraq hit wires.
On Thursday, Iranian Foreign Minister Hossein Amir-Abdollahian warned in an exclusive CNN interview that “in case the Israeli regime embarks on adventurism again and takes action against the interests of Iran, the next response from us will be immediate and at a maximum level.”
Markets are concerned about a further escalation in clashes across Israel's northern border, especially amidst the ongoing tensions in Gaza.
Market reaction
The risk barometer, S&P 500 futures, slide 1.25% while the ultimate safe-haven – Gold price jump back toward record highs of $2,432. The US Dollar Index sits at intraday highs near 106.30.
WTI, the US oil, jumps over 3% to near $85 on Middle East war fears.
Risk sentiment FAQs
In the world of financial jargon the two widely used terms “risk-on” and “risk off'' refer to the level of risk that investors are willing to stomach during the period referenced. In a “risk-on” market, investors are optimistic about the future and more willing to buy risky assets. In a “risk-off” market investors start to ‘play it safe’ because they are worried about the future, and therefore buy less risky assets that are more certain of bringing a return, even if it is relatively modest.
Typically, during periods of “risk-on”, stock markets will rise, most commodities – except Gold – will also gain in value, since they benefit from a positive growth outlook. The currencies of nations that are heavy commodity exporters strengthen because of increased demand, and Cryptocurrencies rise. In a “risk-off” market, Bonds go up – especially major government Bonds – Gold shines, and safe-haven currencies such as the Japanese Yen, Swiss Franc and US Dollar all benefit.
The Australian Dollar (AUD), the Canadian Dollar (CAD), the New Zealand Dollar (NZD) and minor FX like the Ruble (RUB) and the South African Rand (ZAR), all tend to rise in markets that are “risk-on”. This is because the economies of these currencies are heavily reliant on commodity exports for growth, and commodities tend to rise in price during risk-on periods. This is because investors foresee greater demand for raw materials in the future due to heightened economic activity.
The major currencies that tend to rise during periods of “risk-off” are the US Dollar (USD), the Japanese Yen (JPY) and the Swiss Franc (CHF). The US Dollar, because it is the world’s reserve currency, and because in times of crisis investors buy US government debt, which is seen as safe because the largest economy in the world is unlikely to default. The Yen, from increased demand for Japanese government bonds, because a high proportion are held by domestic investors who are unlikely to dump them – even in a crisis. The Swiss Franc, because strict Swiss banking laws offer investors enhanced capital protection.
The People’s Bank of China (PBoC) set the USD/CNY central rate for the trading session ahead on Friday at 7.1046 as compared to the previous day's of 7.1020.
- AUD/JPY depreciates after the release of Japan’s inflation figures released on Friday.
- The Japanese Yen gains support from the hawkish remarks made by BoJ Governor Kazuo Ueda on Thursday.
- The Australian Dollar loses ground as soft domestic jobs data reinforced a dovish outlook on RBA’s monetary policy.
AUD/JPY continues to decline for the second consecutive session following the release of Japan's inflation data on Friday. The National Consumer Price Index (CPI) for March rose by 2.7% year-over-year, compared to a 2.8% increase in February, according to the latest data from the Japan Statistics Bureau. This index assesses the price fluctuations of goods and services bought by households.
The Japanese Yen (JPY) receives upward support from the hawkish remarks made by Bank of Japan’s (BoJ) Governor Kazuo Ueda on Thursday. According to a Reuters report, Ueda mentioned in a press conference that the central bank might consider raising interest rates again if significant declines in the Yen substantially boost inflation. This underscores the influence that currency movements could have on the timing of the next policy shift.
The Australian Dollar (AUD) experienced losses, along with a decline in the ASX 200 Index on Friday. Additionally, Australia’s 10-year government bond yield dropped below 4.3%, stepping back from over four-month highs. This retreat was attributed to soft domestic jobs data, which reinforced a dovish outlook on the Reserve Bank of Australia’s (RBA) monetary policy.
Daily Digest Market Movers: AUD/JPY depreciates on dovish RBA’s outlook
- Japan’s National CPI, excluding fresh food but including fuel costs, increased 2.6% year-over-year in February, decelerating from a four-month high of 2.8% in January and falling below forecasts of 2.7%. The slowdown was attributed to mild increases in food prices, although it remained above the Bank of Japan’s 2% target due to the weakness of the Yen and high commodity prices.
- Bank of Japan board member Asahi Noguchi stated on Thursday that the pace of future rate hikes would probably be much slower than that of its global counterparts in recent policy tightening. This is because the impact of rising domestic wages has yet to be fully transmitted to prices, as reported by Reuters.
- Analysts at Rabobank suggested that stronger Japanese economic data, coupled with stronger expectations that the Bank of Japan (BoJ) may raise rates again later this year, would likely provide the Japanese Yen (JPY) with broad-based strength. They posit that if Japanese real household incomes turn positive later this year, there is a possibility of another BoJ rate hike.
- On Thursday, Australia’s Employment Change posted a reading of -6.6K for March, against the expected 7.2K and 117.6K prior. Australia’s Unemployment Rate rose to 3.8% in March, lower than the expected 3.9% but higher than the previous reading of 3.7%.
- According to a Westpac report, while the central bank signaled that rates are unlikely to be raised further, it requires greater confidence in the inflation outlook before contemplating the possibility of rate cuts.
Technical Analysis: AUD/JPY drops to the support level of 98.00
The AUD/JPY trades around 98.20 on Friday. The breach below the significant support level of 98.65, coupled with the 14-day Relative Strength Index (RSI) persisting below the 50 level, indicates a bearish sentiment for the pair. The AUD/JPY cross could find immediate support at the psychological level of 98.00. A break below this level could lead the pair to approach the major level of 97.50. On the upside, the major level of 98.50 appears as the barrier, followed by the 50-day Exponential Moving Average (EMA). A breakthrough above the latter could support the AUD/JPY cross to explore the region around the psychological level of 99.00.
AUD/JPY: Daily Chart
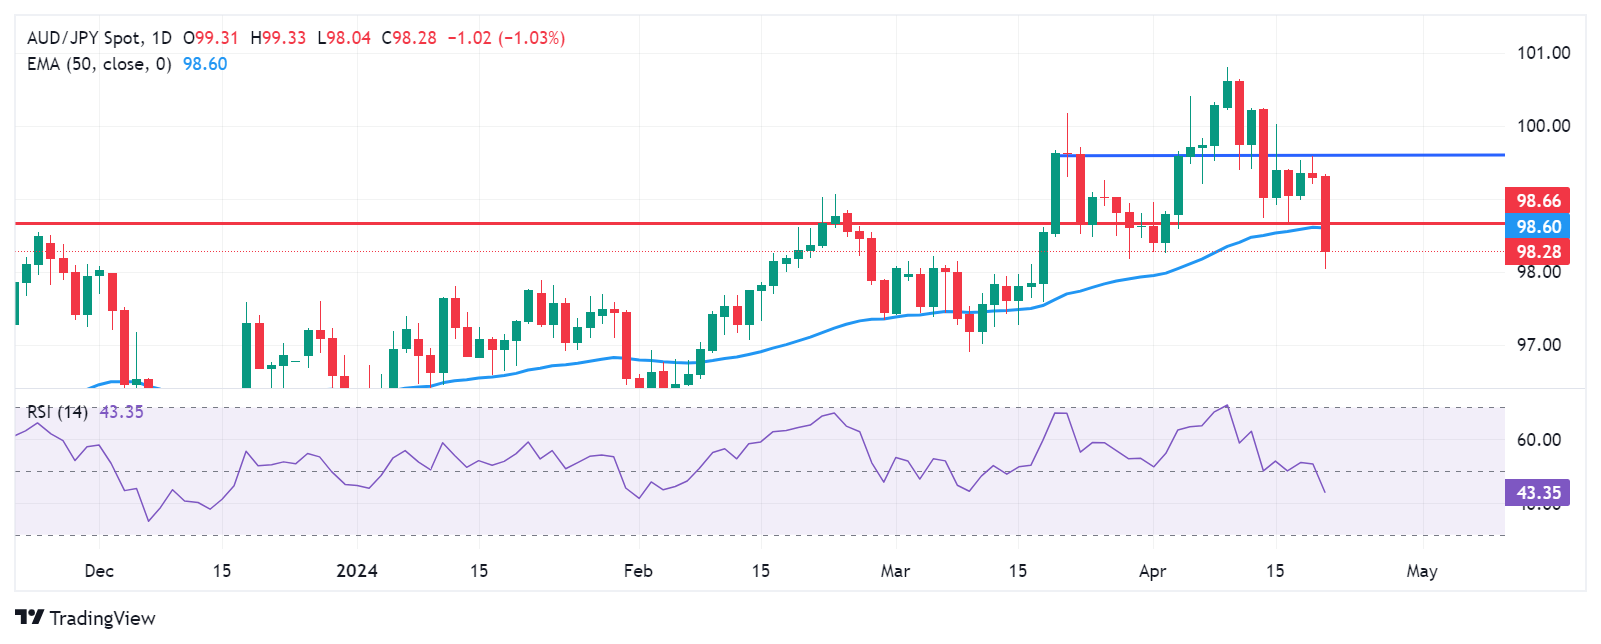
Australian Dollar price today
The table below shows the percentage change of Australian Dollar (AUD) against listed major currencies today. Australian Dollar was the weakest against the Swiss Franc.
| USD | EUR | GBP | CAD | AUD | JPY | NZD | CHF | |
| USD | 0.20% | 0.24% | 0.14% | 0.69% | -0.27% | 0.57% | -0.52% | |
| EUR | -0.20% | 0.04% | -0.05% | 0.49% | -0.41% | 0.37% | -0.71% | |
| GBP | -0.24% | -0.04% | -0.10% | 0.45% | -0.50% | 0.33% | -0.76% | |
| CAD | -0.14% | 0.06% | 0.09% | 0.55% | -0.40% | 0.43% | -0.66% | |
| AUD | -0.69% | -0.49% | -0.45% | -0.56% | -0.96% | -0.12% | -1.27% | |
| JPY | 0.22% | 0.44% | 0.45% | 0.36% | 0.92% | 0.79% | -0.29% | |
| NZD | -0.57% | -0.38% | -0.33% | -0.43% | 0.12% | -0.80% | -1.07% | |
| CHF | 0.52% | 0.72% | 0.75% | 0.66% | 1.20% | 0.26% | 1.09% |
The heat map shows percentage changes of major currencies against each other. The base currency is picked from the left column, while the quote currency is picked from the top row. For example, if you pick the Euro from the left column and move along the horizontal line to the Japanese Yen, the percentage change displayed in the box will represent EUR (base)/JPY (quote).
Australian Dollar FAQs
One of the most significant factors for the Australian Dollar (AUD) is the level of interest rates set by the Reserve Bank of Australia (RBA). Because Australia is a resource-rich country another key driver is the price of its biggest export, Iron Ore. The health of the Chinese economy, its largest trading partner, is a factor, as well as inflation in Australia, its growth rate and Trade Balance. Market sentiment – whether investors are taking on more risky assets (risk-on) or seeking safe-havens (risk-off) – is also a factor, with risk-on positive for AUD.
The Reserve Bank of Australia (RBA) influences the Australian Dollar (AUD) by setting the level of interest rates that Australian banks can lend to each other. This influences the level of interest rates in the economy as a whole. The main goal of the RBA is to maintain a stable inflation rate of 2-3% by adjusting interest rates up or down. Relatively high interest rates compared to other major central banks support the AUD, and the opposite for relatively low. The RBA can also use quantitative easing and tightening to influence credit conditions, with the former AUD-negative and the latter AUD-positive.
China is Australia’s largest trading partner so the health of the Chinese economy is a major influence on the value of the Australian Dollar (AUD). When the Chinese economy is doing well it purchases more raw materials, goods and services from Australia, lifting demand for the AUD, and pushing up its value. The opposite is the case when the Chinese economy is not growing as fast as expected. Positive or negative surprises in Chinese growth data, therefore, often have a direct impact on the Australian Dollar and its pairs.
Iron Ore is Australia’s largest export, accounting for $118 billion a year according to data from 2021, with China as its primary destination. The price of Iron Ore, therefore, can be a driver of the Australian Dollar. Generally, if the price of Iron Ore rises, AUD also goes up, as aggregate demand for the currency increases. The opposite is the case if the price of Iron Ore falls. Higher Iron Ore prices also tend to result in a greater likelihood of a positive Trade Balance for Australia, which is also positive of the AUD.
The Trade Balance, which is the difference between what a country earns from its exports versus what it pays for its imports, is another factor that can influence the value of the Australian Dollar. If Australia produces highly sought after exports, then its currency will gain in value purely from the surplus demand created from foreign buyers seeking to purchase its exports versus what it spends to purchase imports. Therefore, a positive net Trade Balance strengthens the AUD, with the opposite effect if the Trade Balance is negative.
- USD/JPY faces some selling pressure near 154.15 in Friday’s early Asian session.
- The escalating geopolitical tension in the Middle East and Asia boosts the safe-haven JPY.
- Investors raise their bets that the US Fed will delay interest rate cuts to September.
The USD/JPY pair attracts some sellers around 154.15 on Friday during the early Asian trading hours. The risk-off mood and rising tension between Israel and Iran boost the safe-haven flows, benefiting the Japanese Yen (JPY). However, the robust US economic data and any hawkish comments from the Federal Reserve (Fed) officials might cap the pair upside in the near term. The Bank of Japan (BoJ) will hold a meeting next week and it is expected to revise up its inflation forecast for this fiscal year in a quarterly report.
Japan’s inflation rate slowed in March, but remains above the central bank's 2% target, the Statistics Bureau of Japan reported on Friday. The year-on-year headline Consumer Price Index (CPI) for March climbed 2.7% YoY, followed by a 2.8% February increase. The Core CPI inflation, which excludes fresh food, rose 2.6% YoY in March from an increase of 2.8% in February, below the market consensus of 2.7%.
On Thursday, BoJ Governor Kazuo Ueda said that the Japanese central bank may raise interest rates again if the Yen's declines considerably increase inflation. Ueda added that the impact of currency moves might affect the timing of the next policy shift.
Meanwhile, BoJ board member Asahi Noguchi said on Thursday that the “main scenario is that future rate hikes are likely to be slow, but that depends on economic data. Noguchi noted that the “focus now is on the pace at which the policy rate will be adjusted and at what level it will eventually stabilize.” The uncertainty surrounding the BoJ’s future rate hike path remains weighing on the JPY.
Nonetheless, the conflict between Israel and Iran triggered Middle East war fears. On Friday, Prime Minister Benjamin Netanyahu said Israel will make its "own decisions" when responding to Iran's unprecedented weekend airstrikes, per CNN. Additionally, Taiwan’s Defense Ministry stated that four Chinese military planes crossed the Taiwan Strait median line in the past 24 hours. The escalating geopolitical tension in the Middle East and Asia might boost safe-haven assets like the JPY and create a headwind for the USD/JPY pair.
On the USD’s front, investors raise their bets that the US Fed will delay interest rate cuts to September. Atlanta Fed President Raphael Bostic said that US inflation is too high and the Fed still has a way to go on inflation, while New York Fed President John Williams emphasized that the Fed is data dependent and he doesn't feel an urgency to cut rates.
- GBP/USD loses traction around 1.2430 amid the firmer US dollar on Friday.
- The Fed’s hawkish comments boost the Greenback against the GBP.
- BoE’s Greene said rate cuts were not imminent and that inflation remains too high.
The GBP/USD pair remains on the defensive near 1.2430 during the early Asian session on Friday. The downtick of the major pair is backed by the stronger US Dollar (USD) as the strong US economic data and hawkish remarks from the Federal Reserve (Fed) officials have triggered the speculation that the US central bank will delay interest rate cuts to September.
On Thursday, Atlanta Fed President Raphael Bostic said that US inflation is too high and the central bank still has a way to go on inflation. Bostic further stated that he’s comfortable being patient and rate cuts are likely by year end. New York Fed President John Williams emphasized that the Fed is data-dependent and noted that he doesn't feel an urgency to cut rates. Investors are now pricing in nearly 66% odds that the Fed will cut its rate in September, according to the CME FedWatch Tool.
About the data, the US Initial Jobless Claims for the week ending April 13 increased below market expectations, rising by 212,000 from the previous week of 212,000. Meanwhile, the Philadelphia Fed Manufacturing Index jumped to 15.5 in April from 3.2 in March, beating the estimation of 1.5. Finally, US Existing Home Sales dropped by 4.3% MoM to 4.19 million from 4.38 million, worse than the anticipated 4.2 million.
On the GBP’s front, the expectation that the Bank of England (BoE) might cut its interest rate ahead of the US Fed has exerted some selling pressure on the Pound Sterling (GBP) against the USD. However, BoE policymaker Megan Greene said on Wednesday that rate cuts were not imminent, and the combination of high inflation and weak growth means there is a way to go to bring inflation back to target. Greene added that the recent tensions in the Middle East could pose a risk to the inflation outlook, including by elevating inflation expectations. These comments failed to boost the GBP from nearly six-month lows. Investors will take more cues from the UK March Retail Sales, along with the speeches by BoE’s Ramsden and Breeden later on Friday.
| Index | Change, points | Closed | Change, % |
|---|---|---|---|
| NIKKEI 225 | 117.9 | 38079.7 | 0.31 |
| Hang Seng | 134.03 | 16385.87 | 0.82 |
| KOSPI | 50.52 | 2634.7 | 1.95 |
| ASX 200 | 36.5 | 7642.1 | 0.48 |
| DAX | 67.38 | 17837.4 | 0.38 |
| CAC 40 | 41.75 | 8023.26 | 0.52 |
| Dow Jones | 22.07 | 37775.38 | 0.06 |
| S&P 500 | -11.09 | 5011.12 | -0.22 |
| NASDAQ Composite | -81.87 | 15601.5 | -0.52 |
| Pare | Closed | Change, % |
|---|---|---|
| AUDUSD | 0.64206 | -0.23 |
| EURJPY | 164.53 | -0.1 |
| EURUSD | 1.06435 | -0.29 |
| GBPJPY | 192.284 | 0.06 |
| GBPUSD | 1.24368 | -0.14 |
| NZDUSD | 0.59022 | -0.24 |
| USDCAD | 1.37673 | -0.01 |
| USDCHF | 0.91216 | 0.2 |
| USDJPY | 154.601 | 0.19 |
FOREIGN EXCHANGE MARKET NEWS
CURRENCY MARKET DEFINITION
The concept of currency market has several definitions:
- Currency market is the sphere of economic relations that are manifested in the purchase and sale of currency values (foreign currency, securities in foreign currency), as well as operations related to the investment of capital in foreign currency;
- Currency market is a financial center where currency purchase and sale transactions based on supply and demand for them are concentrated;
- Curency market is a whole of authorized banks, investment companies, brokerages, exchanges, and foreign banks that perform foreign exchange operations.
- Currency market is a whole of communications systems that link banks in different countries that conduct international currency transactions.
Simply put, currency market is the market where currency transactions are made, that is, the currency of one country is exchanged for the currency of another country at a certain exchange rate. The exchange rate is the relative price of currencies of two countries or the currency of one country expressed in another country's monetary units.
Currency market is part of the global financial market, where many operations related to the global movement of capital take place.
TYPES OF MARKETS. RUSSIAN AND INTERNATIONAL CURRENCY MARKETS
There are international and domestic currency markets.
Domestic currency market — is a market within a single country.
The international currency market — is a global market that covers currency markets of all countries in the world. It does not have a specific site where trading is carried out. All operations within it are carried out through a system of cable and satellite channels that link the world's regional currency markets. Regional markets today include the Asian (with centers in Tokyo, Hong Kong, Singapore, and Melbourne), the European (London, Frankfurt am Main, and Zurich), and the American (New York, Chicago, and Los Angeles) markets.
Currency trading on the international currency market is carried out on the basis of market exchange rates, which are set on the basis of supply and demand in the market and under the influence of various macroeconomic data. Forex is the international currency market.
Currency markets can also be divided into exchange and over-the-counter markets. Exchange currency market is an organized market where trading is carried out through an exchange—a special company that sets trading rules and provides all the conditions for organizing trading under these rules.
Over-the-counter currency market — is a market where there are no certain trading rules, and purchase and sale operations are not linked to a specific place of trade, as opposed to the case of an exchange.
As a rule, an over-the-counter currency market is organized by special companies that provide services for the purchase and sale of currencies, which may or may not be members of the currency exchange. Trading operations in this market are now carried out mainly via the Internet.
The over-the-counter currency market is much larger than the exchange market in terms of trading volume. The Forex international over-the-counter currency market is considered the most liquid in the world. It operates around the clock in all financial centers of the world (from New York to Tokyo).
CURRENCY MARKET FUNCTIONS
Currency market— is the most important platform for ensuring the normal course of all global economic processes.
The main macroeconomic functions of the currency market are:
- creating conditions for the subjects of foreign exchange relations to make timely international current and capital payments and thereby promoting the development of foreign trade;
- providing conditions and mechanisms for the implementation of monetary and economic policy of the state;
- diversifying foreign exchange reserves;
- forming the exchange rate under the influence of supply and demand;
NEWS IMPACT
Various currencies are the main trading tool in the currency market. Exchange rates are formed under the influence of supply and demand in the market.
In addition to that, currency rates are influenced by many fundamental factors related to the global economic situation, events in national economies, and political decisions.
News about these factors can be found in various sources:
- Reports showing a country´s level of economic development.
The more stable an economy is developing, the more stable its currency is. Accordingly, it is possible to predict how the currency will behave in the near future, based on statistical data published in official sources of countries with a certain regularity.
This data includes:
- GDP
- unemployment;
- return on equity;
- consumer price index;
- industrial price index;
- propensity to consume;
- salaries outside of the agricultural sector;
- residential construction, etc.
Interest rate level, set by national authorities regulating credit policy, is an equally important indicator. In the European Union, this is ECB–the European Central Bank, in the US, this is the Federal Reserve System, in Japan—the Bank of Japan, in the UK—the Bank of England, in Switzerland—the Swiss national Bank, etc.
The interest rate level is determined at meetings of the national central bank. Then, the decision on the rate is published in official sources. If the central bank of a country reduces the interest rate, the money supply in the country increases, and the national currency depreciates against other world currencies. If the interest rate increases, the national currency will strengthen.
- Speeches of country leaders, leading economists and analysts.
A speech or even a separate statement by a country's leader can reverse a trend. Speeches on these topics may change the currency exchange rate:
- analysis of the situation on the currency market;
- changes in monetary or economic policy;
- adoption of a budget policy;
- forecasts of the economic situation, etc.
All this news is published in various sources. Major international news is more or less easy to find in Russian, but news related to the domestic economic policy and the economy of foreign countries is much less common in the Russian press. Mostly, such news is published by the national media and in the language of the country where the news is published.
It is very difficult for one person to follow all the news at once, and they are likely to miss some important event that can turn the whole situation on the market upside down. Guided by our main principle—to create the best trading conditions for our customers—we try to select the most important news from all over the world and publish them on our website.
The TeleTRADE Department of Analytics monitors news on most national and international news sources on a daily basis and identifies those that can potentially affect exchange rates. These are the main news items that are included in our news feed.
In addition, all our clients have free access to the Dow Jones news feed. This is a joint project of Dow Jones Newswires, the world's largest news agency, and the leading Russian news agency Prime-TASS. The news feed is created specifically for currency traders and those who are interested in getting information about the world's currency markets.


© 2000-2024. All rights reserved.
This site is managed by Teletrade D.J. LLC 2351 LLC 2022 (Euro House, Richmond Hill Road, Kingstown, VC0100, St. Vincent and the Grenadines).
The information on this website is for informational purposes only and does not constitute any investment advice.
The company does not serve or provide services to customers who are residents of the US, Canada, Iran, The Democratic People's Republic of Korea, Yemen and FATF blacklisted countries.
Making transactions on financial markets with marginal financial instruments opens up wide possibilities and allows investors who are willing to take risks to earn high profits, carrying a potentially high risk of losses at the same time. Therefore you should responsibly approach the issue of choosing the appropriate investment strategy, taking the available resources into account, before starting trading.
Use of the information: full or partial use of materials from this website must always be referenced to TeleTrade as the source of information. Use of the materials on the Internet must be accompanied by a hyperlink to teletrade.org. Automatic import of materials and information from this website is prohibited.
Please contact our PR department if you have any questions or need assistance at pr@teletrade.global.
transfers