- Analytics
- News and Tools
- Market News
Market Trading News and Research from 29 April 2024
Japan’s top currency diplomat Masato Kanda is back on the wires on Monday, unwilling to comment again on whether there was FX intervention.
Additional comments
“Will continue to take appropriate action against excessive forex moves.”
“Don't have a specific level in mind about appropriate forex level.”
“Speculative, rapid, abnormal FX moves have bad impact on the economy, so unacceptable.”
“Ready to respond 24 hours, 365 days,” when asked whether Japan was ready to take action in the FX market.
Market reaction
At the time of writing, USD/JPY keeps its recovery mode intact near 155.80, having tested 154.50 in an exaggerated reaction to a likely intervention by the Japanese authorities during Monday’s Asian trading. The pair is still down 1.53% on the day.
Japanese Yen FAQs
The Japanese Yen (JPY) is one of the world’s most traded currencies. Its value is broadly determined by the performance of the Japanese economy, but more specifically by the Bank of Japan’s policy, the differential between Japanese and US bond yields, or risk sentiment among traders, among other factors.
One of the Bank of Japan’s mandates is currency control, so its moves are key for the Yen. The BoJ has directly intervened in currency markets sometimes, generally to lower the value of the Yen, although it refrains from doing it often due to political concerns of its main trading partners. The current BoJ ultra-loose monetary policy, based on massive stimulus to the economy, has caused the Yen to depreciate against its main currency peers. This process has exacerbated more recently due to an increasing policy divergence between the Bank of Japan and other main central banks, which have opted to increase interest rates sharply to fight decades-high levels of inflation.
The BoJ’s stance of sticking to ultra-loose monetary policy has led to a widening policy divergence with other central banks, particularly with the US Federal Reserve. This supports a widening of the differential between the 10-year US and Japanese bonds, which favors the US Dollar against the Japanese Yen.
The Japanese Yen is often seen as a safe-haven investment. This means that in times of market stress, investors are more likely to put their money in the Japanese currency due to its supposed reliability and stability. Turbulent times are likely to strengthen the Yen’s value against other currencies seen as more risky to invest in.
Silver prices (XAG/USD) rose on Monday, according to FXStreet data. Silver trades at $27.39 per troy ounce, up 0.64% from the $27.22 it cost on Friday.
Silver prices have increased by 7.54% since the beginning of the year.
| Unit measure | Today Price |
|---|---|
| Silver price per troy ounce | $27.39 |
| Silver price per gram | $0.88 |
The Gold/Silver ratio, which shows the number of troy ounces of Silver needed to equal the value of one troy ounce of Gold, stood at 85.38 on Monday, down from 85.91 on Friday.
Investors might use this ratio to determine the relative valuation of Gold and Silver. Some may consider a high ratio as an indicator that Silver is undervalued – or Gold is overvalued – and might buy Silver or sell Gold accordingly. Conversely, a low ratio might suggest that Gold is undervalued relative to Silver.
Silver FAQs
Silver is a precious metal highly traded among investors. It has been historically used as a store of value and a medium of exchange. Although less popular than Gold, traders may turn to Silver to diversify their investment portfolio, for its intrinsic value or as a potential hedge during high-inflation periods. Investors can buy physical Silver, in coins or in bars, or trade it through vehicles such as Exchange Traded Funds, which track its price on international markets.
Silver prices can move due to a wide range of factors. Geopolitical instability or fears of a deep recession can make Silver price escalate due to its safe-haven status, although to a lesser extent than Gold's. As a yieldless asset, Silver tends to rise with lower interest rates. Its moves also depend on how the US Dollar (USD) behaves as the asset is priced in dollars (XAG/USD). A strong Dollar tends to keep the price of Silver at bay, whereas a weaker Dollar is likely to propel prices up. Other factors such as investment demand, mining supply – Silver is much more abundant than Gold – and recycling rates can also affect prices.
Silver is widely used in industry, particularly in sectors such as electronics or solar energy, as it has one of the highest electric conductivity of all metals – more than Copper and Gold. A surge in demand can increase prices, while a decline tends to lower them. Dynamics in the US, Chinese and Indian economies can also contribute to price swings: for the US and particularly China, their big industrial sectors use Silver in various processes; in India, consumers’ demand for the precious metal for jewellery also plays a key role in setting prices.
Silver prices tend to follow Gold's moves. When Gold prices rise, Silver typically follows suit, as their status as safe-haven assets is similar. The Gold/Silver ratio, which shows the number of ounces of Silver needed to equal the value of one ounce of Gold, may help to determine the relative valuation between both metals. Some investors may consider a high ratio as an indicator that Silver is undervalued, or Gold is overvalued. On the contrary, a low ratio might suggest that Gold is undervalued relative to Silver.
- USD/CHF loses ground due to the improved risk appetite on Monday.
- Fed is expected to maintain its current interest rate range of 5.25%–5.5% in June.
- SNB Chairman Thomas Jordan stated that the central bank is prepared to lower interest rates again if deemed necessary.
USD/CHF retraces its recent gains that registered on Friday, trading around 0.9120 during the European session on Monday. The US Dollar (USD) depreciates, possibly reflecting a shift toward a risk-on sentiment, which undermines the USD/CHF pair.
However, market analysts expect the US Federal Reserve (Fed) to maintain the current interest rate range of 5.25%–5.5% in its upcoming policy meeting on Wednesday, likely due to concerns about stronger inflation. Additionally, the annual US Core Personal Consumption Expenditures (PCE) Price Index data for March showed a rise on last Friday, suggesting that the Fed may delay any potential rate cuts until September. According to the CME FedWatch Tool, the probability of the Fed keeping interest rates unchanged in the June meeting has increased to 87.7%, up from last week's 81.7%.
On the Swiss side, during the SNB's General Meeting of Shareholders on Friday, Chairman Thomas J. Jordan emphasized the bank's commitment to monitoring inflation closely. He stated that the SNB stands ready to reduce interest rates again when necessary. In March, the SNB surprised markets by lowering its main policy rate by 0.25 percentage points to 1.5%.
Chairman Jordan highlighted the SNB's success in combating inflation but cautioned that uncertainty remains high and shocks can arise unexpectedly. He emphasized the importance of maintaining focus on price stability and warned against calls from critics to broaden the SNB's mandate, labeling such demands as dangerous.
Investors are expected to closely watch the Consumer Price Index (CPI) data scheduled to be released by the Swiss Federal Statistical Office on Thursday. The CPI serves as the primary indicator for measuring inflation and changes in purchasing trends in Switzerland.
Gold prices fell in India on Monday, according to data from India's Multi Commodity Exchange (MCX).
Gold price stood at 71,900 Indian Rupees (INR) per 10 grams, down INR 216 compared with the INR 72,116 it cost on Friday.
As for futures contracts, Gold prices increased to INR 71,564 per 10 gms from INR 71,500 per 10 gms.
Prices for Silver futures contracts increased to INR 82,617 per kg from INR 82,496 per kg.
| Major Indian city | Gold Price |
|---|---|
| Ahmedabad | 74,450 |
| Mumbai | 74,245 |
| New Delhi | 74,250 |
| Chennai | 74,490 |
| Kolkata | 74,520 |
Global Market Movers: Comex Gold price struggles for a firm direcion amid mixed fundamental cues
- The US Bureau of Economic Analysis reported on Friday that the Personal Consumption Expenditures (PCE) Price Index rose 0.3% in March, while the yearly rate climbed to 2.7% from 2.5% in February, beating estimates for a reading of 2.6%.
- Meanwhile, the core PCE Price Index, which excludes volatile food and energy prices, held steady at 2.8% as compared to 2.6% anticipated, reaffirming hawkish Federal Reserve expectations and exerting pressure on the non-yielding Gold price on Comex.
- Further, Israel-Hamas peace talks in Cairo fuel optimism about the de-escalation of tensions in the Middle East, which further boosts investors' appetite for riskier assets and contributes to driving flows away from the safe-haven precious metal.
- That said, Ukraine attacked more Russian oil refineries over the weekend and also called on more military aid from the US over worsening conditions on the front lines, keeping geopolitical risks in play and lending support to the XAU/USD.
- Apart from this, evidence that inflation in the US is not easing as initially expected should act as a tailwind for the metal, which is seen as a hedge against inflation, ahead of the crucial two-day FOMC monetary policy meeting starting on Tuesday.
- Investors this week will also confront the release of important US macro data scheduled at the beginning of a new month, including the closely-watched monthly jobs data – popularly known as the Nonfarm Payrolls (NFP) report on Friday.
(An automation tool was used in creating this post.)
Gold FAQs
Gold has played a key role in human’s history as it has been widely used as a store of value and medium of exchange. Currently, apart from its shine and usage for jewelry, the precious metal is widely seen as a safe-haven asset, meaning that it is considered a good investment during turbulent times. Gold is also widely seen as a hedge against inflation and against depreciating currencies as it doesn’t rely on any specific issuer or government.
Central banks are the biggest Gold holders. In their aim to support their currencies in turbulent times, central banks tend to diversify their reserves and buy Gold to improve the perceived strength of the economy and the currency. High Gold reserves can be a source of trust for a country’s solvency. Central banks added 1,136 tonnes of Gold worth around $70 billion to their reserves in 2022, according to data from the World Gold Council. This is the highest yearly purchase since records began. Central banks from emerging economies such as China, India and Turkey are quickly increasing their Gold reserves.
Gold has an inverse correlation with the US Dollar and US Treasuries, which are both major reserve and safe-haven assets. When the Dollar depreciates, Gold tends to rise, enabling investors and central banks to diversify their assets in turbulent times. Gold is also inversely correlated with risk assets. A rally in the stock market tends to weaken Gold price, while sell-offs in riskier markets tend to favor the precious metal.
The price can move due to a wide range of factors. Geopolitical instability or fears of a deep recession can quickly make Gold price escalate due to its safe-haven status. As a yield-less asset, Gold tends to rise with lower interest rates, while higher cost of money usually weighs down on the yellow metal. Still, most moves depend on how the US Dollar (USD) behaves as the asset is priced in dollars (XAU/USD). A strong Dollar tends to keep the price of Gold controlled, whereas a weaker Dollar is likely to push Gold prices up.
European Central Bank (ECB) policymaker Pierre Wunsch said on Monday that a “July rate cut is not a done deal.”
Additional quotes
We are going with at least two rate cuts this year, barring any bad news.
We still want policy to remain a little restrictive.
Cutting rates again in July could be interpreted to mean we are going to cut at every meeting.
And that would lead to repricing that might go too far.
July decision should be about managing expectations.
I'm very comfortable with rate cut in June.
But if we only do two or three rate cuts, then should not communicate that at every meeting.
Would be very surprised if ECB does more than 25 bps rate cut in June.
Market reaction
Despite these comments from the ECB official, EUR/USD is paring back gains to test 1.0700, at the time of writing.
Here is what you need to know on Monday, April 29:
The Japanese Yen (JPY) registered impressive gains against its major rivals to start the week on a suspected intervention. The US economic docket will not offer any high-tier data releases on Monday. Germany's Destatis will release the preliminary Consumer Price Index (CPI) data for February.
USD/JPY climbed to a multi-decade high above 160.00 in the early trading hours of the Asian session on Monday. After retreating toward 159.50 area, the pair moved sideways near this level for a couple of hours before declining sharply. USD/JPY lost nearly 400 pips in the next hour and was last seen down 1.7% on the day at 155.60. When asked about the market view of an intervention, Japan’s top currency diplomat Masato Kanda declined to comment.
Japanese Yen sticks to strong intraday recovery gains near 155.00 against USD.
Japanese Yen price today
The table below shows the percentage change of Japanese Yen (JPY) against listed major currencies today. Japanese Yen was the strongest against the US Dollar.
| USD | EUR | GBP | CAD | AUD | JPY | NZD | CHF | |
| USD | -0.15% | -0.21% | -0.02% | -0.35% | -1.56% | -0.33% | -0.26% | |
| EUR | 0.14% | -0.07% | 0.13% | -0.19% | -1.41% | -0.18% | -0.11% | |
| GBP | 0.22% | 0.06% | 0.20% | -0.14% | -1.33% | -0.12% | -0.03% | |
| CAD | 0.01% | -0.14% | -0.20% | -0.33% | -1.63% | -0.33% | -0.27% | |
| AUD | 0.35% | 0.19% | 0.13% | 0.33% | -1.19% | 0.00% | 0.08% | |
| JPY | 1.54% | 1.38% | 1.31% | 1.52% | 1.17% | 1.20% | 1.27% | |
| NZD | 0.33% | 0.18% | 0.12% | 0.32% | -0.01% | -1.22% | 0.08% | |
| CHF | 0.26% | 0.11% | 0.04% | 0.24% | -0.10% | -1.30% | -0.09% |
The heat map shows percentage changes of major currencies against each other. The base currency is picked from the left column, while the quote currency is picked from the top row. For example, if you pick the Euro from the left column and move along the horizontal line to the Japanese Yen, the percentage change displayed in the box will represent EUR (base)/JPY (quote).
Pressured by the decline seen in USD/JPY, the US Dollar Index turned south on Monday and was last seen losing 0.45% on the day near 105.30. Meanwhile, the benchmark 10-year US Treasury bond yield holds steady above 4.6%, while US stock index futures trade modestly higher on the day. On Wednesday, the Federal Reserve will announce monetary policy decisions and the US Bureau of Labor Statistics will release April labor market data on Friday.
EUR/USD closed the previous week in positive territory and continued to edge higher early Monday. At the time of press, the pair was up 0.3% on the day at 1.0722.
GBP/USD registered marginal losses on Friday but regained its traction to start the week. The pair was last seen trading at its highest level in over two weeks at 1.2535.
Gold fell over 2% and snapped a five-week winning streak last week. XAU/USD holds steady early Monday and fluctuates in a tight channel above $2,330.
Japanese Yen FAQs
The Japanese Yen (JPY) is one of the world’s most traded currencies. Its value is broadly determined by the performance of the Japanese economy, but more specifically by the Bank of Japan’s policy, the differential between Japanese and US bond yields, or risk sentiment among traders, among other factors.
One of the Bank of Japan’s mandates is currency control, so its moves are key for the Yen. The BoJ has directly intervened in currency markets sometimes, generally to lower the value of the Yen, although it refrains from doing it often due to political concerns of its main trading partners. The current BoJ ultra-loose monetary policy, based on massive stimulus to the economy, has caused the Yen to depreciate against its main currency peers. This process has exacerbated more recently due to an increasing policy divergence between the Bank of Japan and other main central banks, which have opted to increase interest rates sharply to fight decades-high levels of inflation.
The BoJ’s stance of sticking to ultra-loose monetary policy has led to a widening policy divergence with other central banks, particularly with the US Federal Reserve. This supports a widening of the differential between the 10-year US and Japanese bonds, which favors the US Dollar against the Japanese Yen.
The Japanese Yen is often seen as a safe-haven investment. This means that in times of market stress, investors are more likely to put their money in the Japanese currency due to its supposed reliability and stability. Turbulent times are likely to strengthen the Yen’s value against other currencies seen as more risky to invest in.
- The Pound Sterling rises to a two-week high near 1.2550 amid an improved market mood.
- Investors see the BoE pivoting to interest rate cuts in the June or August meeting.
- The Fed’s policy decision on Wednesday and the NFP report on Friday will be the key events this week.
The Pound Sterling (GBP) prints a fresh two-week high against the US Dollar (USD) near 1.2550 in Monday’s London session. The GBP/USD pair advances due to cheerful market sentiment and a decline in the US Dollar. The Cable strengthens as mixed guidance from Bank of England (BoE) policymakers over the inflation outlook increases uncertainty about when the BoE will start its interest rate cuts cycle.
BoE Deputy Governor Dave Ramsden said in mid-April that the risks of inflation remaining elevated have receded. Ramsden predicted headline inflation would return to the 2% target in May and said it would likely remain at this level for the next two years.
On the contrary, a few other BoE policymakers, such as Chief Economist Huw Pill, Jonathan Haskel, and Catherine Mann, aren’t that optimistic about the inflation outlook. Most of them have referred to the core Consumer Price Index (CPI) as the preferred measure for decision-making on interest rates, which is still high due to stubborn service inflation. Last week, Pill said: “Time for cutting bank rate remains some way off.”
Financial markets are expecting that the BoE will pivot to rate cuts in the June or August meeting. "It is between June and August, and we are leaning slightly towards August on the basis that one of the key things the BoE is looking at is service inflation," said James Smith, an economist at ING Financial Markets. "If services inflation is a little bit stickier, I think that tilts the balance a little bit further towards August over June, but it's a pretty close call, to be honest", he added.
Daily digest market movers: Pound Sterling moves higher while US Dollar edges down
- The Pound Sterling rallies to 1.2550, capitalizing on improved market sentiment. S&P 500 futures have posted significant gains during the Asian session, suggesting an improvement in investors’ risk appetite. A slight decline in the US Dollar ahead of the Federal Reserve’s interest rate decision has also boosted the GBP/USD pair. However, firm expectations that the Fed will maintain the hawkish tone could support the US Dollar.
- The Fed is widely anticipated to hold interest rates steady in the range of 5.25%- 5.50% in its monetary policy meeting on Wednesday. Fed policymakers are expected to remain data-dependent for further decisions. The central bank will likely reiterate the need to gain more confidence before pivoting to rate cuts.
- A recent batch of consumer inflation data has not offered any relief to Fed policymakers. The United States core Personal Consumption Expenditure Price Index (PCE) data for March, released on Friday, indicated that higher service prices kept price pressures hotter than expected.
- Annually, the core PCE inflation data rose by 2.8%, higher than expectations of 2.6% and at the same pace as in February. The monthly inflation data grew parallel with the consensus and the prior release of 0.3%. The 0.3% growth in monthly core PCE is higher than needed for inflation to return to the desired rate of 2%.
- Apart from the Fed’s monetary policy decision, investors will also focus on the Institute for Supply Management (ISM) Manufacturing Purchasing Managers Index (PMI) data for April, which will be published on Wednesday. The ISM Manufacturing PMI is estimated to remain above the 50.0 threshold, which separates expansion from contraction. The factory data is seen at 50.1, lower than the prior reading of 50.3. The PMI survey by S&P Global for the same period showed a sharp decline in the scale of production and new orders due to inflationary pressures, weak demand and sufficient stock holdings at customers.
- Later this week, the US Nonfarm Payrolls (NFP) data will be the crucial event that will indicate the current status of the labor market.
Technical Analysis: Pound Sterling rebounds to H&S neckline
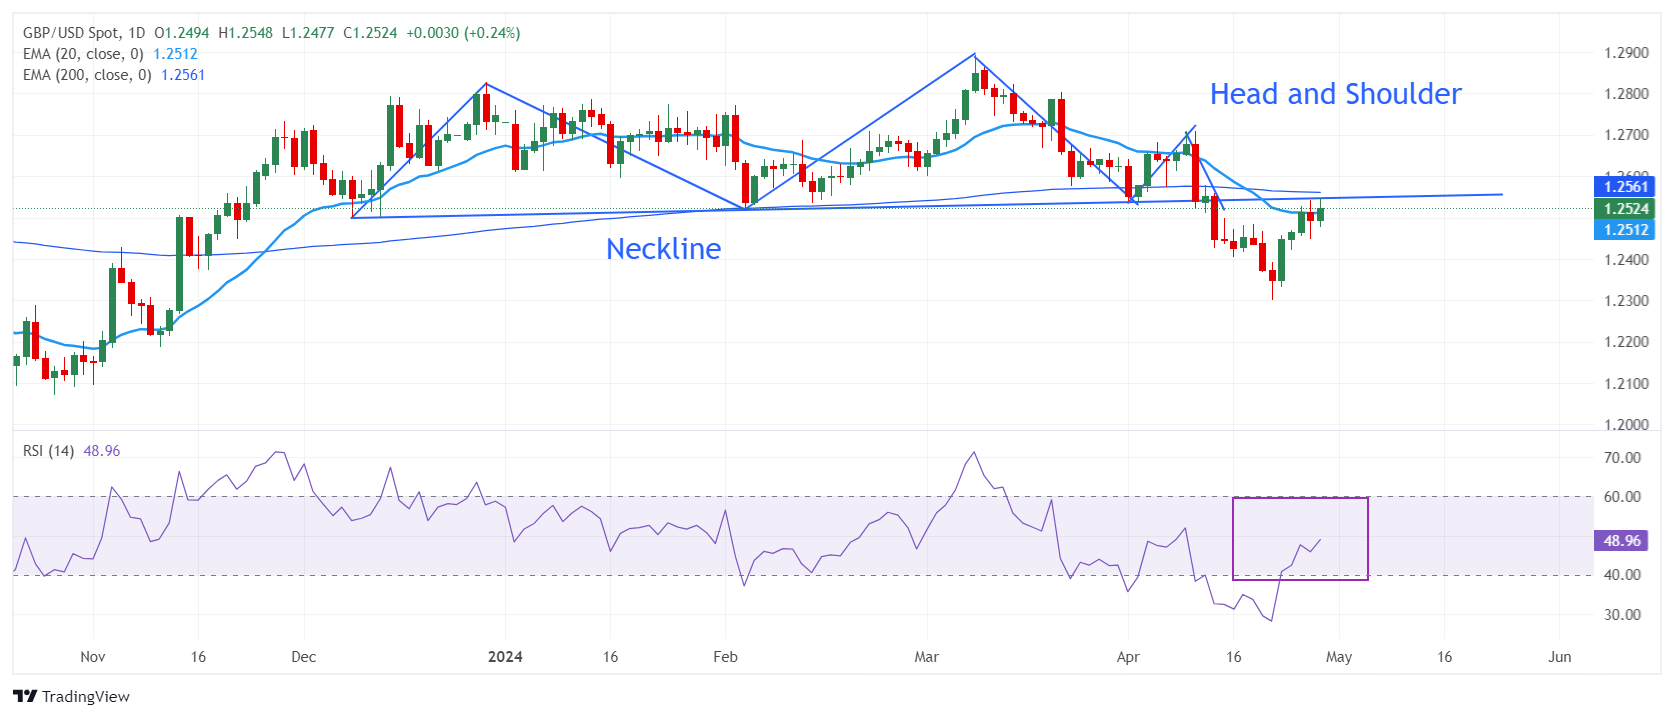
The Pound Sterling recovers losses registered in the last weeks and hovers near the neckline of the Head and Shoulder chart pattern. The neckline of the above-mentioned pattern is plotted from December 8 low around 1.2500.
The GBP/USD pair attempts to sustain above the 20-day Exponential Moving Average (EMA), at around 1.2510. The 200-day EMA, at 1.2550, is acting as a major barrier for the Pound Sterling bulls.
The 14-period Relative Strength Index (RSI) shifts into the 40.00-60.00 range, suggesting a consolidation ahead.
Pound Sterling FAQs
The Pound Sterling (GBP) is the oldest currency in the world (886 AD) and the official currency of the United Kingdom. It is the fourth most traded unit for foreign exchange (FX) in the world, accounting for 12% of all transactions, averaging $630 billion a day, according to 2022 data. Its key trading pairs are GBP/USD, aka ‘Cable’, which accounts for 11% of FX, GBP/JPY, or the ‘Dragon’ as it is known by traders (3%), and EUR/GBP (2%). The Pound Sterling is issued by the Bank of England (BoE).
The single most important factor influencing the value of the Pound Sterling is monetary policy decided by the Bank of England. The BoE bases its decisions on whether it has achieved its primary goal of “price stability” – a steady inflation rate of around 2%. Its primary tool for achieving this is the adjustment of interest rates. When inflation is too high, the BoE will try to rein it in by raising interest rates, making it more expensive for people and businesses to access credit. This is generally positive for GBP, as higher interest rates make the UK a more attractive place for global investors to park their money. When inflation falls too low it is a sign economic growth is slowing. In this scenario, the BoE will consider lowering interest rates to cheapen credit so businesses will borrow more to invest in growth-generating projects.
Data releases gauge the health of the economy and can impact the value of the Pound Sterling. Indicators such as GDP, Manufacturing and Services PMIs, and employment can all influence the direction of the GBP. A strong economy is good for Sterling. Not only does it attract more foreign investment but it may encourage the BoE to put up interest rates, which will directly strengthen GBP. Otherwise, if economic data is weak, the Pound Sterling is likely to fall.
Another significant data release for the Pound Sterling is the Trade Balance. This indicator measures the difference between what a country earns from its exports and what it spends on imports over a given period. If a country produces highly sought-after exports, its currency will benefit purely from the extra demand created from foreign buyers seeking to purchase these goods. Therefore, a positive net Trade Balance strengthens a currency and vice versa for a negative balance.
- USD/CAD loses momentum near 1.3645, losing 0.20% on Monday.
- The US Federal Reserve (Fed) is expected to leave the interest rate unchanged in its current 5.25%–5.50% range on Wednesday.
- The decline of crude oil weighs on the commodity-linked Loonie.
The USD/CAD pair weakens to 1.3645 during the early European trading hours on Monday. The decline of the US Dollar (USD) drags the pair lower to a nearly three-week low. In the absence of top-tier economic data release from Canada, the USD price dynamics will continue to play a key role in influencing the USD/CAD pair. The Federal Open Market Committee (FOMC) interest rate decision will be the highlight on Wednesday ahead of US employment data on Friday.
The two-day FOMC monetary policy meeting will end on Wednesday, with no change in rate expected. The tone of Fed Chair Jerome Powell and other policymakers will most likely be on the hawkish side. Fed Chair Jerome Powell noted that the US central bank needs more confidence that inflation is returning to its 2% target before cutting rates. Investors see a 25% chance that the Fed will cut interest rates in July, down from 50% last week. Additionally, financial markets have priced in nearly 60% odds that the Fed will lower the rate at its September meeting, according to the CME FedWatch tool.
About the data, US inflation, as measured by the Personal Consumption Expenditures (PCE) Price Index, climbed to 2.7% YoY in March from 2.5% in February, firmer than the market expectation of 2.6%. The Core PCE, the Fed's preferred inflation gauge, rose by 2.8% YoY in March, above the market consensus of 2.6%.
On the Loonie front, the Bank of Canada’s (BoC) governing council members were split on how long the central bank should wait before it begins lowering interest rates when they met earlier this month. Canada’s inflation rate was 2.9% in March, within the BoC's 1-3% target range, and Core inflation eased over the last few months. Markets widely expect the BoC to start cutting its policy rate in June or July. This, in turn, might weigh on the Canadian Dollar (CAD) and cap the USD/CAD’s downside.
Meanwhile, the decline of crude oil exerts some selling pressure on the commodity-linked Loonie, as Canada is the largest crude oil exporter to the United States (US).
- EUR/USD holds its position above the psychological level of 1.0700 amid a momentum shift toward an upward trend.
- The immediate barrier appears around the major level of 1.0750, aligned with the upper boundary of the descending channel.
- A break below 1.0700 could lead the pair toward the support level of 1.0650 and April’s low of 1.0601.
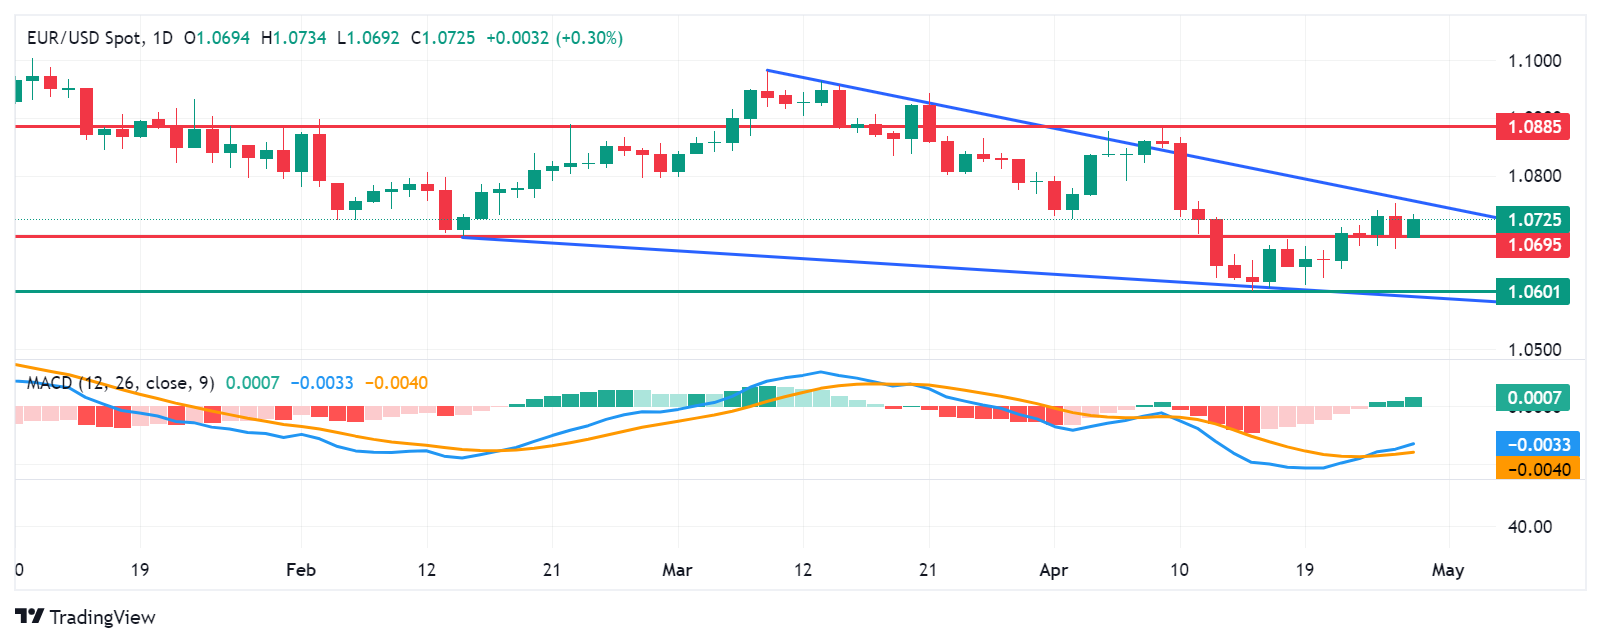
EUR/USD recovers its recent losses registered in the previous session, trading around 1.0720 during the Asian session on Monday. From a technical perspective, analysis indicates a weakening bearish sentiment for the pair as it continues to advance within the descending channel, breaching the key psychological level of 1.0700.
Furthermore, the lagging indicator Moving Average Convergence Divergence (MACD) suggests a shift toward upward momentum for the EUR/USD pair. Although positioned below the centerline, it exhibits divergence above the signal line.
The EUR/USD pair faces an immediate barrier at the major level of 1.0750, corresponding with the upper boundary of the descending channel. A successful breakthrough above this level could provide upward momentum for the pair, targeting the area near the psychological milestone of 1.0800, followed by April’s high at 1.0885.
On the downside, key support for the EUR/USD pair is anticipated around the psychological threshold of 1.0700, coinciding with major support at 1.0695. A breach below this level could exert downward pressure on the pair, potentially driving it toward the vicinity of the major support level at 1.0650. Further support levels may emerge around April’s low at 1.0601, aligning with the lower boundary of the descending channel.
EUR/USD: Daily Chart
FX option expiries for Apr 29 NY cut at 10:00 Eastern Time, via DTCC, can be found below
- EUR/USD: EUR amounts
- 1.0650 559m
- 1.0710 686m
- 1.0720 579m
- 1.0725 480m
- 1.0740 1.4b
- GBP/USD: GBP amounts
- 1.2600 532m
- USD/CAD: USD amounts
- 1.3700 614m
- 1.3835 940m
- NZD/USD attracts fresh buyers on Monday and advances to over a two-week high.
- A positive risk tone undermines the Greenback and benefits the risk-sensitive Kiwi.
- Hawkish Fed expectations should limit the USD losses and cap the upside for the pair.
The NZD/USD pair gains strong positive traction on the first day of a new week and rallies to over a two-week high, around the 0.5980-0.5985 region during the Asian session.
Against the backdrop of receding fears of an Israel-Iran war, the latest optimism over Israel-Hamas peace talks in Cairo boosts investors' appetite for riskier assets. This is evident from a generally positive tone around the equity markets, which prompts some selling around the safe-haven US Dollar (USD) and benefits the risk-sensitive Kiwi. That said, hawkish Federal Reserve (Fed) expectations should help limit any meaningful USD downfall and cap the upside for the NZD/USD pair.
Investors seem convinced that the US central bank will keep interest rates higher for longer amid still sticky inflation and the bets were reaffirmed by the release of the Personal Consumption Expenditures (PCE) Price Index on Friday. The hawkish outlook, meanwhile, remains supportive of elevated US Treasury bond yields and supports prospects for the emergence of some USD dip-buying, warranting some caution before positioning for any further appreciating move for the NZD/USD pair.
Traders might also prefer to wait on the sidelines ahead of the crucial two-day FOMC monetary policy meeting starting on Tuesday. Apart from this, investors this week will confront the release of important US macro data scheduled at the beginning of a new month, including the closely-watched Nonfarm Payrolls (NFP) on Friday. This, in turn, will play a key role in influencing the near-term USD price dynamics and help in determining the next leg of a directional move for the NZD/USD pair.
Japan’s top currency diplomat Masato Kanda said on Monday that I won't comment now” when asked by reporters about the market view that Japan intervened in the currency market this morning.
His comments come after USD/JPY got heavily sold-off from above 160.00 to as low as 155.07. Markets speculated suspected Japanese FX market intervention on over 500-pips action in the pair.
At the time of writing, USD/JPY is still down 1.26% on the day to near 156.40.
Japanese Yen price today
The table below shows the percentage change of Japanese Yen (JPY) against listed major currencies today. Japanese Yen was the strongest against the US Dollar.
| USD | EUR | GBP | CAD | AUD | JPY | NZD | CHF | |
| USD | -0.19% | -0.25% | -0.08% | -0.45% | -1.25% | -0.43% | -0.29% | |
| EUR | 0.19% | -0.07% | 0.10% | -0.26% | -1.07% | -0.25% | -0.10% | |
| GBP | 0.27% | 0.07% | 0.17% | -0.19% | -0.98% | -0.17% | -0.02% | |
| CAD | 0.09% | -0.10% | -0.17% | -0.37% | -1.15% | -0.35% | -0.21% | |
| AUD | 0.45% | 0.26% | 0.19% | 0.36% | -0.78% | 0.02% | 0.16% | |
| JPY | 1.24% | 1.05% | 0.97% | 1.15% | 0.77% | 0.81% | 0.95% | |
| NZD | 0.44% | 0.24% | 0.17% | 0.34% | -0.02% | -0.81% | 0.18% | |
| CHF | 0.30% | 0.14% | 0.03% | 0.20% | -0.16% | -0.95% | -0.14% |
The heat map shows percentage changes of major currencies against each other. The base currency is picked from the left column, while the quote currency is picked from the top row. For example, if you pick the Euro from the left column and move along the horizontal line to the Japanese Yen, the percentage change displayed in the box will represent EUR (base)/JPY (quote).
- GBP/JPY moves downward after paring intraday gains, a movement possibly linked to intervention by Japanese authorities.
- The Pound Sterling has strengthened amidst market expectations of BoE holding off on lowering borrowing costs until the next quarter.
- The significant and enduring interest rate differential between Japan and other nations is anticipated to persist for some time.
GBP/JPY has pared its daily losses, moving downward toward 195.00 during the Asian session on Monday. The Japanese Yen (JPY) has shown significant intraday strength, possibly influenced by intervention by Japanese authorities to support the domestic currency. However, no official announcements are being made. It's noteworthy that Japanese markets are closed on Monday for Showa Day.
Last Friday, the Bank of Japan (BoJ) opted to maintain its policy settings unchanged, which initially exerted downward pressure on the JPY. However, the prevailing optimistic market sentiment has also played a role in diminishing the safe-haven appeal of the JPY. Consequently, these factors have collectively supported the GBP/JPY cross. Moreover, the anticipation of a prolonged and substantial interest rate gap between Japan and other countries suggests a bias for further depreciation in the trajectory of the Japanese Yen (JPY).
Meanwhile, in the UK, the Pound Sterling (GBP) has strengthened amidst market expectations that the Bank of England (BoE) will likely hold off on lowering borrowing costs until the next quarter, as indicated by median forecasts in a Reuters poll.
According to Reuters, Bank of England Chief Economist Huw Pill remarked last week that interest rate cuts are still not imminent. Moreover, persistent inflationary pressures and robust domestic Purchasing Managers Index (PMI) figures have pushed back expectations for the first BoE rate cut.
- Gold price ticks lower on Monday amid hawkish Fed expectations and a positive risk tone.
- A modest USD downtick helps limit the downside amid persistent geopolitical tensions.
- Traders also seem reluctant ahead of the FOMC meeting and key US macro data this week.
Gold price (XAU/USD) meets with some supply during the Asian session on Monday and erases a major part of its modest gains registered over the past two days. The US Personal Consumption Expenditures (PCE) Price Index released on Friday reaffirmed expectations that the Federal Reserve (Fed) will keep interest rates higher for longer, which, in turn, is seen driving flows away from the non-yielding yellow metal. Apart from this, a generally positive tone around the equity markets further contributes to the offered tone surrounding the safe-haven commodity, though the downside potential seems limited.
The US Dollar (USD) struggles to build on Friday's goodish bounce from a two-week low and kicks off the new week on a softer note, lending some support to the Gold price. Moreover, the Israel-Hamas conflict in the Gaza Strip, so far, has shown no signs of de-escalation. This, along with the protracted Russia-Ukraine war, keeps geopolitical risks in play and might continue to act as a tailwind for the XAU/USD. Traders might also prefer to wait for the outcome of the crucial two-day FOMC meeting on Wednesday and important US macro releases, including the Nonfarm Payrolls (NFP) report on Friday.
Daily Digest Market Movers: Gold price is undermined by a combination of factors, albeit lacking follow-through selling
- The US Bureau of Economic Analysis reported on Friday that the Personal Consumption Expenditures (PCE) Price Index rose 0.3% in March, while the yearly rate climbed to 2.7% from 2.5% in February, beating estimates for a reading of 2.6%.
- Meanwhile, the core PCE Price Index, which excludes volatile food and energy prices, held steady at 2.8% as compared to 2.6% anticipated, reaffirming hawkish Federal Reserve expectations and exerting pressure on the non-yielding Gold price.
- Further, Israel-Hamas peace talks in Cairo fuel optimism about the de-escalation of tensions in the Middle East, which further boosts investors' appetite for riskier assets and contributes to driving flows away from the safe-haven precious metal.
- That said, Ukraine attacked more Russian oil refineries over the weekend and also called on more military aid from the US over worsening conditions on the front lines, keeping geopolitical risks in play and lending support to the XAU/USD.
- Apart from this, evidence that inflation in the US is not easing as initially expected should act as a tailwind for the metal, which is seen as a hedge against inflation, ahead of the crucial two-day FOMC monetary policy meeting starting on Tuesday.
- Investors this week will also confront the release of important US macro data scheduled at the beginning of a new month, including the closely-watched monthly jobs data – popularly known as the Nonfarm Payrolls (NFP) report on Friday.
Technical Analysis: Gold price needs to break through $2,352-2,353 confluence for bulls to seize near-term control
From a technical perspective, last week's bounce from levels below the $2,300 mark faced rejection near the $2,352-2,353 confluence comprising the 50% Fibonacci retracement level of the recent pullback from the all-time peak and the 200-hour Simple Moving Average (SMA). The subsequent downfall, however, showed some resilience below the 100-hour SMA and stalled near the $2,320 area (23.6% Fibo. level), which should now act as a key pivotal point. A sustained break below could make the Gold price vulnerable to retesting last week's swing low, around the $2,292-2,291 region, before dropping to the next relevant support near the $2,268-2,265 zone.
On the flip side, bulls need to wait for a move beyond the $2,352-2,353 confluence hurdle before placing fresh bets. The Gold price might then accelerate the positive move towards the next relevant hurdle near the $2,371-2,372 region en route to the $2,400 round figure. The momentum could extend further towards the all-time peak, around the $2,431-2,432 area touched earlier this month.
Gold FAQs
Gold has played a key role in human’s history as it has been widely used as a store of value and medium of exchange. Currently, apart from its shine and usage for jewelry, the precious metal is widely seen as a safe-haven asset, meaning that it is considered a good investment during turbulent times. Gold is also widely seen as a hedge against inflation and against depreciating currencies as it doesn’t rely on any specific issuer or government.
Central banks are the biggest Gold holders. In their aim to support their currencies in turbulent times, central banks tend to diversify their reserves and buy Gold to improve the perceived strength of the economy and the currency. High Gold reserves can be a source of trust for a country’s solvency. Central banks added 1,136 tonnes of Gold worth around $70 billion to their reserves in 2022, according to data from the World Gold Council. This is the highest yearly purchase since records began. Central banks from emerging economies such as China, India and Turkey are quickly increasing their Gold reserves.
Gold has an inverse correlation with the US Dollar and US Treasuries, which are both major reserve and safe-haven assets. When the Dollar depreciates, Gold tends to rise, enabling investors and central banks to diversify their assets in turbulent times. Gold is also inversely correlated with risk assets. A rally in the stock market tends to weaken Gold price, while sell-offs in riskier markets tend to favor the precious metal.
The price can move due to a wide range of factors. Geopolitical instability or fears of a deep recession can quickly make Gold price escalate due to its safe-haven status. As a yield-less asset, Gold tends to rise with lower interest rates, while higher cost of money usually weighs down on the yellow metal. Still, most moves depend on how the US Dollar (USD) behaves as the asset is priced in dollars (XAU/USD). A strong Dollar tends to keep the price of Gold controlled, whereas a weaker Dollar is likely to push Gold prices up.
- EUR/JPY faces some sell-off to 166.65 in Monday’s Asian session.
- The Japanese Yen rebounds from a multi-decade low amid the likely FX intervention from the BoJ.
- The first reading of the German Consumer Price Index (CPI) will be published later on Monday.
The EUR/JPY cross loses traction to 166.65 during the Asian session on Monday. The cross reaches the intraday low of 166.36 after retracing from 171.60, the highest level since 2008. The downtick of the cross is supported by the speculation that the Bank of Japan (BoJ) might intervene in the foreign exchange (FX) market to prevent the Japanese Yen (JPY) from depreciation.
The Japanese policymakers warned in recent weeks that they will take the necessary steps to address excessive moves in the Yen if needed after the JPY weakens to a multi-decade low. The Japanese Yen recovers early Monday amid the likely FX intervention from the BoJ, but no official statement has been made thus far as it’s a holiday in Japan.
On the other hand, European Central Bank (ECB) policymakers noted that inflation in the Eurozone is cooling down and that the ECB is still likely to begin lowering its deposit rate from a record-high 4% in June. However, investors will take more cues from the incoming inflation data. The first reading of the German Consumer Price Index (CPI) will be due on Monday. On Wednesday, the Eurozone Gross Domestic Product (GDP) for Q1 and the Harmonized Index of Consumer Prices (HICP) will be released. If the reports show a hotter-than-expected outcome, this might lift the Euro (EUR) and cap the downside of the EUR/JPY cross.
- The Australian Dollar appreciates, propelled by an increasing hawkish sentiment surrounding the RBA.
- Australia’s Retail Sales could provide insight into consumer spending habits on Tuesday.
- The US Dollar retraces its recent gains due to the possible shift toward risk-on sentiment.
The Australian Dollar (AUD) continued its winning streak on Monday that began on April 22, trading around the three-week high of 0.6560. The AUD's upward momentum is fueled by increasing hawkish sentiment surrounding the Reserve Bank of Australia (RBA), spurred by last week's CPI inflation data surpassing expectations.
The Australian Financial Review reported that Warren Hogan, chief economic adviser at Judo Bank, anticipated that the RBA implement three cash rate hikes throughout 2024, ultimately reaching 5.1%, with the initial increase likely occurring in August. Investors are likely awaiting the March Retail Sales data, scheduled for release on Tuesday, as it provides insight into Australia's consumer spending habits, which significantly impact inflation and GDP trends.
The US Dollar Index (DXY), which measures the performance of the US Dollar (USD) against six major currencies, retraces its recent gains, possibly reflecting a shift toward risk-on sentiment in the market. However, market analysts anticipate that the US Federal Reserve (Fed) will maintain the current interest rate range of 5.25%–5.5% in its upcoming announcement on Wednesday, likely due to concerns over elevated inflation levels.
On Friday, the annual US Core Personal Consumption Expenditures (PCE) Price Index data for March showed an uptick, adding weight to the notion that the Fed may delay any potential rate cuts until September, as indicated by market speculation. According to the CME FedWatch Tool, the likelihood of the Federal Reserve's (Fed) interest rates remaining unchanged in the June meeting has risen to 87.7%, up from last week’s 81.7%.
Daily Digest Market Movers: Australian Dollar appreciates on growing hawkish sentiment surrounding RBA
- Monday saw a strong surge in Australia's stock market, driven by a bullish performance on Wall Street. The ASX 200 Index extended its gains on Monday, with all 11 industry sectors recording gains following the positive momentum on Wall Street on Friday, which was fueled by impressive earnings reports from tech giants like Microsoft and Alphabet, the parent company of Google, pushing the Nasdaq up by over 2%.
- TD Securities' recent revision indicated a delay in the expected rate cut by the Reserve Bank of Australia (RBA) until February 2025, shifting from the previously projected date in November. This update has strengthened the Australian Dollar (AUD), consequently boosting the AUD/JPY pair.
- US Personal Consumption Expenditures (PCE) - Price Index increased 0.3% month-over-month in March, the same as in February, and matching market forecasts. The annual rate edged up to 2.7%, above forecasts of 2.6%.
- The US Core PCE - Price Index, the Fed’s preferred gauge to measure inflation, rose by 2.8% YoY in March 2024. Figures came above market forecasts of 2.6%. On a monthly basis, Core PCE increased by 0.3%, matching February's reading and in line with market estimates.
- In the first quarter, the US Gross Domestic Product Annualized (Q1) expanded at a slower pace, falling short of market expectations. The deceleration in GDP growth suggests potential headwinds or slowdowns in various sectors of the economy.
- Australia’s Consumer Price Index (CPI) increased to an all-time high of 137.40 points in the first quarter of 2024 from 136.10 points in the fourth quarter of 2023.
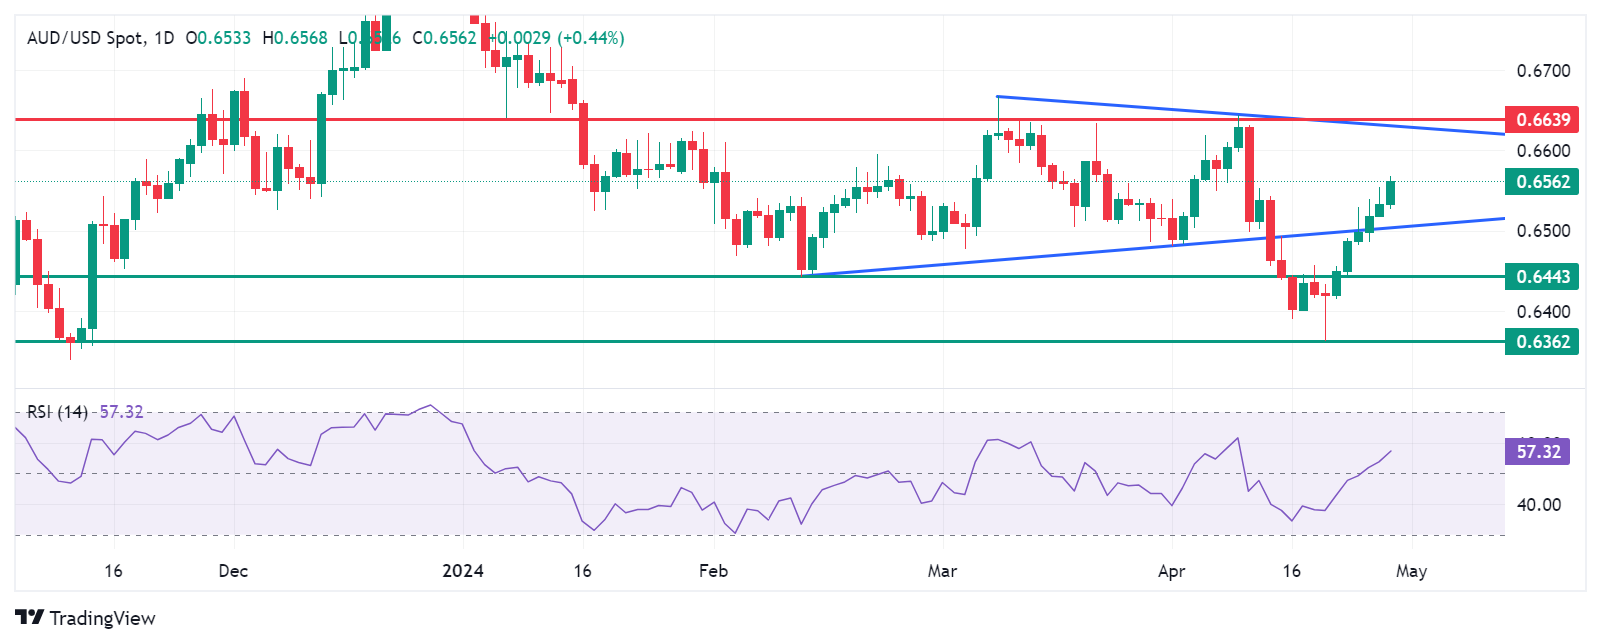
Technical Analysis: Australian Dollar holds position around 0.6550
The Australian Dollar trades around 0.6560 on Monday. The pair has extended its advance within a symmetrical triangle formation, with the 14-day Relative Strength Index (RSI) positioned above the 50-level, affirming a bullish stance.
In terms of potential upward targets, the AUD/USD pair may set its sights on the psychological barrier at 0.6600 and subsequently aim for the upper boundary of the triangle, situated around 0.6639.
On the downside, immediate support is anticipated around the psychological threshold of 0.6500. Should this level be breached, it could pave the way for further downside momentum, with the subsequent notable support zone lying around 0.6443, followed by additional support levels at April’s low of 0.6362.
AUD/USD: Daily Chart
Australian Dollar price today
The table below shows the percentage change of the Australian Dollar (AUD) against listed major currencies today. The Australian Dollar was the strongest against the Japanese Yen.
| USD | EUR | GBP | CAD | AUD | JPY | NZD | CHF | |
| USD | -0.08% | -0.12% | -0.05% | -0.33% | 0.69% | -0.22% | -0.07% | |
| EUR | 0.11% | -0.01% | 0.06% | -0.22% | 0.81% | -0.11% | 0.03% | |
| GBP | 0.13% | 0.03% | 0.07% | -0.21% | 0.82% | -0.09% | 0.06% | |
| CAD | 0.05% | -0.04% | -0.07% | -0.28% | 0.75% | -0.17% | -0.03% | |
| AUD | 0.33% | 0.24% | 0.21% | 0.28% | 1.02% | 0.11% | 0.26% | |
| JPY | -0.68% | -0.80% | -0.84% | -0.75% | -1.04% | -0.95% | -0.76% | |
| NZD | 0.22% | 0.13% | 0.08% | 0.16% | -0.12% | 0.91% | 0.15% | |
| CHF | 0.08% | -0.03% | -0.06% | -0.01% | -0.27% | 0.75% | -0.15% |
The heat map shows percentage changes of major currencies against each other. The base currency is picked from the left column, while the quote currency is picked from the top row. For example, if you pick the Euro from the left column and move along the horizontal line to the Japanese Yen, the percentage change displayed in the box will represent EUR (base)/JPY (quote).
Australian Dollar FAQs
One of the most significant factors for the Australian Dollar (AUD) is the level of interest rates set by the Reserve Bank of Australia (RBA). Because Australia is a resource-rich country another key driver is the price of its biggest export, Iron Ore. The health of the Chinese economy, its largest trading partner, is a factor, as well as inflation in Australia, its growth rate and Trade Balance. Market sentiment – whether investors are taking on more risky assets (risk-on) or seeking safe-havens (risk-off) – is also a factor, with risk-on positive for AUD.
The Reserve Bank of Australia (RBA) influences the Australian Dollar (AUD) by setting the level of interest rates that Australian banks can lend to each other. This influences the level of interest rates in the economy as a whole. The main goal of the RBA is to maintain a stable inflation rate of 2-3% by adjusting interest rates up or down. Relatively high interest rates compared to other major central banks support the AUD, and the opposite for relatively low. The RBA can also use quantitative easing and tightening to influence credit conditions, with the former AUD-negative and the latter AUD-positive.
China is Australia’s largest trading partner so the health of the Chinese economy is a major influence on the value of the Australian Dollar (AUD). When the Chinese economy is doing well it purchases more raw materials, goods and services from Australia, lifting demand for the AUD, and pushing up its value. The opposite is the case when the Chinese economy is not growing as fast as expected. Positive or negative surprises in Chinese growth data, therefore, often have a direct impact on the Australian Dollar and its pairs.
Iron Ore is Australia’s largest export, accounting for $118 billion a year according to data from 2021, with China as its primary destination. The price of Iron Ore, therefore, can be a driver of the Australian Dollar. Generally, if the price of Iron Ore rises, AUD also goes up, as aggregate demand for the currency increases. The opposite is the case if the price of Iron Ore falls. Higher Iron Ore prices also tend to result in a greater likelihood of a positive Trade Balance for Australia, which is also positive of the AUD.
The Trade Balance, which is the difference between what a country earns from its exports versus what it pays for its imports, is another factor that can influence the value of the Australian Dollar. If Australia produces highly sought after exports, then its currency will gain in value purely from the surplus demand created from foreign buyers seeking to purchase its exports versus what it spends to purchase imports. Therefore, a positive net Trade Balance strengthens the AUD, with the opposite effect if the Trade Balance is negative.
- Indian Rupee trades in positive territory on the weaker USD on Monday.
- Analysts anticipate the RBI will continue to keep its policy rate steady at 6.5% in FY25, given India's robust economy.
- The Federal Open Market Committee (FOMC) monetary policy meeting on Wednesday will be in the spotlight.
Indian Rupee (INR) recovers some lost ground on Monday amid the softer US Dollar (USD) and lower crude oil prices. There is growing speculation that the US Federal Reserve (Fed) might delay rate cuts to September as inflation was stickier than expected and remains above the Fed’s 2% target. On the other hand, Morgan Stanley analysts expect the Reserve Bank of India (RBI) is unlikely to lower interest rates in the ongoing financial year due to India's robust economic growth. The higher-for-longer stance of the RBI might support the INR and cap the upside of USD/INR. However, the rising US Treasury bond yields and rebound in oil prices might drag the local currency lower.
Looking ahead, investors will keep an eye on the US ADP Employment Change, ISM Manufacturing PMI, and the Federal Open Market Committee (FOMC) interest rate decision on Wednesday. On Friday, attention will shift to the April employment data, including the Nonfarm Payrolls, Unemployment Rate, and Average Hourly Earnings. On the Indian docket, India’s HSBC Manufacturing PMI for April will be released on Thursday.
Daily Digest Market Movers: Indian Rupee gains ground amid multiple headwinds
Deloitte India estimates India's GDP growth at 6.6% in the current fiscal year, supported by consumption expenditure, exports rebound, and capital flows.
In contrast to the global scenario, the Indian economy continues to exhibit strong economic performance with broad-based growth across sectors, according to the Monthly Economic Review report of the Department of Economic Affairs under the Finance Ministry.
The US Personal Consumption Expenditures (PCE) Price Index, climbed by 2.7% YoY in March, compared to 2.5% in February, above the market consensus of 2.6%.
The Core PCE, excluding volatile food and energy prices, held steady at 2.8% YoY in March, stronger than the expectation of 2.6%.
On a monthly basis, both headline PCE and the core PCE Price Index were in line with market expectations, rising 0.3% in March.
According to the CME FedWatch tool, the chance of a rate cut by the July meeting fell from 50% last week to 25%, while traders have priced in nearly 60% odds that the Fed will cut the interest rate at its September meeting.
Technical analysis: USD/INR remains constructive in the longer term
The Indian Rupee trades stronger on the day. The bullish outlook of USD/INR remains intact as the pair is above the key 100-day Exponential Moving Average (EMA) on the daily timeframe. Additionally, the 14-day Relative Strength Index (RSI) holds in bullish territory above the 50 midline, indicating the path of least resistance is to the upside.
The first bullish target will emerge near a high of April 15 at 83.50. Any follow-through buying will see a rally to an all-time high of 83.72. The additional upside filter to watch is the 84.00 psychological level. On the flip side, the initial support level for the pair is seen near a low of April 26 at 83.23. The crucial downside target of USD/INR is located at the 83.10–83.15 zone, representing the confluence of the 100-day EMA and a low of April 10. A breach of this level will pave the way to a low of January 15 at 82.78.
US Dollar price today
The table below shows the percentage change of US Dollar (USD) against listed major currencies today. US Dollar was the strongest against the Japanese Yen.
| USD | EUR | GBP | CAD | AUD | JPY | NZD | CHF | |
| USD | -0.09% | -0.13% | -0.07% | -0.36% | 0.68% | -0.25% | -0.08% | |
| EUR | 0.09% | -0.05% | 0.02% | -0.27% | 0.78% | -0.16% | 0.02% | |
| GBP | 0.15% | 0.05% | 0.07% | -0.22% | 0.83% | -0.11% | 0.06% | |
| CAD | 0.07% | -0.03% | -0.07% | -0.29% | 0.76% | -0.18% | -0.03% | |
| AUD | 0.36% | 0.26% | 0.22% | 0.29% | 1.05% | 0.11% | 0.27% | |
| JPY | -0.68% | -0.80% | -0.86% | -0.78% | -1.07% | -0.96% | -0.78% | |
| NZD | 0.25% | 0.16% | 0.11% | 0.18% | -0.11% | 0.95% | 0.17% | |
| CHF | 0.09% | 0.01% | -0.05% | 0.01% | -0.27% | 0.76% | -0.17% |
The heat map shows percentage changes of major currencies against each other. The base currency is picked from the left column, while the quote currency is picked from the top row. For example, if you pick the Euro from the left column and move along the horizontal line to the Japanese Yen, the percentage change displayed in the box will represent EUR (base)/JPY (quote).
Indian Rupee FAQs
The Indian Rupee (INR) is one of the most sensitive currencies to external factors. The price of Crude Oil (the country is highly dependent on imported Oil), the value of the US Dollar – most trade is conducted in USD – and the level of foreign investment, are all influential. Direct intervention by the Reserve Bank of India (RBI) in FX markets to keep the exchange rate stable, as well as the level of interest rates set by the RBI, are further major influencing factors on the Rupee.
The Reserve Bank of India (RBI) actively intervenes in forex markets to maintain a stable exchange rate, to help facilitate trade. In addition, the RBI tries to maintain the inflation rate at its 4% target by adjusting interest rates. Higher interest rates usually strengthen the Rupee. This is due to the role of the ‘carry trade’ in which investors borrow in countries with lower interest rates so as to place their money in countries’ offering relatively higher interest rates and profit from the difference.
Macroeconomic factors that influence the value of the Rupee include inflation, interest rates, the economic growth rate (GDP), the balance of trade, and inflows from foreign investment. A higher growth rate can lead to more overseas investment, pushing up demand for the Rupee. A less negative balance of trade will eventually lead to a stronger Rupee. Higher interest rates, especially real rates (interest rates less inflation) are also positive for the Rupee. A risk-on environment can lead to greater inflows of Foreign Direct and Indirect Investment (FDI and FII), which also benefit the Rupee.
Higher inflation, particularly, if it is comparatively higher than India’s peers, is generally negative for the currency as it reflects devaluation through oversupply. Inflation also increases the cost of exports, leading to more Rupees being sold to purchase foreign imports, which is Rupee-negative. At the same time, higher inflation usually leads to the Reserve Bank of India (RBI) raising interest rates and this can be positive for the Rupee, due to increased demand from international investors. The opposite effect is true of lower inflation.
- WTI drifts lower on Monday amid concerns about slowing fuel demand.
- Geopolitical risks remain in play and should help limit any further losses.
- Traders now await this week’s central bank event risk and key macro data.
West Texas Intermediate (WTI) US crude Oil prices kick off the new week on a weaker note and slide below the $83.00/barrel mark during the Asian session.
Against the backdrop of receding fears about a further escalation of the Israel-Iran conflict, concerns that higher interest rates in the US will dent fuel demand in the world's top consumer and exert some pressure on the black liquid. The worries were reaffirmed by weaker-than-expected US Q1 GDP growth figures released last week.
Furthermore, the US Personal Consumption Expenditures (PCE) Price Index released on Friday cemented expectations that the Federal Reserve (Fed) will delay cutting interest rates. The hawkish outlook, meanwhile, remains supportive of the underlying bullish tone around the US Dollar (USD) and might continue to weigh on Crude Oil prices.
Meanwhile, Ukraine attacked more Russian oil refineries over the weekend. This comes after Russia announced more export and production cuts earlier this year, which, along with little signs of de-escalation of tensions in the Middle East, keep supply risks in play and should help limit any meaningful downside for Crude Oil prices.
Market participants now look forward to Tuesday's release of official PMI prints from China – the world's top Oil importer – for a fresh impetus. The focus will then shift to the outcome of a two-day FOMC policy meeting on Wednesday and important US macro data, including the NFP report, scheduled at the beginning of a new month.
Nevertheless, the aforementioned mixed fundamental backdrop warrants some caution before placing aggressive directional bets and positioning for a further intraday depreciating move in the absence of any relevant economic data from the US on Monday.
| Raw materials | Closed | Change, % |
|---|---|---|
| Silver | 27.193 | -0.83 |
| Gold | 2337.24 | 0.2 |
| Palladium | 953.03 | -3.13 |
- The Japanese Yen dives to a nearly 40-year low amid relatively thin liquidity on Monday.
- The divergent BoJ-Fed monetary policy and a positive risk tone weigh heavily on the JPY.
- Intervention fears cap USD/JPY amid a modest USD downtick and overbought conditions.
The Japanese Yen (JPY) remains under heavy selling pressure on the first day of a new week, pushing the USD/JPY pair above the 160.00 psychological mark for the first time since October 1986. A big divergence in the Bank of Japan's policy outlook and hawkish Federal Reserve expectations continue to undermine the JPY amid relatively thin liquidity on the back of a holiday in Japanese markets. That said, extremely overbought conditions and fears about a possible intervention from Japan to prop up its currency help limit further losses. Apart from this, a modest US Dollar (USD) downtick caps gains for the currency pair, though any meaningful JPY appreciation still seems elusive in the wake of the BoJ's uncertain rate outlook.
Furthermore, the US Personal Consumption Expenditures (PCE) Price Index released on Friday reaffirmed expectations that the Federal Reserve (Fed) will wait until September before cutting interest rates. This should continue to act as a tailwind for the Greenback. Apart from this, a generally positive risk tone could undermine the safe-haven JPY and suggests that the path of least resistance for the USD/JPY pair is to the upside ahead of the crucial two-day FOMC policy meeting starting on Tuesday. Investors this week will also confront the release of important US macro data scheduled at the beginning of a new month, including the closely-watched Nonfarm Payrolls (NFP) on Friday before placing fresh directional bets.
Daily Digest Market Movers: Japanese Yen is undermined by BoJ’s cautious approach towards further policy tightening
The Japanese Yen plummets to a fresh multi-decade low during the Asian session on Monday amid a big divergence in the Bank of Japan's policy outlook and hawkish Federal Reserve expectations, though intervention fears cap gains.
As was widely anticipated, the BoJ left its short-term interest rates unchanged on Friday and indicated that inflation was on track to hit the 2% target in coming years, suggesting its readiness to hike borrowing costs later this year.
In the post-meeting press conference, BoJ Governor Kazuo Ueda offered few clues on when the next rate hike will come and ruled out shifting to a full-fledged reduction in the bond purchases, warranting caution for the JPY bulls.
Moreover, the Tokyo Consumer Price Index released on Friday indicated that inflation in Japan is cooling, which, along with a generally positive tone around the equity markets, should cap any meaningful upside for the safe-haven JPY.
Japan's ruling Liberal Democratic Party lost three key by-election seats, which is not seen as a vote of confidence in Prime Minister Fumio Kishida and argued against him being reappointed at the end of the term in September.
The US Bureau of Economic Analysis reported that the Personal Consumption Expenditures (PCE) Price Index rose 0.3% in March, while the yearly rate climbed to 2.7% from 2.5% in February, beating estimates for a reading of 2.6%.
Adding to this, the core PCE Price Index, which excludes volatile food and energy prices, held steady at the 2.8% YoY rate as compared to 2.6% anticipated, reaffirming bets that the Federal Reserve will keep rates higher for longer.
According to the CME Group's FedWatch tool, investors are now pricing in a 58% chance that the Fed will begin its rate-cutting cycle in September, down from 68% a week ago, and a more than 80% possibility of easing in December.
This suggests that the wide gap in rates between Japan and the United States will remain for some time, which, along with a positive risk tone, should cap the upside for the safe-haven JPY and lend support to the USD/JPY pair.
Investors now look forward to this week's key central bank event risk – a two-day FOMC monetary policy meeting starting on Tuesday and the closely-watched US Nonfarm Payrolls (NFP) report – for a fresh directional impetus.
Technical Analysis: USD/JPY looks to build on Friday’s ascending channel breakout, overbought RSI warrants caution
From a technical perspective, Friday's breakout through an upward-sloping trend channel extending from the YTD low was seen as a fresh trigger for bullish traders. That said, the Relative Strength Index (RSI) on the daily chart is flashing extremely overbought conditions, which makes it prudent to wait for some near-term consolidation or a modest pullback before positioning for further gains. That said, any meaningful slide below the 159.00 mark is likely to attract fresh buyers near the 158.35-158.30 region and remain limited near the 158.00 mark. A convincing break below, however, might prompt some technical selling and drag the USD/JPY pair back towards the ascending channel resistance breakpoint near the 157.00 round figures. Bulls, meanwhile, will remain wary of placing fresh bets amid fears that Japanese authorities will intervene near the 160.00 pivotal point.
Japanese Yen FAQs
The Japanese Yen (JPY) is one of the world’s most traded currencies. Its value is broadly determined by the performance of the Japanese economy, but more specifically by the Bank of Japan’s policy, the differential between Japanese and US bond yields, or risk sentiment among traders, among other factors.
One of the Bank of Japan’s mandates is currency control, so its moves are key for the Yen. The BoJ has directly intervened in currency markets sometimes, generally to lower the value of the Yen, although it refrains from doing it often due to political concerns of its main trading partners. The current BoJ ultra-loose monetary policy, based on massive stimulus to the economy, has caused the Yen to depreciate against its main currency peers. This process has exacerbated more recently due to an increasing policy divergence between the Bank of Japan and other main central banks, which have opted to increase interest rates sharply to fight decades-high levels of inflation.
The BoJ’s stance of sticking to ultra-loose monetary policy has led to a widening policy divergence with other central banks, particularly with the US Federal Reserve. This supports a widening of the differential between the 10-year US and Japanese bonds, which favors the US Dollar against the Japanese Yen.
The Japanese Yen is often seen as a safe-haven investment. This means that in times of market stress, investors are more likely to put their money in the Japanese currency due to its supposed reliability and stability. Turbulent times are likely to strengthen the Yen’s value against other currencies seen as more risky to invest in.
Kyo News Agency reported late Sunday that Japan's ruling Liberal Democratic Party (LDP), headed by Prime Minister (PM) Fumio Kishida, lost three key seats in House of Representatives by-elections held earlier Sunday.
This comes even as the LDP chose not to contest in the Nagasaki and Tokyo by-elections. But it lost Shimane, a long-time held LDP prefecture.
The leading opposition Constitutional Democratic Party of Japan, led by left-leaning lower house lawmaker Kenta Izumi since November 2021, acquired all three seats by obtaining support from anti-LDP voters.
LDP Secretary General Toshimitsu Motegi, its No. 2 personnel after Kishida, told reporters in Tokyo, "We will humbly accept the results" of Sunday's by-elections, adding that the party "needs to work as one to grapple with the challenge."
Kishida's term as party president expires in September and the defeat is unlikely to work in his favor later this year.
- The Australian Dollar surges driven by growing hawkish sentiment surrounding RBA, following the hot CPI data.
- Judo Bank chief economic adviser Warren Hogan predicts that the RBA might increase the cash rate three times in 2024.
- The safe-haven JPY loses ground due to the uncertainty surrounding the BoJ's rate outlook.
AUD/JPY continues its winning streak for the sixth successive session on Monday, hovering around 104.50, a level not seen since April 2013. The persistent upward momentum of the AUD/JPY pair is driven by the increasing hawkish sentiment surrounding the Reserve Bank of Australia (RBA), following the release of last week's Consumer Price Index (CPI) inflation data.
The unexpected surge in inflation figures prompted economists to revise their earlier forecasts significantly. Warren Hogan, chief economic adviser at Judo Bank, told “The Australian Financial Review” his anticipation of the central bank raising the cash rate three times this year, reaching 5.1%, with the first hike likely in August. Investors now look forward to Retail Sales for March on Tuesday, which gauges Australia’s consumer spending. It has a significant bearing on Australia’s inflation and GDP.
The Japanese Yen (JPY) tumbled to new multi-decade lows following the Bank of Japan's (BoJ) decision to maintain policy settings unchanged on Friday. Uncertainty surrounding the BoJ's rate outlook, indications of cooling inflation in Japan, and a generally optimistic sentiment in equity markets are pivotal factors eroding the safe-haven appeal of the JPY.
Furthermore, expectations for a prolonged wide interest rate differential between Japan and the other countries imply that the JPY's trajectory is biased towards further decline. With Japanese markets closed on Monday for Showa Day, market dynamics may see limited shifts in the absence of trading activity.
Daily Digest Market Movers: AUD/JPY rises on increasing hawkish sentiment surrounding RBA
- Australia's stock market experienced a robust rally on Monday, inspired by a strong performance on Wall Street. The ASX 200 Index recovered some ground lost on Friday, with all 11 industry sectors trading in positive territory. Friday's rally on Wall Street was fueled by impressive earnings reports from tech giants such as Microsoft and Google's parent company, Alphabet, propelling the Nasdaq up by more than 2%
- On Friday, TD Securities' revision suggests a postponement of the anticipated rate cut by the Reserve Bank of Australia (RBA) until February 2025, shifting from the previously anticipated date in November. This development strengthens the Australian Dollar (AUD) and, in turn, bolsters the AUD/JPY pair.
- BoJ Governor Kazuo Ueda provided insights into the central bank's decision to maintain the status quo during the post-policy meeting press conference on Friday. Ueda outlined that the BoJ will adjust the degree of monetary easing if the underlying inflation rate rises. Additionally, He emphasized that easy financial conditions will be maintained for the time being, indicating the BoJ's commitment to supporting economic recovery and stability through accommodative monetary measures.
- Tokyo Consumer Price Index rose 1.8% YoY in April, well below the previous print of 2.6%. Markets were broadly expecting Tokyo inflation to hold steady over the period. The Core CPI fell sharply to 1.6% year-on-year, marking its lowest level since March 2022 and falling well below forecasts of 2.2%.
- On Friday, a report from Reuters said that the Bank of Japan (BOJ) is expected to project that inflation will remain close to its 2% target in the coming years and signal its preparedness to raise interest rates from their near-zero levels. This stance by the BOJ is aimed at preventing Yen depreciation and discouraging market participants from pushing the currency to fresh 34-year lows.
- Australia’s Consumer Price Index (CPI) increased to an all-time high of 137.40 points in the first quarter of 2024 from 136.10 points in the fourth quarter of 2023.
- As reported by the Japan Times, the percentage of Japanese companies aiming to raise their pay scales has surged to 70.7%, representing a notable increase of 6.3 percentage points compared to the prior year. Furthermore, the number of companies intending to implement pay-scale hikes and regular pay increases totaling 5% or higher has nearly doubled from the previous year, reaching 36.5%. This trend holds the potential to enhance the purchasing power of individuals, potentially leading to an uptick in consumer prices.
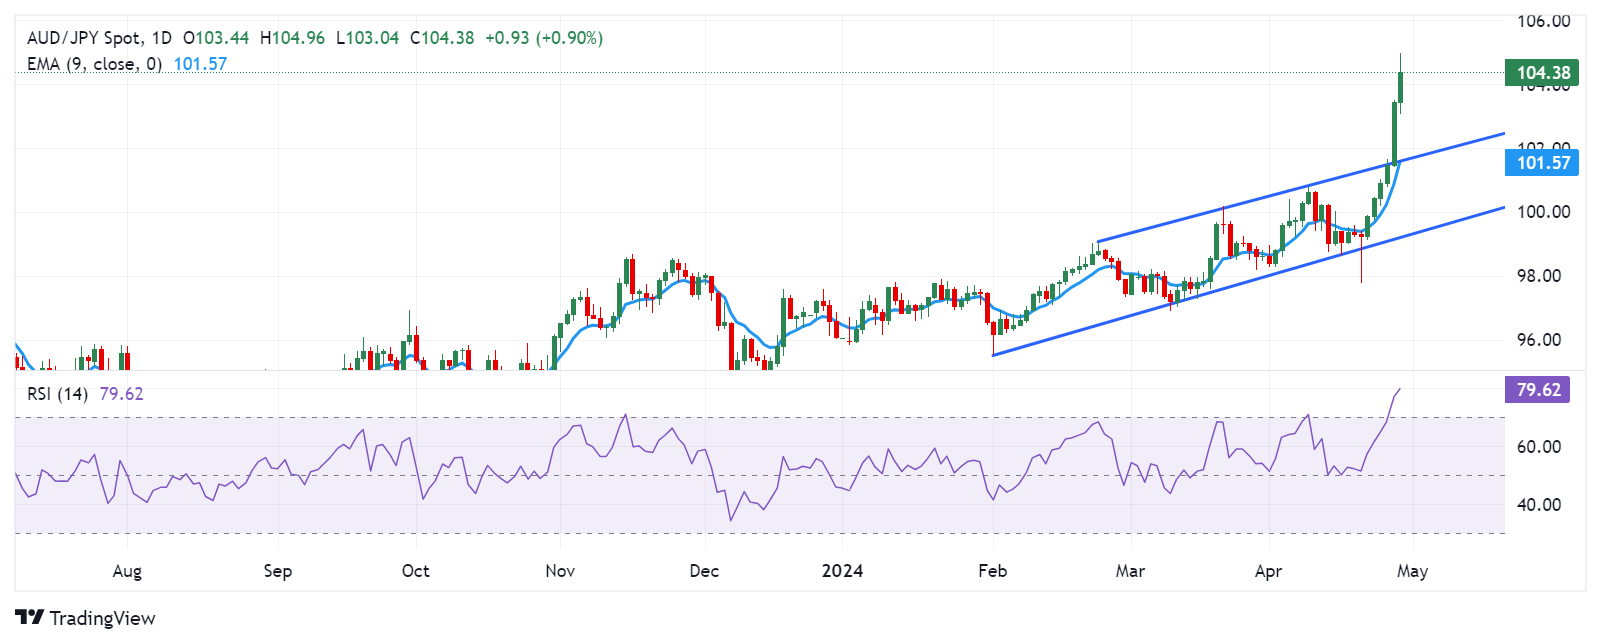
Technical Analysis: AUD/JPY surges to the major level of 104.50
The AUD/JPY trades around 104.50 on Monday, surpassing the upper boundary of the daily ascending channel. Additionally, the 14-day Relative Strength Index (RSI) is trending above the 50-level, strengthening the bullish sentiment. The immediate resistance is seen at the psychological level of 105.00. A breakthrough above this level could support the cross to test the highest level of 105.43 recorded in April 2013.
On the downside, immediate support for the AUD/JPY pair could be found at the psychological level of 104.00. If the pair breaches below this level, the AUD/JPY cross could lead to a further decline toward the nine-day Exponential Moving Average (EMA) at 101.59, aligned with the lower boundary of the ascending channel and a major level of 101.50.
AUD/JPY: Daily Chart
Australian Dollar price today
The table below shows the percentage change of the Australian Dollar (AUD) against listed major currencies today. The Australian Dollar was the strongest against the Japanese Yen.
| USD | EUR | GBP | CAD | AUD | JPY | NZD | CHF | |
| USD | -0.07% | -0.11% | -0.05% | -0.28% | 0.55% | -0.23% | -0.12% | |
| EUR | 0.07% | -0.04% | 0.01% | -0.21% | 0.61% | -0.15% | -0.04% | |
| GBP | 0.12% | 0.04% | 0.06% | -0.16% | 0.67% | -0.12% | 0.01% | |
| CAD | 0.05% | -0.02% | -0.06% | -0.22% | 0.61% | -0.18% | -0.08% | |
| AUD | 0.28% | 0.20% | 0.16% | 0.22% | 0.83% | 0.05% | 0.16% | |
| JPY | -0.63% | -0.71% | -0.76% | -0.69% | -0.94% | -0.87% | -0.76% | |
| NZD | 0.23% | 0.15% | 0.10% | 0.17% | -0.05% | 0.77% | 0.11% | |
| CHF | 0.13% | 0.06% | 0.00% | 0.06% | -0.16% | 0.66% | -0.11% |
The heat map shows percentage changes of major currencies against each other. The base currency is picked from the left column, while the quote currency is picked from the top row. For example, if you pick the Euro from the left column and move along the horizontal line to the Japanese Yen, the percentage change displayed in the box will represent EUR (base)/JPY (quote).
Australian Dollar FAQs
One of the most significant factors for the Australian Dollar (AUD) is the level of interest rates set by the Reserve Bank of Australia (RBA). Because Australia is a resource-rich country another key driver is the price of its biggest export, Iron Ore. The health of the Chinese economy, its largest trading partner, is a factor, as well as inflation in Australia, its growth rate, and Trade Balance. Market sentiment – whether investors are taking on more risky assets (risk-on) or seeking safe havens (risk-off) – is also a factor, with risk-on positive for AUD.
The Reserve Bank of Australia (RBA) influences the Australian Dollar (AUD) by setting the level of interest rates that Australian banks can lend to each other. This influences the level of interest rates in the economy as a whole. The main goal of the RBA is to maintain a stable inflation rate of 2-3% by adjusting interest rates up or down. Relatively high interest rates compared to other major central banks support the AUD, and the opposite for relatively low. The RBA can also use quantitative easing and tightening to influence credit conditions, with the former AUD-negative and the latter AUD-positive.
China is Australia’s largest trading partner so the health of the Chinese economy is a major influence on the value of the Australian Dollar (AUD). When the Chinese economy is doing well it purchases more raw materials, goods and services from Australia, lifting demand for the AUD, and pushing up its value. The opposite is the case when the Chinese economy is not growing as fast as expected. Positive or negative surprises in Chinese growth data, therefore, often have a direct impact on the Australian Dollar and its pairs.
Iron Ore is Australia’s largest export, accounting for $118 billion a year according to data from 2021, with China as its primary destination. The price of Iron Ore, therefore, can be a driver of the Australian Dollar. Generally, if the price of Iron Ore rises, AUD also goes up, as aggregate demand for the currency increases. The opposite is the case if the price of Iron Ore falls. Higher Iron Ore prices also tend to result in a greater likelihood of a positive Trade Balance for Australia, which is also positive of the AUD.
The Trade Balance, which is the difference between what a country earns from its exports versus what it pays for its imports, is another factor that can influence the value of the Australian Dollar. If Australia produces highly sought after exports, then its currency will gain in value purely from the surplus demand created from foreign buyers seeking to purchase its exports versus what it spends to purchase imports. Therefore, a positive net Trade Balance strengthens the AUD, with the opposite effect if the Trade Balance is negative.
- GBP/USD trades on a positive note around 1.2520 amid weaker USD on Monday.
- The recent US PCE inflation data dialed back their expectation of when the Federal Reserve (Fed) will start cutting interest rates.
- Investors increased their bets that the BoE will start cutting rates in June.
The GBP/USD pair holds positive ground near 1.2520 on Monday during the early Asian session. The uptick of the major pair is supported by the softer US Dollar (USD) below the 106.00 psychological mark. Investors will closely monitor the Federal Open Market Committee (FOMC) interest rate decision and Press Conference on Wednesday.
The US Federal Reserve (Fed) is expected to leave the interest rate unchanged in its current 5.25%–5.5% range on Wednesday. The US economy remains strong, and inflation has started to turn higher. On Friday, the US Bureau of Economic Analysis showed the Core Personal Consumption Expenditures (PCE) Price Index rose 2.8% YoY in March. These reports have triggered speculation that the first cut might not come until September.
The Fed policymakers noted that rate cuts are not coming in the next several months as inflation was stickier than expected and remains above the Fed’s 2% target. The higher-for-longer stance from the US central bank might provide some support to the Greenback and cap the downside of the GBP/USD pair.
On the other hand, investors raise their bets that the Bank of England (BoE) will start lowering borrowing costs in its June meeting. The BoE Governor Andrew Bailey said during the press conference after the last monetary policy meeting that two or three rate cuts this year are not "unreasonable." A dovish shift in the BoE remarks might lead to a weaker Pound Sterling (GBP) and create a headwind for the pair.
On Monday, the People’s Bank of China (PBoC) set the USD/CNY central rate for the trading session ahead at 7.1066 as compared to Friday's fix of 7.1056 and 7.2579 Reuters estimates.
- EUR/USD gains ground 1.0710 amid the softer USD on Monday.
- The US PCE inflation rose by 2.7% YoY in March, compared to 2.5% prior, which was hotter-than-expected.
- The ECB might cut interest rates before the Fed amid the cooler inflation in the Eurozone.
The EUR/USD pair trades on a stronger note around 1.0710 during the early Asian trading hours on Monday. The weaker US Dollar (USD) below the 106.00 mark provides some support to the major pair. The first reading of the German Consumer Price Index (CPI) for April is due on Monday. All eyes will be on the Federal Reserve monetary policy meeting on Wednesday, with no change in rate expected.
The recent US inflation data dialed back their expectation of when the Federal Reserve (Fed) will start cutting interest rates. According to the CME FedWatch tool, the chance of a rate cut by the July meeting falls from 50% last week to 25%, while traders have priced in nearly 60% odds that the Fed will cut the interest rate at its September meeting. This, in turn, might lift the Greenback and cap the upside of the EUR/USD pair in the near term.
The US Bureau of Economic Analysis revealed on Friday that the Personal Consumption Expenditures (PCE) Price Index rose by 2.7% YoY in March, compared to the previous reading of 2.5%, above the 2.6% estimated. The Core PCE figure, the Fed's preferred inflation measure, held steady at 2.8% YoY in March, firmer than the 2.6% expected. On a monthly basis, both headline PCE and the core PCE Price Index rose 0.3% in March.
Across the pond, the European Central Bank (ECB) emphasized cooler inflation in the Eurozone and signaled that the ECB might cut interest rates before the Fed. ECB President Christine Lagarde hinted that the central bank is still likely to begin lowering its deposit rate from a record-high 4% in June, but has been careful to leave open its options for the path beyond.
| Index | Change, points | Closed | Change, % |
|---|---|---|---|
| NIKKEI 225 | 306.28 | 37934.76 | 0.81 |
| Hang Seng | 366.61 | 17651.15 | 2.12 |
| KOSPI | 27.71 | 2656.33 | 1.05 |
| ASX 200 | -107.1 | 7575.9 | -1.39 |
| DAX | 243.73 | 18161.01 | 1.36 |
| CAC 40 | 71.59 | 8088.24 | 0.89 |
| Dow Jones | 153.86 | 38239.66 | 0.4 |
| S&P 500 | 51.54 | 5099.96 | 1.02 |
| NASDAQ Composite | 316.14 | 15927.9 | 2.03 |
| Pare | Closed | Change, % |
|---|---|---|
| AUDUSD | 0.6533 | 0.21 |
| EURJPY | 169.259 | 1.41 |
| EURUSD | 1.06941 | -0.33 |
| GBPJPY | 197.747 | 1.6 |
| GBPUSD | 1.24926 | -0.15 |
| NZDUSD | 0.59401 | -0.15 |
| USDCAD | 1.36679 | 0.08 |
| USDCHF | 0.91444 | 0.26 |
| USDJPY | 158.293 | 1.75 |
- Gold price edges lower to $2,335 in Monday’s early Asian session.
- The recent US inflation data added to market doubts about near-term US Fed rate cuts.
- Any escalating Middle East geopolitical tensions might boost safe-haven flows, benefiting precious metals.
Gold price (XAU/USD) trades on a softer note near $2,335 on Monday during the early Asian session. The recent US economic data showed that US inflationary pressures staying firm, which has added further to market doubts about near-term US Federal Reserve (Fed) rate cuts. On Wednesday, the Federal Reserve's (Fed) interest rate decision will be a closely watched event.
Meanwhile, the US Dollar Index (DXY), a measure of the value of the USD against a weighted basket of currencies used by US trade partners, drops to 106.00. The US Treasury bond yields edge lower, with the 10-year yield falling to 4.667%.
On Friday, the headline and Core Personal Consumption Expenditures (PCE) Price Index for March were in line with expectations, rising by 0.3% MoM. The annual headline inflation came in at 2.7% YoY in March from 2.5% in February, hotter than the 2.6% expected. Core PCE inflation increased by 2.8% YoY, above expectations of 2.6%.
Futures markets have priced in nearly 60% odds that the Fed will cut the interest rate at its September meeting, slightly more than before the report, according to the CME FedWatch tool. The US Fed is anticipated to keep the policy rate in its current 5.25%–5.5% range on Wednesday and to continue to signal no urgency on cuts. The hawkish stance in market sentiment could diminish the appeal of non-yielding metals and weigh on the gold price.
On Saturday, Hamas said that it was reviewing a fresh Israeli proposal for a cease-fire in Gaza. It came as Egypt intensified its attempts to secure an agreement between Israel and Hamas to halt the conflict and avoid an Israeli military invasion into the southern Gaza city of Rafah, per the Guardian. Gold traders will monitor the development surrounding the geopolitical risks in the Middle East. Any escalating tensions might boost traditional safe-haven assets like gold.
FOREIGN EXCHANGE MARKET NEWS
CURRENCY MARKET DEFINITION
The concept of currency market has several definitions:
- Currency market is the sphere of economic relations that are manifested in the purchase and sale of currency values (foreign currency, securities in foreign currency), as well as operations related to the investment of capital in foreign currency;
- Currency market is a financial center where currency purchase and sale transactions based on supply and demand for them are concentrated;
- Curency market is a whole of authorized banks, investment companies, brokerages, exchanges, and foreign banks that perform foreign exchange operations.
- Currency market is a whole of communications systems that link banks in different countries that conduct international currency transactions.
Simply put, currency market is the market where currency transactions are made, that is, the currency of one country is exchanged for the currency of another country at a certain exchange rate. The exchange rate is the relative price of currencies of two countries or the currency of one country expressed in another country's monetary units.
Currency market is part of the global financial market, where many operations related to the global movement of capital take place.
TYPES OF MARKETS. RUSSIAN AND INTERNATIONAL CURRENCY MARKETS
There are international and domestic currency markets.
Domestic currency market — is a market within a single country.
The international currency market — is a global market that covers currency markets of all countries in the world. It does not have a specific site where trading is carried out. All operations within it are carried out through a system of cable and satellite channels that link the world's regional currency markets. Regional markets today include the Asian (with centers in Tokyo, Hong Kong, Singapore, and Melbourne), the European (London, Frankfurt am Main, and Zurich), and the American (New York, Chicago, and Los Angeles) markets.
Currency trading on the international currency market is carried out on the basis of market exchange rates, which are set on the basis of supply and demand in the market and under the influence of various macroeconomic data. Forex is the international currency market.
Currency markets can also be divided into exchange and over-the-counter markets. Exchange currency market is an organized market where trading is carried out through an exchange—a special company that sets trading rules and provides all the conditions for organizing trading under these rules.
Over-the-counter currency market — is a market where there are no certain trading rules, and purchase and sale operations are not linked to a specific place of trade, as opposed to the case of an exchange.
As a rule, an over-the-counter currency market is organized by special companies that provide services for the purchase and sale of currencies, which may or may not be members of the currency exchange. Trading operations in this market are now carried out mainly via the Internet.
The over-the-counter currency market is much larger than the exchange market in terms of trading volume. The Forex international over-the-counter currency market is considered the most liquid in the world. It operates around the clock in all financial centers of the world (from New York to Tokyo).
CURRENCY MARKET FUNCTIONS
Currency market— is the most important platform for ensuring the normal course of all global economic processes.
The main macroeconomic functions of the currency market are:
- creating conditions for the subjects of foreign exchange relations to make timely international current and capital payments and thereby promoting the development of foreign trade;
- providing conditions and mechanisms for the implementation of monetary and economic policy of the state;
- diversifying foreign exchange reserves;
- forming the exchange rate under the influence of supply and demand;
NEWS IMPACT
Various currencies are the main trading tool in the currency market. Exchange rates are formed under the influence of supply and demand in the market.
In addition to that, currency rates are influenced by many fundamental factors related to the global economic situation, events in national economies, and political decisions.
News about these factors can be found in various sources:
- Reports showing a country´s level of economic development.
The more stable an economy is developing, the more stable its currency is. Accordingly, it is possible to predict how the currency will behave in the near future, based on statistical data published in official sources of countries with a certain regularity.
This data includes:
- GDP
- unemployment;
- return on equity;
- consumer price index;
- industrial price index;
- propensity to consume;
- salaries outside of the agricultural sector;
- residential construction, etc.
Interest rate level, set by national authorities regulating credit policy, is an equally important indicator. In the European Union, this is ECB–the European Central Bank, in the US, this is the Federal Reserve System, in Japan—the Bank of Japan, in the UK—the Bank of England, in Switzerland—the Swiss national Bank, etc.
The interest rate level is determined at meetings of the national central bank. Then, the decision on the rate is published in official sources. If the central bank of a country reduces the interest rate, the money supply in the country increases, and the national currency depreciates against other world currencies. If the interest rate increases, the national currency will strengthen.
- Speeches of country leaders, leading economists and analysts.
A speech or even a separate statement by a country's leader can reverse a trend. Speeches on these topics may change the currency exchange rate:
- analysis of the situation on the currency market;
- changes in monetary or economic policy;
- adoption of a budget policy;
- forecasts of the economic situation, etc.
All this news is published in various sources. Major international news is more or less easy to find in Russian, but news related to the domestic economic policy and the economy of foreign countries is much less common in the Russian press. Mostly, such news is published by the national media and in the language of the country where the news is published.
It is very difficult for one person to follow all the news at once, and they are likely to miss some important event that can turn the whole situation on the market upside down. Guided by our main principle—to create the best trading conditions for our customers—we try to select the most important news from all over the world and publish them on our website.
The TeleTRADE Department of Analytics monitors news on most national and international news sources on a daily basis and identifies those that can potentially affect exchange rates. These are the main news items that are included in our news feed.
In addition, all our clients have free access to the Dow Jones news feed. This is a joint project of Dow Jones Newswires, the world's largest news agency, and the leading Russian news agency Prime-TASS. The news feed is created specifically for currency traders and those who are interested in getting information about the world's currency markets.


© 2000-2024. All rights reserved.
This site is managed by Teletrade D.J. LLC 2351 LLC 2022 (Euro House, Richmond Hill Road, Kingstown, VC0100, St. Vincent and the Grenadines).
The information on this website is for informational purposes only and does not constitute any investment advice.
The company does not serve or provide services to customers who are residents of the US, Canada, Iran, The Democratic People's Republic of Korea, Yemen and FATF blacklisted countries.
Making transactions on financial markets with marginal financial instruments opens up wide possibilities and allows investors who are willing to take risks to earn high profits, carrying a potentially high risk of losses at the same time. Therefore you should responsibly approach the issue of choosing the appropriate investment strategy, taking the available resources into account, before starting trading.
Use of the information: full or partial use of materials from this website must always be referenced to TeleTrade as the source of information. Use of the materials on the Internet must be accompanied by a hyperlink to teletrade.org. Automatic import of materials and information from this website is prohibited.
Please contact our PR department if you have any questions or need assistance at pr@teletrade.global.
transfers